Performance Analysis of Data Mining Techniques
on Lifestyle Diseases
Divya Sharma1, Anand Sharma2, Vibhakar Mansotra3
1,3Department of Computer Science and IT, University of Jammu, J&K, India 2UCCA, Guru Kashi University, Talwandi Sabo, Bhatinda, Punjab, India
Abstract - Data Mining is the process of knowledge discovery that analyzes the data and create useful patterns from it. A pattern is interesting if it is valid for a given test data and easily understood by humans. The huge amount of data generated for the prediction of lifestyle diseases is too complex and of great size that is difficult to be processed and analyzed by traditional old methods. Advanced Data Mining tools and techniques overcome this problem by discovering hidden patterns and useful information from large and complex data. The aim of the present study is to do the performance analysis of several data mining classification techniques using three different data mining tools over the different lifestyle disease datasets and the data is taken from Indian hospitals and not from UCI repository. In this study, different data mining classification techniques has been conducted on two lifestyle diseases i.e. Heart Disease dataset and Type II Diabetes dataset. The performance analysis is based on the percentage of accuracy and error rate of every applied classification technique. Conclusion: This paper highlights the important role played by data mining tools in analyzing the hidden knowledge from huge volumes of data by using 10 fold cross validation method.
Keywords: Data Mining, Classification Techniques, Lifestyle diseases datasets and Data Mining Tools
I. INTRODUCTION
In today’s age of information, the useful information is needed but it is difficult to extract from large volume of data, so we need powerful analytical solution in order to get the information that is stored in organization’s databases or repositories. Data Mining is the application of algorithm or methods that extract patterns from huge volume of data [1]. There is a wealth of data available in the hospitals regarding lifestyle diseases i.e. rich in information but poor in knowledge [2]. Hence, this useful knowledge is extracted through data mining techniques.
Therefore, Data Mining classification techniques are used for the extraction and exploitation of patterns and relationship among the large number of variables and help to predict the fruitful outcomes.
In this paper, we conduct the performance analysis of various data mining classification techniques on lifestyle disease. And our work helped to determining the best classification technique from the rest of techniques by calculating their accuracy and error rate. For this, we have practiced on two lifestyle diseases and the data is taken from Indian Hospitals. The two lifestyle disease that is considered is Heart Disease and Type II Diabetes. Lifestyle disease includes the diseases that are associated with the way a person or group of people lives. Bad food habits, physical inactivity, wrong body posture, and disturbed biological clock are the main factors that contribute to lifestyle diseases [3]. And the classification techniques that are applied on Lifestyle disease are K- Nearest Neighbours (K-NN), Naïve Bayes (NB), Support Vector Machine (SVM), Decision tree, SimpleCart, REPTree, J48, Random Forest etc.
The performance of these techniques measured according to their accuracy. Data mining tools like Rapid Miner, WEKA, MATLAB are used to handle classification problems. This study helps the researchers to determine the best classification technique among the rest of the techniques on the basis of better results from the available data within the datasets. The data mining tools that are used in our research are very useful and easy for the prediction of lifestyle diseases.
II. RESEARCH METHODOLOGY
A. RapidMiner
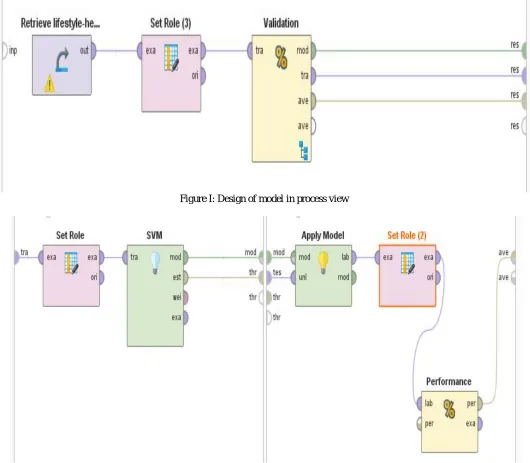
[image:3.612.51.581.174.637.2]RapidMiner is one of the leading open source software for data mining [4]. RapidMiner has a comfortable user interface. RapidMiner consists of repository, operators, parameters, process view and help box. The whole model is designed in process view. In case of complex analysis situation, the process is divided into sub-process. The validation operator design the sub processes. Validation is either cross validation or split validation. Figure I shows the design of model in the process view and figure II shows the sub process in validation operator.
Figure I: Design of model in process view
Figure II: the sub process in validation
B. WEKA
Figure III: Knowledge flow diagram in WEKA
C. MATLAB
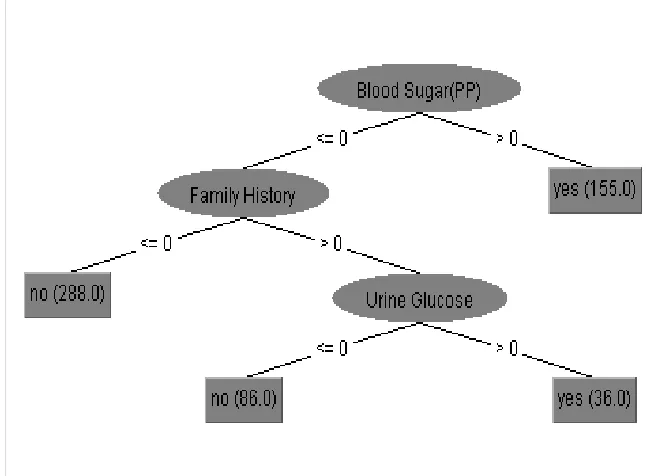
MATLAB (Matrix Laboratory) is a high level language and interactive environment for visualization, numerical computation and programming. MATLAB is a powerful tool that is capable of performing data mining tasks, which can be used to examine data, develop algorithms and create models and applications [5]. MATLAB can be used as a standalone tool and build-in math functions that enable the researcher to explore multiple approaches and reach a solution faster in comparison to spreadsheets of traditional programming languages. Figure IV shows the tree of decision tree algorithm in MATLAB.
Figure IV: Decision Tree of dataset in MATLAB
III. EXPERIMENTAL RESULTS AND ANALYSIS
[image:4.612.146.469.405.643.2]TABLE I
DATASET DESCRIPTION
Dataset Attributes Instances Classes
Heart Disease 13 287 2
Type II Diabetes 10 565 2
In this study three data mining tools are used i.e. RapidMiner, WEKA and MATLAB to achieve the desired objectives. The percentage of accuracy rate and error rate are used as the measurement parameters for analysis by using different classification techniques. The high value of accuracy and low value of error rate shows that the dataset is highly correctly classified.
The data is firstly divided into training data and testing data, where the training set is used to build the classifier and test set is used to validate it. In case of cross validation the data is divided manually and in case of split validation the data is automatically divided into the ratio of 80%-20%. In this study we use cross validation in which the percentage used for training and testing data are 66% and 34% respectively. Then, the classification techniques are applied using the 10 fold cross validation method to generate the classifiers via above mentioned data mining tools.
And at the end the result is recorded in terms of accuracy rate and error rate. The results are shown below:
A. Results for classification techniques applied on Heart Disease dataset
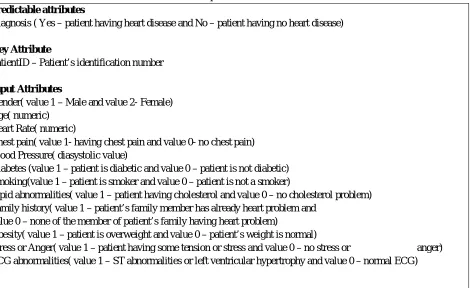
[image:5.612.88.558.385.673.2]Table III, IV and V show the results for classification techniques applied on Heart Disease dataset in Rapid Miner, WEKA and MATLAB respectively. On the basis of comparison done over accuracy and error rates; the classification techniques with highest accuracy are obtained for Heart Disease dataset in given different data mining tools. Table II shows the attributes that are considered for the prediction of disease.
Table ii
attributes used for the prediction of heart disease Predictable attributes
Diagnosis ( Yes – patient having heart disease and No – patient having no heart disease)
Key Attribute
PatientID – Patient’s identification number
Input Attributes
Gender( value 1 – Male and value 2- Female) Age( numeric)
Heart Rate( numeric)
Chest pain( value 1- having chest pain and value 0- no chest pain) Blood Pressure( diasystolic value)
Diabetes (value 1 – patient is diabetic and value 0 – patient is not diabetic) Smoking(value 1 – patient is smoker and value 0 – patient is not a smoker)
Lipid abnormalities( value 1 – patient having cholesterol and value 0 – no cholesterol problem) Family history( value 1 – patient’s family member has already heart problem and
value 0 – none of the member of patient’s family having heart problem)
Obesity( value 1 – patient is overweight and value 0 – patient’s weight is normal)
Stress or Anger( value 1 – patient having some tension or stress and value 0 – no stress or anger) ECG abnormalities( value 1 – ST abnormalities or left ventricular hypertrophy and value 0 – normal ECG)
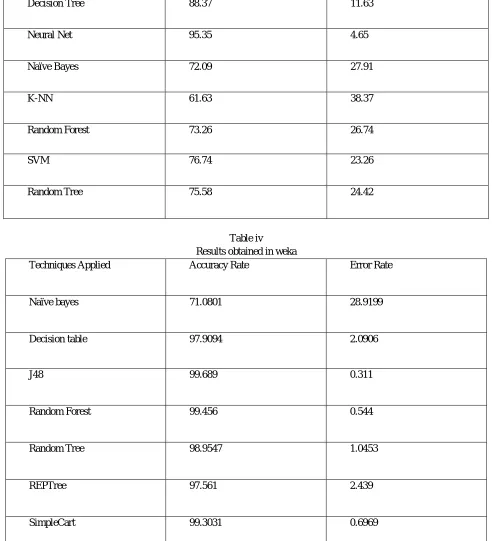
Results obtained in rapid miner
Techniques Applied Accuracy Rate Error Rate
Decision Tree 88.37 11.63
Neural Net 95.35 4.65
Naïve Bayes 72.09 27.91
K-NN 61.63 38.37
Random Forest 73.26 26.74
SVM 76.74 23.26
[image:6.612.60.552.148.689.2]Random Tree 75.58 24.42
Table iv
Results obtained in weka
Techniques Applied Accuracy Rate Error Rate
Naïve bayes 71.0801 28.9199
Decision table 97.9094 2.0906
J48 99.689 0.311
Random Forest 99.456 0.544
Random Tree 98.9547 1.0453
REPTree 97.561 2.439
Table v
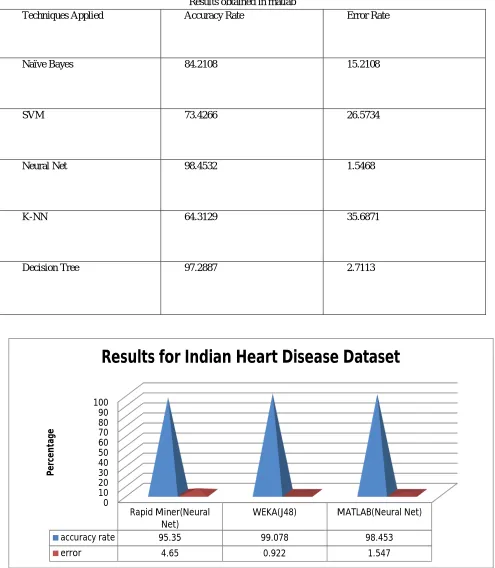
Results obtained in matlab
Techniques Applied Accuracy Rate Error Rate
Naïve Bayes 84.2108 15.2108
SVM 73.4266 26.5734
Neural Net 98.4532 1.5468
K-NN 64.3129 35.6871
Decision Tree 97.2887 2.7113
Figure V: Comparison between best classification techniques applied on Heart Disease Dataset
B. Results for classification techniques applied on Type II Diabetes dataset
Table VII,VIII and IX show the results for classification techniques applied on Type II Diabetes dataset in Rapid Miner, WEKA and
0 10 20 30 40 50 60 70 80 90 100
Rapid Miner(Neural Net)
WEKA(J48) MATLAB(Neural Net)
accuracy rate 95.35 99.078 98.453
error 4.65 0.922 1.547
P
e
rc
e
n
ta
ge
accuracy are obtained for this dataset in given different data mining tools. Table VI show the various attributes used prediction of Type II Diabetes. Figure VI shows comparison between the best classification techniques applied on this dataset. From figure VI it is observed that all the three best classification technique applied in given tools performed equally for this dataset.
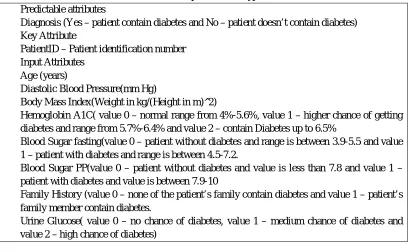
Table vi
Attributes used for the prediction of type ii diabetes Predictable attributes
Diagnosis (Yes – patient contain diabetes and No – patient doesn’t contain diabetes) Key Attribute
PatientID – Patient identification number Input Attributes
Age (years)
Diastolic Blood Pressure(mm Hg)
Body Mass Index(Weight in kg/(Height in m)^2)
Hemoglobin A1C( value 0 – normal range from 4%-5.6%, value 1 – higher chance of getting diabetes and range from 5.7%-6.4% and value 2 – contain Diabetes up to 6.5%
Blood Sugar fasting(value 0 – patient without diabetes and range is between 3.9-5.5 and value 1 – patient with diabetes and range is between 4.5-7.2.
Blood Sugar PP(value 0 – patient without diabetes and value is less than 7.8 and value 1 – patient with diabetes and value is between 7.9-10
Family History (value 0 – none of the patient’s family contain diabetes and value 1 – patient’s family member contain diabetes.
Urine Glucose( value 0 – no chance of diabetes, value 1 – medium chance of diabetes and value 2 – high chance of diabetes)
Table vii
Results obtained in rapidminer
Techniques Applied Accuracy Rate Error Rate
Decision tree 99.01 0.99
Neural Net 98.27 1.73
Naïve Bayes 97.04 2.96
K-NN 51.48 48.52
Random Forest 97.04 2.96
SVM 97.04 2.96
Random Tree 84.62 15.38
Table viii results obtained in weka
Techniques applied Accuracy rate Error rate
Naïve bayes 95.03 4.97
Decision table 97.45 2.55
J48 99.13 0.87
Random Forest 96.45 3.55
Random Tree 97.76 2.24
REPTree 96.34 3.44
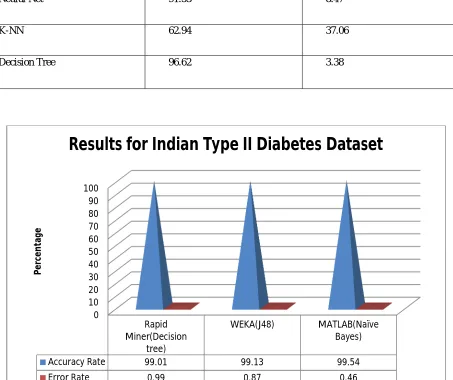
Table ix
Results obtained in matlab
Techniques Applied Accuracy Rate Error Rate
Naïve bayes 99.54 0.46
SVM 95.67 4.33
Neural Net 91.53 8.47
K-NN 62.94 37.06
Decision Tree 96.62 3.38
Figure VI. Comparison between best classification techniques applied for Type II Diabetes Dataset
IV. CONCLUSION
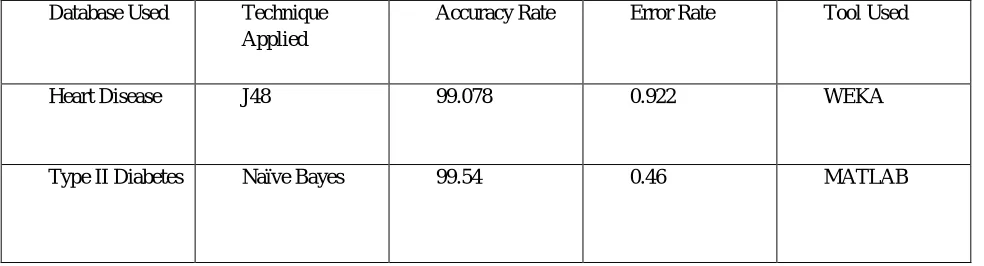
In this paper, we have discussed that how different types of data mining techniques are used for the prediction and diagnosis of lifestyle diseases and also studied that how these techniques have performed better results when applied on different datasets. The classification technique which show highest accuracy rate and low error rate is best among the rest of the techniques. Each technique is unique in its own way, which might be suitable for different applications. Table 10 shows the summary of results in terms of the best classification technique’s accuracy and error rate on the given datasets.
0 10 20 30 40 50 60 70 80 90 100 Rapid Miner(Decision tree) WEKA(J48) MATLAB(Naïve Bayes)
Accuracy Rate 99.01 99.13 99.54
Error Rate 0.99 0.87 0.46
P e rc e n ta ge
[image:9.612.89.542.204.584.2]Results showing the best classification techniques over given datasets Database Used Technique
Applied
Accuracy Rate Error Rate Tool Used
Heart Disease J48 99.078 0.922 WEKA
Type II Diabetes Naïve Bayes 99.54 0.46 MATLAB
From the results obtained after applying different classification techniques on given datasets Naïve Bayes showed the most promising results for Type II Diabetes dataset with 99.54% whereas J48 showed best results for Heart Disease dataset with 99.078%.
By knowing the best classification technique over a dataset a set of rules can be generated for that particular dataset and these rules will complement the healthcare researchers’ study for intelligent decision making. At last for future work it is suggested that more experiments can also be done on more lifestyle diseases by using different data mining techniques using different parameters.
REFERENCES
[1] Han, j. and M. Kamber,” Data Mining Concepts and Technique” ,. 2006: Morgan Kaufmann Publishers.
[2] Shelly Gupta,Dharminder Kumar and Anand Sharma, “Performance analysis of various data mining classification techniques on Healthcare Data”, International Journal of Computer Science & Information Technology (IJCSIT) Vol 3, No 4, August 2011
[3] Wikipedia, lifestyle diseases and its factors., Available: http://www.medicinenet.com/script/main/art.asp?articlekey=38316
[4] Syed Immamul Ansarullah, Pradeep Kumar Sharma, Abdul Wahid, Mudasir M Kirmani, “ Heart Disease Prediction System using Data Mining Techniques: A study”, International Research Journal of Engineering and Technology (IRJET) e-ISSN: 2395 -0056 Volume: 03 Issue: 08 | Aug-2016 www.irjet.net p-ISSN: 2395-0072
[5] S. Kiruthika Devi ,S. Krishnapriya and Dristipona Kalita, “Prediction of Heart Disease using Data Mining Techniques” , Indian Journal of Science and Technology, Vol 9(39), DOI: 10.17485/ijst/2016/v9i39/102078, October 2016
[image:10.612.63.555.103.236.2]