www.impactjournals.com/oncotarget/ Oncotarget, Vol. 6, No. 40
Genomic landscape of liposarcoma
Deepika Kanojia1, Yasunobu Nagata2, Manoj Garg1, Dhong Hyun Lee3, Aiko Sato2, Kenichi Yoshida2, Yusuke Sato2, Masashi Sanada2,4, Anand Mayakonda1, Christoph Bartenhagen5, Hans-Ulrich Klein5, Ngan B. Doan6, Jonathan W. Said6, S. Mohith1, Swetha Gunasekar1, Yuichi Shiraishi7, Kenichi Chiba7, Hiroko Tanaka8, Satoru Miyano7,8, Ola Myklebost9,10, Henry Yang1, Martin Dugas5, Leonardo A. Meza-Zepeda9, Allan W. Silberman11, Charles Forscher3, Jeffrey W. Tyner12, Seishi Ogawa2,* and H. Phillip Koeffler1,3,13,*
1 Cancer Science Institute of Singapore, National University of Singapore, Singapore
2 Department of Pathology and Tumor Biology, Graduate School of Medicine, Kyoto University, Kyoto, Japan
3 Division of Hematology/Oncology, Cedars-Sinai Medical Center, University of California, School of Medicine, Los Angeles,
California, USA
4 Department of Advanced Diagnosis, Clinical Research Center, Nagoya Medical Center, Nagoya, Japan 5 Institute of Medical Informatics, University of Münster, Münster, Germany
6 Department of Pathology and Laboratory Medicine, Santa Monica-University of California-Los Angeles Medical Center, Los
Angeles, California, USA
7 Laboratory of DNA Information Analysis, Human Genome Center, Institute of Medical Science, The University of Tokyo,
Tokyo, Japan
8 Laboratory of Sequence Analysis, Human Genome Center, Institute of Medical Science, The University of Tokyo, Tokyo,
Japan
9 Norwegian Cancer Genomics Consortium and Department of Tumor Biology, Institute of Cancer Research, Oslo University
Hospital, The Norwegian Radium Hospital, Oslo, Norway
10 Department of Molecular Bioscience, University of Oslo, Oslo, Norway
11 Department of Surgery, Cedars Sinai Medical Center, Division of Surgical Oncology, Los Angeles, California, USA 12 Knight Cancer Institute, Cell and Developmental Biology, Oregon Health and Science University, Portland, Oregon, USA 13 National University Cancer Institute, National University Hospital, Singapore
* These authors jointly directed this work
Correspondence to: Deepika Kanojia, email: csidk@nus.edu.sg
Keywords: liposarcoma, exome sequencing, SNP array, intra-tumor heterogeneity, therapeutics Received: September 07, 2015 Accepted: November 26, 2015 Published: December 04, 2015
ABSTRACT
Liposarcoma (LPS) is the most common type of soft tissue sarcoma accounting for 20% of all adult sarcomas. Due to absence of clinically effective treatment options in inoperable situations and resistance to chemotherapeutics, a critical need exists to identify novel therapeutic targets. We analyzed LPS genomic landscape using SNP arrays, whole exome sequencing and targeted exome sequencing to uncover
the genomic information for development of specific anti-cancer targets. SNP array analysis indicated known amplified genes (MDM2, CDK4, HMGA2) and important
novel genes (UAP1, MIR557, LAMA4, CPM, IGF2, ERBB3, IGF1R). Carboxypeptidase
M (CPM), recurrently amplified gene in well-differentiated/de-differentiated LPS was
noted as a putative oncogene involved in the EGFR pathway. Notable deletions were found at chromosome 1p (RUNX3, ARID1A), chromosome 11q (ATM, CHEK1) and
chromosome 13q14.2 (MIR15A, MIR16-1). Significantly and recurrently mutated
genes (false discovery rate < 0.05) included PLEC (27%), MXRA5 (21%), FAT3 (24%), NF1 (20%), MDC1 (10%), TP53 (7%) and CHEK2 (6%). Further, in vitro
INTRODUCTION
Liposarcoma (LPS) is a rare cancer with a high recurrence rate and low response to existing therapies [1]. To date, surgery is the only therapeutic strategy for treating aggressive LPS, but most of these tumors recur and metastasize associated with a high mortality [2]. LPSs
are classified according to World Health Organization into five types [3], 1) Atypical lipomatous tumors (ALT)/Well-differentiated LPS (WDLPS); 2) De-(ALT)/Well-differentiated LPS (DDLPS); 3) Myxoid LPS (MLPS); 4) Pleomorphic LPS (PLPS) and 5) Mixed-type LPS. Among these, WDLPS and DDLPS are the most frequent types occurring in 40-50% of all LPS cases and are characterized by the presence of supernumerary ring and/or giant marker chromosomes [4]. The other common type, MLPS is characterized by the recurrent translocation t(12;16)(q13;p11) that results in the FUS-CHOP gene fusion present in over 95% of MLPS
cases [5]. PLPS is a rare variety with limited molecular studies.
Studies characterizing the genetic alterations in
LPS have focused on analysis of copy number, mRNA expression and DNA sequences of limited number
of candidate genes. Several groups have discovered
amplification on chromosome 12q in the majority of WDLPS and DDLPS patients including HMGA2, CDK4 and MDM2 oncogenes [6, 7]. A DNA sequencing study identified frequent mutations of TP53 and RB1 in PLPS, NF1 in PLPS and PIK3CA and KIT in MLPS patients [7]. In addition, next generation sequencing approach revealed
structural complexities in primary and locally recurrent
DDLPS samples and discovered recurrent mutations of
HDAC1, MAPKAP1, PTPN9 and DAZAP2 [8]. Despite
these previous reported genetic studies in LPS, no single drug against any genomic target in this disease is yet
approved; necessitating the drive to find and validate
clinically relevant therapeutic targets in this disease. Since
LPS remains relatively underserved by large sequencing groups, we pursued to define the genomic landscape using SNP Chip and next generation sequencing to identify the
full spectrum of driver mutant genes and altered pathways in different types of LPS.
Here, we report a variety of genomic aberrations
including mutations, and copy number changes in
different types of LPS using SNP-CHIP array, whole exome sequencing (WES), and targeted exome sequencing
(TES). The present study defines the genetic landscape
of LPS highlighting a potentially druggable alteration of Carboxypeptidase M (CPM) gene. Integrative exome
sequencing, SNP analysis and biological studies revealed
tumor suppressor role of Neurofibromin 1 (NF1) in LPS.
Pathway analysis of frequently altered genes indicated
involvement of various important pathways such as
signalling through MAPK and Erb in LPS leading to identification of genes that can be potentially targeted using currently available drugs. Comprehensive genomic
characterization efforts to catalog altered genes and pathways will improve our understanding of the molecular genetics of LPS for better management of the disease.
RESULTS
We analyzed LPS samples of different types through a combination of next generation sequencing approach including SNP arrays of 86 patients and 13 cell lines, WES of 12 patients, and TES of 86 patients and 13 cell lines
(Supplementary Table S1).
Copy number analysis of LPS samples
SNP array analysis of 86 LPS patient samples revealed chromosomal regions most frequently aberrant as shown in the heat map (Figure 1A) grouped according to subtypes. Among the recurrent copy number amplifications, we found previously reported classical amplicon at chromosome 12q13-15 involving important well-known oncogenes such as [HMGA2 [9], CDK4 [7],
MDM2 [7] and miR-26-a2 [10] in WDLPS and DDLPS patient samples. In addition, GISTIC analysis indicated statistically significant, frequently observed broad and focal amplifications at chromosomes 1q, 6q, 8q, 11p, 12q, 14q and 15q (Figure 1B). Interestingly, we observed
important but previously not reported genes: UAP1, MIR557, LAMA4, GRM1, IGF2, CPM, IGF1R, ERBB3, STAT6, and MIR492 in the amplified regions. Significant deletions were observed at chromosomes 1p, 3p, 6p, 11q, 13q, 15q and 17p (Figure 1B) indicating important novel
aberrated genes: RUNX3, CDKN2C, ARIDIA, BCAR3, CDKN1C, CCND1, MIR15-A, MIR16-1, TP53BP1. All the significantly altered regions and genes within the regions identified in LPS samples using GISTIC analysis are listed
in Supplementary Table S2.
for Neurofibromin 1 (NF1) gene in different subtypes of LPS. Pathway analysis of
recurrent mutations demonstrated signaling through MAPK, JAK-STAT, Wnt, ErbB, axon guidance, apoptosis, DNA damage repair and cell cycle pathways were involved in liposarcomagenesis. Interestingly, we also found mutational and copy number heterogeneity within a primary LPS tumor signifying the importance of multi-region
sequencing for cancer-genome guided therapy. In summary, these findings provide
Of note, SNP array of 13 LPS cell lines (included
all the histological types of LPS) displayed comparatively more copy number aberrations than the patient samples
as seen in the heat map (Figure 1C). Heat map showed that unlike the other cell lines, SW872 did not have the common copy number alterations (CNAs) (gain at
chromosomes 1, 2, 12 and loss at chromosomes 11, and
13). MLS402 cells had fewer CNAs compared to other LPS cell lines, thus more resembling the profiling pattern of the LPS patient samples. GISTIC analysis indicated important and significantly recurrent broad amplifications and deletions in LPS cell lines including amplification
at chromosomes 1p (JUN, MIR214, MIR1992A),
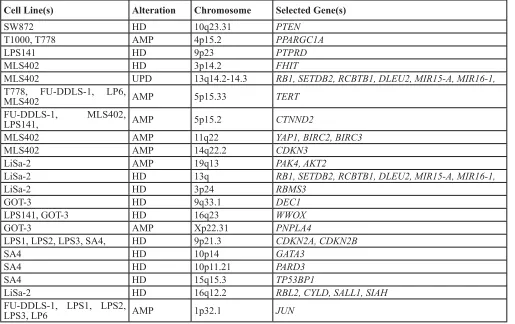
5p15.33 (TERT), 10p13, 12q13-15, and 20q12 (Figure 1D). Important and novel deletions were identified at chromosomes 3p14.2 (FHIT), 8p23.3 (MIR596, ARHGEF10, FBXO25), and 16q12.2 (CYLD, RBL2, SALL1) (Figure 1D). List of regions and genes observed in GISTIC analysis is provided in Supplementary Table S3. The focal amplifications and deletions noted in the
[image:3.612.58.573.62.386.2]cell lines provide a suitable platform for biological studies (Table 1).
Frequent amplification of CPM gene in WDLPS/ DDLPS
In addition to the above mentioned recurrent copy
number aberrations, we detected gain/amplification of
the CPM gene at chromosome 12q15 in 78% (39/50) of WDLPS/DDLPS patient samples (Figure 2A) which was validated using genomic quantitative PCR (Supplementary Fig. S1A). CPM protein levels were significantly higher in WDLPS/DDLPS samples as shown by positive
immunohistochemical staining, whereas the protein was not detectable in benign lipoma and normal fat tissue
(Figure 2B and Supplementary Fig. S1B). In addition,
CPM was amplified in T1000, T778, LPS141, FU-DDLS-1, SA-4, LPS1, LPS2 and LPS3 cells. Western blotting revealed high CPM expression in all CPM amplified cell lines compared with the non-amplified SW872 cells (Supplementary Fig. S1C). Flow cytometry showed CPM surface expression on these CPM amplified
cell lines suggesting this enzyme may be an attractive
therapeutic target (Supplementary Fig. S1D).
Functional role of CPM was characterized in
LPS141 and FU-DDLS-1 cells (CPM amplification) compared to SW872 cells (without CPM amplification).
CPM knockdown using siRNA1 and siRNA2 versus
Table 1: Important and selected copy number alterations in LPS cell lines relevant to transformation
Cell Line(s) Alteration Chromosome Selected Gene(s)
SW872 HD 10q23.31 PTEN
T1000, T778 AMP 4p15.2 PPARGC1A
LPS141 HD 9p23 PTPRD
MLS402 HD 3p14.2 FHIT
MLS402 UPD 13q14.2-14.3 RB1, SETDB2, RCBTB1, DLEU2, MIR15-A, MIR16-1,
T778, FU-DDLS-1, LP6,
MLS402 AMP 5p15.33 TERT
FU-DDLS-1, MLS402,
LPS141, AMP 5p15.2 CTNND2
MLS402 AMP 11q22 YAP1, BIRC2, BIRC3
MLS402 AMP 14q22.2 CDKN3
LiSa-2 AMP 19q13 PAK4, AKT2
LiSa-2 HD 13q RB1, SETDB2, RCBTB1, DLEU2, MIR15-A, MIR16-1,
LiSa-2 HD 3p24 RBMS3
GOT-3 HD 9q33.1 DEC1
LPS141, GOT-3 HD 16q23 WWOX
GOT-3 AMP Xp22.31 PNPLA4
LPS1, LPS2, LPS3, SA4, HD 9p21.3 CDKN2A, CDKN2B
SA4 HD 10p14 GATA3
SA4 HD 10p11.21 PARD3
SA4 HD 15q15.3 TP53BP1
LiSa-2 HD 16q12.2 RBL2, CYLD, SALL1, SIAH
FU-DDLS-1, LPS1, LPS2,
LPS3, LP6 AMP 1p32.1 JUN
scramble siRNA inhibited cell proliferation of LPS141 and FU-DDLS-1, but not in SW872 (Supplementary Figs. S2A and S2B). To analyze long-term effects of
CPM knockdown, lentivirus containing CPM shRNA was stably infected into these cells (Figure 2C) resulting in significant reduction in cell growth (Figure 2D), colony
formation, migration and invasion (Supplementary Figs.
S2C-E) in LPS141 and FU-DDLS-1 (not in SW872). Also LPS141 and FU-DDLS-1 CPM shRNA expressing cells had significantly increased apoptosis compared to SW872 cells (Figure 2E and Supplementary Fig. S2F). In addition, a significant decreased in vivo tumor growth of CPM knockdown LPS141 cells was observed compared to wild type LPS141 cells in NSG mice (Figure 2F). One
important function of CPM is enzymatic cleavage of the
C-terminal arginine of epidermal growth factor (EGF) in
tissues suggesting CPM may be involved in activation of EGF/EGFR signalling [11]. We found that CPM
knockdown decreased expression levels of phosphorylated
EGFR, Akt, and ERK in LPS141 and FU-DDLS-1 cells but not in SW872 cells (Figure 2G). Levels of p21 protein
increased upon CPM knockdown in LPS141 and FU-DDLS-1 cells compared to non-target shRNA (Nt-shRNA) control cells. Taken together, high levels of CPM in LPS
cells stimulate the transformed features of LPS.
Discovery of somatic mutations through WES
WES was performed on 12 LPS human samples
of different types and their matched normal tissues as a
Discovery Set. Average coverage was 185-fold and 80% of bases were covered efficiently for variant calls (≥20X coverage) (Supplementary Table S4, Supplementary Fig. S3). A total 377 potential somatic changes were identified and Sanger sequencing validated 91% of events (Figure 3A, Supplementary Table S5). Clinical characteristics of
[image:4.612.61.553.290.663.2]the patients along with some of the important mutated genes (BRCA1, MXRA5, NF1, CDK11A and CDK1) and
Figure 1: Copy number alterations (CNAs) in LPS samples and cell lines. Heat map of the CNAs of A. 86 LPS patient samples and C. 13 LPS cell lines grouped by various histotypes. Red and blue represents copy gain and loss, respectively in units of log2 (cancer/ normal). GISTIC analysis demonstrating significant genomic amplifications (red) and deletions (blue) in the B. LPS patient samples and D.
copy number changes (CPM, JUN, PIK3CA, CDKN2A, CDK4, HMGA2, MDM2, NF1) are shown in Figure 3B. Cancers often have variable mutational spectra pointing to particular mutagenic stimuli [12]. Only mutational signature 1 (Figure 3C) was observed in the Discovery cohort in which majority of changes were C > T transitions and C > A transversions representing involvement of an
endogenous mutational process due to deamination of
5-methyl-cytosine [12].
Landscape of LPS mutations
[image:5.612.64.550.236.573.2]Prevalence Set of an additional 86 LPS patient samples (Supplementary Table S1) and 13 cell lines were examined by TES. 248 genes (somatically mutated in the Discovery Set and well-known cancer-related genes) were evaluated (Supplementary Table S5). Average coverage was 121-fold, and 79% of bases were covered efficiently for variant calls (≥ 20X coverage) (Supplementary Table S6). After removing mapping errors and known SNPs, a total of 995 non-synonymous mutations including insertions/deletions were identified (Supplementary Fig. S4A, Supplementary Table S7) in patient samples.
Mutational Significance in Cancer (MuSiC) tool was used to identify significantly altered genes; important mutated
genes included MXRA5, PLEC, NF1, FAT3, TP53, MDC1, CHEK2 and MDC1 which were significantly enriched for mutations (q value < 0.05) (Supplementary Table S8). Recurrent mutations in previously unidentified genes
were found in LPS samples associated with cell adhesion
and cytoskeleton organization [51 of 86 (60%) patients]
including mutant PLEC, FAT3, MXRA5, APC, LLGL1, and PTPRD (Figure 3D, Supplementary Fig. S4B). Altered genes in DNA replication, DNA damage checkpoint and repair pathways were detected in 65% of cases. Genetic alterations in the cell cycle pathway were found in G1/S transition control due to amplifications of CDK4 and MDM2 in 70% of samples, including those important
mutations or deletions of RB1, CDKN2A, CHEK2, TP53 and ATM genes. Mutations of genes critical for various tyrosine kinase pathways were also identified in 36% of samples (Figure 3D).
Interestingly, a class of genes involved in axon guidance pathway (ROBO1, SEMA3G and SEMA3A) were
mutated in patient samples (Figure 3D). ROBO1 was also
mutated in 4 LPS cell lines [LPS1, LPS3, LP6 and T1000] (Supplementary Table S7). Genomic aberrations in these genes in LPS have not been reported. Using TES and copy number analysis, we identified NF1 mutations (including
5 frameshift insertions) in 17 patient samples and loss of
heterozygosity in 5 LPS patient samples (Supplementary
Figs. S5A-B). NF1 silencing using shRNA (Figure 4A) significantly increased cell proliferation (Figure 4B) and colony formation (Figure 4C) in LPS141 and MLS402
cells. In vivo stable NF1 knockdown resulted in increased
human LPS growth in a NSG xenograft model (Figure
4D) suggesting a tumor suppressor role of this gene that is frequently aberrant in different types of LPS.
Screening of LPS cell lines with targeted capture baits revealed various important gene mutations (TP53, ROBO1, FAT3, CDKN2A, MXRA5, PLEC and BRAF)
(Supplementary Table S7). SA-4 and SW872 had the
most common BRAF oncogenic mutation (V600E)
and also two LPS patient samples had BRAF missense
mutations (Figure 5A and Supplementary Fig. S5C). In further studies, SA4 (BRAF V600E), SW872 (BRAF V600E) and LP6 (BRAF Wild-type) cells were cultured in the presence of a small molecule BRAF V600 mutant inhibitor vemurafenib. Only the BRAF mutant cells
were sensitive to the growth inhibitory effects of the
[image:8.612.62.549.387.660.2]vemurafenib compared to the BRAF wild-type cells as measured by cell growth in liquid culture (Figure 5B) and clonogenic assay (Figures 5C and 5D).
Pathways in liposarcoma
We performed pathway analyses of recurrently
mutated genes of LPS samples using PathScan algorithm for improved and better understanding of potential mechanism of liposarcomagenesis (Supplementary Table
S9). Pathways potentially involved in the disease include signaling through MAPK (P = 1.78 X 10‐14), ErbB (P =
3.1 X10‐11), JAK-STAT (P = 2.5 X 10‐11), and Wnt (P = 4.1 X 10‐7) as well as apoptosis (P = 3.6 X10‐13), cell cycle
(P = 0.0004), DNA replication (P = 0.009) and repair (P =
0.0003), and axon guidance pathway (P = 0.0002).
Somatic intra-tumoral genetic heterogeneity analysis
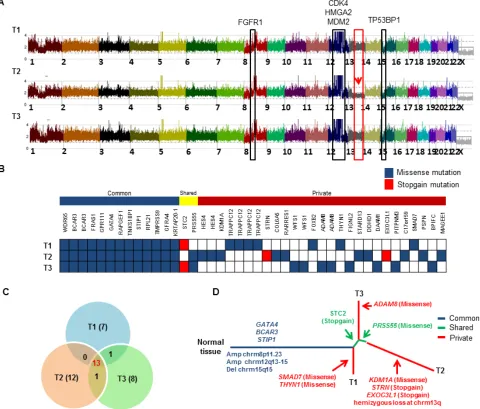
WES and SNP arrays were performed on three different regions (T1, T2, and T3) of the patient’s large DDLPS tumor along with germline normal control (N). Average coverage of WES data was 155-fold and 83% of bases were covered for variant calling ( > 20X coverage). SNP array identified frequent shared copy number events
[image:9.612.66.546.242.651.2]in all three tumor regions including FGFR1 amplification at chromosome 8p11.23 and classical CDK4, HMGA2 and MDM2 amplification at chromosome 12q13-15 region and deletion of TP53BP1 at chromosome 15q15 (Figure 6A). However, region T2 exclusively contained
Figure 6: Landscape of intra-tumor heterogeneity. A. CNAG copy number plot of three different tumor regions (T1, T2 and T3) of the same LPS tumor. Copy number gain and loss of several genes are highlighted. Red arrow indicates the hemizygous loss of chromosome 13q only in region T2. B. Distribution of somatic mutations found by WES. Each row indicates the tumor region, and each column represents validated somatic mutations. Mutations are grouped as “common” to all 3 tumors, “shared” are common mutations shared by only 2 of the 3 regions, and “private” found only in single tumor region. C. Venn diagram shows distribution of mutations across all three tumor regions.
hemizygous loss at chromosome 13q including important
genes [RB1, CCNA1, CDC16, SETDB2, SOX1, MIR15A and MIR16-1]. We identified 42 somatic mutations in total that were validated by Sanger sequencing and mapped according to their tumor regions (Figure 6B). These mutations were categorized into 13 common mutations, 2 shared mutations (present in 2 of the 3 regions), and 27 private mutations (specifically present in a single region). Ongoing regional clonal evolution was indicated by the presence of unique mutations in each region: T1 (7), T2 (12) and T3 (8) (Figure 6C). A phylogenetic tree
of different tumor regions by clonal ordering shows
branching tumor evolution (Figure 6D). Only 31% (13 out of 42) of the total mutations were detected in all three regions of this single tumor highlighting the inadequacy of
mutational interrogation at only a single tumor site.
DISCUSSION
LPS, although rare, is one of the most common soft tissue sarcomas with substantial morbidity and mortality. Previous studies have characterized genetic aberrations in LPS tumors identifying recurrent mutations of TP53, PIK3CA, RB1, and PTEN [7]. As a compliment to prior
studies, we examined all histologic types of LPS by deep
nucleotide sequencing and CNA analyses and focused on
several aberrant genes.
CPM gene is present in one of the multiple-peaks of amplification on chromosome 12q. It belongs to
the carboxypeptidases family and is a GPI anchored
membrane-bound enzyme [13]. It specifically removes C-terminal basic residues (Arg or Lys) from peptides
and proteins, and plays a role in the control of peptide hormone and growth factor activity at the cell surface
[14]. Recent reports have suggested that CPM can be a
potential cancer biomarker to discriminate WDLPS from
lipomas [15] when coexpressed with EGFR with poor
prognosis in adenocarcinoma of lung [16]. Assessment of
copy number of both MDM2 and CPM has been proposed
as a complementary tool for better classification of LPS tumors [17]. We showed that CPM could modulate EGFR signaling, and silencing of CPM decreased tyrosine kinase activity of EGFR. These observations suggest that lowering the enzymatic activity of CPM may have a therapeutic effect in patients with CPM amplification. We also noted that deletion at chromosome 13q14.2 occurred in approximately 16 out of 86 (19%) of LPS samples and cell lines. This deletion very frequently occurs in chronic lymphoid leukemia (CLL) [18], mantle cell lymphomas [19], multiple myeloma [20] and prostate cancers [21].
This region contains important tumor suppressors RB1, MIR15A and MIR16-1. Studies in CLL have shown BCL2 as the target of miR15/16 [22] and that ABT-199 (Bcl2 inhibitor) is effective against these Bcl-2 elevated lymphoid malignancies [23]. Future studies need to measure levels of the anti-apoptotic proteins (Bcl-2)
and determine if ABT-199 or similar drugs are effective
in treatment of patients with LPS having a deletion of
chromosome 13q14.2.
In the field of cancer genomics, differentiation
between somatic drivers of tumorigenesis versus
passenger mutations is difficult. Mutation significance algorithm MUSIC [24] was used to identify genes
(MXRA5, PLEC, NF1, FAT3 and MDC1) showing positive
selection for mutation. This algorithm identifies genes that
were mutated more often than expected by chance given
the background mutation processes [24].
We identified recurrent mutations in previously unidentified genes in LPS, associated with cell adhesion, pathways involved in cytoskeleton organization, base
excision repair, homologous recombination repair,
nucleotide excision repair, as well as DNA replication process. Alteration of DNA damage repair genes can
foster initiation of cancer by preventing senescence and apoptosis, and promoting cellular proliferation even in the
presence of accumulation of DNA damage [25]. Another
class of mutations includes semaphorins, slits, netrins and ephrins and these genes have important regulatory roles in axon guidance and in cancer cell growth, survival, invasion and angiogenesis (22). This pathway has been recently also found to be aberrated in pancreatic cancer
[26]. Mutant genes of this class in LPS include ROBO1, SEMA3G and SEMA3A. Our study strongly suggest
that dysregulation of axon guidance pathway may be
associated with liposarcomagenesis which requires further
investigation.
NF1 gene encodes Neurofibromin which has significant homology to GTPase-activating proteins (GAPs) [27]. NF1 negatively regulates the RAS proto-oncogene by catalyzing hydrolysis of RAS-GTP; the
latter is important for cell proliferation, differentiation and
migration [28]. Mutations of the NF1 gene in other types of cancer are associated with a highly aggressive often
fatal outcome [29]. We found that NF1 gene was among the most recurrently aberrant gene in our LPS samples
(20%); these included missense mutations, frameshift insertions and loss of heterozygosity. An earlier DNA sequencing study reported NF1 mutations only in PLPS
type [7] but in our cohort mutations occurred irrespective
of subtype. In further studies, we provided evidence for a potential tumor suppressor role of NF1in vitro and in vivo.
Mutational activation of BRAF gene is already
known to occur in melanoma, glioblastoma, thyroid, lung, colon and hematological malignancies [30]. We identified an oncogenic BRAF (V600E) mutation in 2 LPS cell lines [SW872 [30] and SA4] and noted unique BRAF
mutations in 2 LPS fresh samples. BRAF mutant (V600E)
melanoma and thyroid cancers are sensitive, but colon
cancers are resistant to therapy with vemurafenib (FDA approved drug) [31]. LPS can now be added to the list of vemurafenib-sensitive tumors. LPS cells carrying BRAF
tyrosine kinase inhibitor while cells without the mutation
were resistant to the drug.
This study for the first time reported multi-region WES and SNP Chip analysis of a LPS patient’s tumor. Intra-tumor mutational and copy number heterogeneity was found including intra-tumor diversity at chromosome 13q and 51% somatic mutations defined as unique to
one of the three regions of the tumor. This heterogeneity suggests that determining therapy of LPS (personalized medicine) based on a single tumor biopsy may not provide
a complete mutational landscape and multi-regional tumor
biopsies may be needed to assess the genomic complexity and its clinical impact on the patient.
Many of the genetic alterations that we identified will alter important signaling pathways (e.g., MAPK, ErbB, p53, DNA repair and replication, cell cycle and axon guidance) (Supplementary Table S9). Genes which
are therapeutic targets include MDM2, CDK4, NF1, BRCA1, EGFR, PI3K, AKT1, KIT, BRAF, ERBB2 and ERBB3. Also, several important unexplored targets were identified. This work represents a global genomic analysis
of LPS cohort and provides insights into the development of novel therapeutic strategies based on molecular phenotype of the tumor.
MATERIALS AND METHODS
Patients’ samples and cell lines
Primary human LPS tumor tissues and matched normal fat tissues of different histotypes were collected by collaborating with different hospitals [National University
Hospital Tissue Repository (Singapore), University of California (Los Angeles, CA, USA), Tumor Repository at Yale University School of Medicine (New Haven, CT, USA), City of Hope Hospital (Duarte, CA, USA) and Oslo University Hospital Sarcoma Biobank (Oslo, Norway)]. Detailed clinical characteristics of all patients are provided
in the Supplemental Table S1. Patients used for integrated
genomic analyses: SNP array (86 tumors), Discovery cohort (12 tumor-normal pairs) for WES, and Prevalence cohort (14 tumor-normal pairs and 72 tumors) for TES.
Thirteen human LPS cell lines were used in the
present study: SW872 (undifferentiated LPS) was purchased from American Tissue Type Culture Collection (ATCC, Rockville, MD, USA); LP6 cells were provided by Dr Christopher DM Fletcher; SA-4 (liposarcoma) cell was a kind gift from Ola Myklebost; LiSa-2 (metastatic poorly differentiated liposarcoma) [32] was kindly provided by Dr. Moller; FU-DDLS-1 [33] and LPS141 [34] (DDLPS) were gifts from Dr. Nishio and Dr. Fletcher, respectively. GOT-3 (recurrence of a myxoid variant of a WDLPS) [35] and MLS-402 (MLPS) [36] were generous gifts from Dr. Åman. T778 and T1000 (recurrent WDLPS)
were kind gifts from Dr. Pedeutour. LPS1, LPS2, LPS3 (DDLPS) cell lines were provided by Dr Hong Wu [37]. All these LPS cell lines were maintained in RPMI medium supplemented with fetal bovine serum in a humidified incubator at 370C with 5% CO
2 [38].
Genomic DNA and RNA extraction
Genomic DNA (gDNA) was extracted from tumor tissues and cell lines using a QIAamp DNA Blood Mini Kit (Qiagen) according to manufacturer’s instructions. The Qubit dsDNA BR Assay Kit (Life technologies) was used to quantify the concentration of gDNA and also 0.7% agarose gel was run for quality of each gDNA sample. Total RNA was isolated using RNeasy Mini Kit (Qiagen) following kit’s instructions and quality and concentration of RNA was checked on Bioanalyzer 2100 (version A.02 S1292, Agilent Technologies).
SNP array analysis
SNP array analysis was performed using GeneChip human mapping SNP array (Affymetrix, Santa Clara, CA, USA). gDNA from 86 LPS tumor samples and 13 cell lines were hybridized to Affymetrix 250K Nsp SNP array and CytoScan SNP array according to instructions provided by array manufacturers [39]. GeneChip Fluidics Station 400 and GeneChip scanner 3000 were used to
produce raw data, which were processed and analyzed by
copy number analyzer for Affymetrix GeneChip (CNAG 3.0) using copy number analysis as described previously [40, 41]. Significantly recurrent copy number changes were identified using the GISTIC2.0 algorithm [42].
WES and TES sequencing
For WES, gDNA libraries were prepared using
the SureSelect® Human All Exon 50M Kit V4 (Agilent Technologies) as described previously [43]. Captured DNA libraries were subjected to high through-put sequencing using Hiseq2000 Illumina platform with 75 to 100 bp paired-end reads. TES included 248 genes in the customized target enrichment kit and targeted gene
libraries were prepared with SureSelectXT2 Target
Enrichment System for Illumina Multiplexed Sequencing (Agilent Technologies) according to manufacturer’s protocols. Captured libraries were subjected to massively parallel sequencing using HiSeq2000 platform (Illumina).
Next-generation sequencing data processing and mutation calling
Somatic mutations and short insertions and deletions
pipeline as described previously [43-46]. Massively parallel sequencing reads were first aligned to hg19 using Burrows-Wheeler Aligner (V 0.5.8) with default parameters. Low quality reads were filtered, including more than 5 mismatches to the reference sequences or whose mapping quality was less than 30 for summarizing base call data. The significance of each candidate single nucleotide variant (SNV) was evaluated by Fisher’s exact
test by enumerating the number of the reference bases and
the candidate SNV. Finally, a list of candidate somatic
mutations was generated by excluding synonymous
SNVs and other variants registered in dbSNP131, 1000 genomes, or our in-house SNP database constructed from 180 samples [43, 44]. All the somatic mutations were validated by Sanger sequencing. To detect probable somatic mutations of non- paired LPS patient samples (no germ line control DNA) and LPS cell lines, besides all
the above mentioned criteria applied, we further removed
copy number-neutral variants with allele frequency between 45% and 55% unless they were registered in the COSMIC data base.
Validation by sanger sequencing
All mutations and Indels found by next generation sequencing were validated with Sanger sequencing. PCR primers were designed for the putative variants using Primer3 and were used to amplify the source DNA
from the tumors and germline control. Products were
sequenced; and sequences were analyzed with Sequencing Analysis Software Version 5.2 (Applied Biosystems).
Analysis of significantly mutated genes and pathways
Validated list of SNVs and Indels across the cohort were used to identify significantly altered genes. We performed ‘Significantly Mutated Genes tests (SMG-test) from ‘Mutational Significance in Cancer’ (MuSiC) tool to identify such genes [24]. Each mutation is categorized into seven categories, AT transitions, AT transversions, CpG transitions, CpG transversions, CG transitions/ transversions and Indels. Final Background Mutation Rate (BMR) is estimated by dividing number of mutations
found in each category and total number of available
bases. A gene is identified as significantly mutated, if its mutation rate is significantly higher than the estimated BMR. The refseq annotated mutations (genes) were used
for pathway analysis. Pathway analysis was done using
PathScan algorithm integrated into MuSic pipeline [47].
Analysis of mutational signature
We used EMu, a probabilistic method which uses Expectation Maximization (EM) algorithm to identify Mutational Signatures. EMu also measures the tumor specific “opportunity” from CNAs to measure the “opportunity” for a given variant to occur in that region thus increasing the accuracy of inferred Signature. Along with the validated variants, we also used all high quality tier1 and tier2 variants from WES samples for Signature Analysis [48]. Before running Emu, mutation opportunity was calculated using CNAs in tumor. Briefly, read depths for every 100 base pair segments were estimated
for tumor and matched normal samples, and depth ratio
was calculated using VarScan2 copy number programme [49]. These segments were later delineated by Circular Binary Segmentation algorithm to detect potential copy number altered regions [50]. This segmented data was fed into Emu along with the mutations classified into 96
trinucleotide channels based on the bases immediate to the
5’ and 3’ of the mutated site.
RT-PCR and quantitative real-time PCR analysis
Total RNA was reverse transcribed to cDNA with RevertAid First Strand cDNA Synthesis Kit (Thermo Scientific). Quantitative gene expression levels were detected using KAPA-SYBR Green RT-PCR with the ABI PRISM 7500 Fast Sequence Detection System (Applied Biosystems). Expression levels of target genes were
normal ized to GAPDH mRNA levels. Primer sequences are provided in Supplementary Table 10.
Genomic quantitative PCR
gDNA of LPS patient samples was quantified and diluted at a concentration of 25 ng/ml. For reaction, 2X SYBR Green PCR master mix, forward and reverse primers specific for CPM were added and pipetted into
respective wells of a PCR plate. gDNA (1 ul) was added in each well and run in ABI PRISM 7500 Fast Sequence Detection System (Applied Biosystems) at following conditions; 50°C for 2 min, denaturation at 95°C for 10 min, followed by 40 cycles of denaturing at 95°C for 15 s and combined annealing and extension at 60°C for 60 s.
GAPDH specific primers were used as control.
Immunohistochemistry
Tissue microarray slides were purchased from
antigen retrieval was done with a retrieval buffer (pH 6). Slides were blocked and incubated with CPM antibody for 30 min followed by washing. Secondary
rabbit-horse radish peroxidase labelled antibody was added,
followed by washing and developed with DAB solution. Counterstaining was done with Mayers hematoxylin for
5 min and slides were mounted and was scanned using
the automated scanning system Aperio XT (Aperio
Technologies).
Flow cytometry
For surface staining, cells were harvested, washed
(single cell suspension) and resuspended (1-5 x 10⁶ cells/
ml) in ice cold FACS Buffer (PBS, 2% FBS). Cells were blocked for 20 min and incubated with CPM antibody (1:100 dilution) for 30 min on ice. After washing with ice-cold FACS buffer, cells were subjected to secondary labeled antibody (1:500 dilution), incubated for 30 min in the dark on ice, washed three times and analyzed on flow
cytometer.
For cell cycle analysis, cells were harvested, washed
with ice-cold PBS and fixed using ice-cold 70% ethanol. Propidium iodide/RNase solution was added to cells on ice and analyzed by flow cytometer. Apoptosis was detected by flow cytometry using the Annexin V-FITC Apoptosis Detection kit (BD Pharmingen) according to
the manufacturer’s instructions.
Cell proliferation assay
Cells were seeded (5000 cells/well) in 96-well plates and MTT (3-(4,
5-dimethylthiazol-2-yl)-2,5-diphenyl tetrazolium bromide) assay was performed at
24 h, 48 h, 72 h and 96 h according to standard protocol. Cells were incubated with MTT (0.5 mg/ml) for 2-4 h in a 37˚C CO2 incubator. Formazan crystals were dissolved in 100 ul of MTT stop solution (SDS-HCl). Absorbance was measured at 570 nm using a Tecan Infinite 200 PRO spectrophotometer (Mannedorf, Switzerland).
Colony formation assay
For anchorage-dependent colony assay, cells were seeded in 6-well plates (500 cells/well) and allowed to grow for 10-15 days to form colonies. Colonies were washed with PBS, fixed with methanol and stained with crystal violet. For anchorage-independent colony assays, cells were plated in 0.5% agarose on top of 1% agarose in 24-well plates. Cells were allowed to grow for 2-3 weeks to form colonies; and colonies were counted under an
inverted microscope.
Migration and invasion assay
Cells in serum-free medium were seeded in Transwell inserts (Corning) for migration assay and in Matrigel coated Transwell inserts for invasion assay in 24-well plates. Cells were incubated with serum containing medium in the lower chamber. After 24 h, inserts were washed and non-migrating/non-invading cells were removed and migrated/invaded cells were fixed with
methanol and stained with crystal violet.
Immunoblot analysis
Cell lysates were prepared using Protein Extraction reagent (Thermo Scientific) containing protease inhibitor cocktail and subjected to SDS-PAGE. Proteins were transferred to polyvinyidene difluoride membranes which
were further incubated with the indicated antibodies and
detection was performed using Chemiluminescent HRP Substrate (Thermo Scientific). List of antibodies used are
provided in Supplementary Table 11.
Xenograft assay
Male NOD SCID gamma mice (5-6 weeks old)
were used for xenograft assay in compliance with
ethical regulations of Institutional Animal Care and Use Committee of National University of Singapore. CPM
shRNA3 knockdown LPS141 cells and non-target shRNA LPS141 cells (2 x 10⁶ cells per mice) mixed with matrigel
were injected subcutaneously in the right and left flank of the mice, respectively. After 4-6 weeks of injection,
mice were eutha nized to weigh and analyze the dissected tumors.
RNA interference
Human CPM gene specific siRNA duplexes including control scramble siRNA duplexes were purchased from Integrated DNA Technologies (Coralville, USA). LPS141, FU-DDLS-1 and SW872 cells were transfected with 100nM siRNA duplex using Nucleofector Kit (Lonza, Cologne, Germany) according
to the manufacturer’s protocol. 2 ug of pmaxGFP vector
was used to ensure transfection efficiency. The average transfection efficiency was approximately 60-70%. Cells were incubated for at least 48 h after nucleofection before performing experiments. Each experiment was performed
at least in triplicate on three different occasions.
to the manufacturer’s protocol. Cells were infected with lentivirus particles at a MOI of 25 with 5 ug/ml polybrene (Sigma-Aldrich) for 24 h and stable cells were selected using 0.5-1 ug/ml puromycin for 2 weeks.
Statistical analyses
Two-tailed Student’s t-test was used for the following assays: quantitative real-time PCR, cell
proliferation assay, colony formation assay, cell cycle analysis, apoptosis assay, migration assay, invasion assay and xenograft growth assay.
Study approval
Informed written consent was obtained from all the patients for the sample collection and their use in research
and projects were approved by Ethical Review Boards.
ACKNOWLEDGMENTS
Dedicated to the memory of Wendy Landes who inspired this study. We thank Prof. Patrick Tan and Dr. Z. Zang for generously sharing related facilities.
GRANT SUPPORT
This work was funded by the Singapore Ministry of Health’s National Medical Research Council (NMRC)
under its Singapore Translational Research (STaR)
Investigator Award to H. Phillip Koeffler, NMRC Centre Grant awarded to National University Cancer Institute of
Singapore, the National Research Foundation Singapore
and the Singapore Ministry of Education under its Research Centres of Excellence initiative and NCIS Centre Grant Seed Funding Program awarded by National
University Cancer Institute, Singapore (NCIS). Myklebost
and Meza-Zepeda were supported by a grant from the Liddy Shriver Sarcoma Initiative. H. Phillip Koeffler and Charles Forscher were supported by grant from Alan B. Slifka Foundation.
CONFLICTS OF INTEREST
The authors have declared that no conflict of interest
exists.
REFERENCES
1. Mack TM. Sarcomas and other malignancies of soft tissue, retroperitoneum, peritoneum, pleura, heart, mediastinum, and spleen. Cancer. 1995; 75:211-244.
2. Dalal KM, Antonescu CR and Singer S. Diagnosis and management of lipomatous tumors. Journal of surgical
oncology. 2008; 97:298-313.
3. Jo VY and Fletcher CD. WHO classification of soft tissue tumours: an update based on the 2013 (4th) edition. Pathology. 2014; 46:95-104.
4. Rosai J, Akerman M, Dal Cin P, DeWever I, Fletcher CD, Mandahl N, Mertens F, Mitelman F, Rydholm A, Sciot R, Tallini G, Van den Berghe H, Van de Ven W, Vanni R and Willen H. Combined morphologic and karyotypic study of 59 atypical lipomatous tumors. Evaluation of their relationship and differential diagnosis with other adipose tissue tumors (a report of the CHAMP Study Group). The American journal of surgical pathology. 1996; 20:1182-1189.
5. Crozat A, Aman P, Mandahl N and Ron D. Fusion of CHOP to a novel RNA-binding protein in human myxoid liposarcoma. Nature. 1993; 363:640-644.
6. Pedeutour F, Forus A, Coindre JM, Berner JM, Nicolo G, Michiels JF, Terrier P, Ranchere-Vince D, Collin F, Myklebost O and Turc-Carel C. Structure of the supernumerary ring and giant rod chromosomes in adipose tissue tumors. Genes, chromosomes & cancer. 1999; 24:30-41.
7. Barretina J, Taylor BS, Banerji S, Ramos AH, Lagos-Quintana M, Decarolis PL, Shah K, Socci ND, Weir BA, Ho A, Chiang DY, Reva B, Mermel CH, Getz G, Antipin Y, Beroukhim R, et al. Subtype-specific genomic alterations define new targets for soft-tissue sarcoma therapy. Nature genetics. 2010; 42:715-721.
8. Taylor BS, DeCarolis PL, Angeles CV, Brenet F, Schultz N, Antonescu CR, Scandura JM, Sander C, Viale AJ, Socci ND and Singer S. Frequent alterations and epigenetic silencing of differentiation pathway genes in structurally rearranged liposarcomas. Cancer discovery. 2011; 1:587-597. 9. Italiano A, Bianchini L, Keslair F, Bonnafous S,
Cardot-Leccia N, Coindre JM, Dumollard JM, Hofman P, Leroux A, Mainguene C, Peyrottes I, Ranchere-Vince D, Terrier P, Tran A, Gual P and Pedeutour F. HMGA2 is the partner of MDM2 in well-differentiated and dedifferentiated liposarcomas whereas CDK4 belongs to a distinct inconsistent amplicon. International journal of cancer Journal international du cancer. 2008; 122:2233-2241. 10. Lee DH, Amanat S, Goff C, Weiss LM, Said JW, Doan
NB, Sato-Otsubo A, Ogawa S, Forscher C and Koeffler HP. Overexpression of miR-26a-2 in human liposarcoma is correlated with poor patient survival. Oncogenesis. 2013; 2:e47.
11. McGwire GB and Skidgel RA. Extracellular conversion of epidermal growth factor (EGF) to des-Arg53-EGF by carboxypeptidase M. The Journal of biological chemistry. 1995; 270:17154-17158.
500:415-421.
13. Shimamori Y, Kumagai Y, Watanabe Y and Fujimoto Y. Human placental carboxypeptidase M is anchored by a glycosyl-phosphatidylinositol moiety. Biochemistry international. 1990; 20:607-613.
14. Skidgel RA, McGwire GB and Li XY. Membrane anchoring and release of carboxypeptidase M: implications for extracellular hydrolysis of peptide hormones. Immunopharmacology. 1996; 32:48-52.
15. Erickson-Johnson MR, Seys AR, Roth CW, King AA, Hulshizer RL, Wang X, Asmann YW, Lloyd RV, Jacob EK and Oliveira AM. Carboxypeptidase M: a biomarker for the discrimination of well-differentiated liposarcoma from lipoma. Modern pathology : an official journal of the United States and Canadian Academy of Pathology, Inc. 2009; 22:1541-1547.
16. Tsakiris I, Soos G, Nemes Z, Kiss SS, Andras C, Szanto J and Dezso B. The presence of carboxypeptidase-M in tumour cells signifies epidermal growth factor receptor expression in lung adenocarcinomas: the coexistence predicts a poor prognosis regardless of EGFR levels. Journal of cancer research and clinical oncology. 2008; 134:439-451.
17. Zhang H, Erickson-Johnson M, Wang X, Oliveira JL, Nascimento AG, Sim FH, Wenger DE, Zamolyi RQ, Pannain VL and Oliveira AM. Molecular testing for lipomatous tumors: critical analysis and test recommendations based on the analysis of 405 extremity-based tumors. The American journal of surgical pathology. 2010; 34:1304-1311.
18. Dohner H, Stilgenbauer S, Benner A, Leupolt E, Krober A, Bullinger L, Dohner K, Bentz M and Lichter P. Genomic aberrations and survival in chronic lymphocytic leukemia. The New England journal of medicine. 2000; 343:1910-1916.
19. Stilgenbauer S, Nickolenko J, Wilhelm J, Wolf S, Weitz S, Dohner K, Boehm T, Dohner H and Lichter P. Expressed sequences as candidates for a novel tumor suppressor gene at band 13q14 in B-cell chronic lymphocytic leukemia and mantle cell lymphoma. Oncogene. 1998; 16:1891-1897. 20. Elnenaei MO, Hamoudi RA, Swansbury J,
Gruszka-Westwood AM, Brito-Babapulle V, Matutes E and Catovsky D. Delineation of the minimal region of loss at 13q14 in multiple myeloma. Genes, chromosomes & cancer. 2003; 36:99-106.
21. Dong JT, Boyd JC and Frierson HF, Jr. Loss of heterozygosity at 13q14 and 13q21 in high grade, high stage prostate cancer. Prostate. 2001; 49:166-171.
22. Cimmino A, Calin GA, Fabbri M, Iorio MV, Ferracin M, Shimizu M, Wojcik SE, Aqeilan RI, Zupo S, Dono M, Rassenti L, Alder H, Volinia S, Liu CG, Kipps TJ, Negrini M, et al. miR-15 and miR-16 induce apoptosis by targeting BCL2. Proc Natl Acad Sci U S A. 2005; 102:13944-13949. 23. Souers AJ, Leverson JD, Boghaert ER, Ackler SL, Catron
ND, Chen J, Dayton BD, Ding H, Enschede SH, Fairbrother WJ, Huang DC, Hymowitz SG, Jin S, Khaw SL, Kovar PJ, Lam LT, et al. ABT-199, a potent and selective BCL-2 inhibitor, achieves antitumor activity while sparing platelets. Nat Med. 2013; 19:202-208.
24. Dees ND, Zhang Q, Kandoth C, Wendl MC, Schierding W, Koboldt DC, Mooney TB, Callaway MB, Dooling D, Mardis ER, Wilson RK and Ding L. MuSiC: identifying mutational significance in cancer genomes. Genome research. 2012; 22:1589-1598.
25. Hanahan D and Weinberg RA. Hallmarks of cancer: the next generation. Cell. 2011; 144:646-674.
26. Biankin AV, Waddell N, Kassahn KS, Gingras MC, Muthuswamy LB, Johns AL, Miller DK, Wilson PJ, Patch AM, Wu J, Chang DK, Cowley MJ, Gardiner BB, Song S, Harliwong I, Idrisoglu S, et al. Pancreatic cancer genomes reveal aberrations in axon guidance pathway genes. Nature. 2012; 491:399-405.
27. Buchberg AM, Cleveland LS, Jenkins NA and Copeland NG. Sequence homology shared by neurofibromatosis type-1 gene and IRA-1 and IRA-2 negative regulators of the RAS cyclic AMP pathway. Nature. 1990; 347:291-294. 28. Cichowski K and Jacks T. NF1 tumor suppressor gene
function: narrowing the GAP. Cell. 2001; 104:593-604. 29. Ponti G, Martorana D, Pellacani G, Ruini C, Loschi P,
Baccarani A, De Santis G, Pollio A, Neri TM, Mandel VD, Maiorana A, Maccio L, Maccaferri M and Tomasi A. NF1 truncating mutations associated to aggressive clinical phenotype with elephantiasis neuromatosa and solid malignancies. Anticancer research. 2014; 34:3021-3030. 30. Davies H, Bignell GR, Cox C, Stephens P, Edkins S, Clegg
S, Teague J, Woffendin H, Garnett MJ, Bottomley W, Davis N, Dicks E, Ewing R, Floyd Y, Gray K, Hall S, et al. Mutations of the BRAF gene in human cancer. Nature. 2002; 417:949-954.
31. Roth AD, Tejpar S, Delorenzi M, Yan P, Fiocca R, Klingbiel D, Dietrich D, Biesmans B, Bodoky G, Barone C, Aranda E, Nordlinger B, Cisar L, Labianca R, Cunningham D, Van Cutsem E, et al. Prognostic role of KRAS and BRAF in stage II and III resected colon cancer: results of the translational study on the PETACC-3, EORTC 40993, SAKK 60-00 trial. Journal of clinical oncology : official journal of the American Society of Clinical Oncology. 2010; 28:466-474.
32. Wabitsch M, Bruderlein S, Melzner I, Braun M, Mechtersheimer G and Moller P. LiSa-2, a novel human liposarcoma cell line with a high capacity for terminal adipose differentiation. International journal of cancer Journal international du cancer. 2000; 88:889-894. 33. Nishio J, Iwasaki H, Ishiguro M, Ohjimi Y, Fujita C,
34. Snyder EL, Sandstrom DJ, Law K, Fiore C, Sicinska E, Brito J, Bailey D, Fletcher JA, Loda M, Rodig SJ, Dal Cin P and Fletcher CD. c-Jun amplification and overexpression are oncogenic in liposarcoma but not always sufficient to inhibit the adipocytic differentiation programme. The Journal of pathology. 2009; 218:292-300.
35. Persson F, Olofsson A, Sjogren H, Chebbo N, Nilsson B, Stenman G and Aman P. Characterization of the 12q amplicons by high-resolution, oligonucleotide array CGH and expression analyses of a novel liposarcoma cell line. Cancer letters. 2008; 260:37-47.
36. Aman P, Ron D, Mandahl N, Fioretos T, Heim S, Arheden K, Willen H, Rydholm A and Mitelman F. Rearrangement of the transcription factor gene CHOP in myxoid liposarcomas with t(12;16)(q13;p11). Genes, chromosomes & cancer. 1992; 5:278-285.
37. Braas D, Ahler E, Tam B, Nathanson D, Riedinger M, Benz MR, Smith KB, Eilber FC, Witte ON, Tap WD, Wu H and Christofk HR. Metabolomics strategy reveals subpopulation of liposarcomas sensitive to gemcitabine treatment. Cancer discovery. 2012; 2:1109-1117.
38. Stratford EW, Castro R, Daffinrud J, Skarn M, Lauvrak S, Munthe E and Myklebost O. Characterization of liposarcoma cell lines for preclinical and biological studies. Sarcoma. 2012; 2012:148614.
39. Maciejewski JP, Tiu RV and O’Keefe C. Application of array-based whole genome scanning technologies as a cytogenetic tool in haematological malignancies. British journal of haematology. 2009; 146:479-488.
40. Bengtsson H, Wirapati P and Speed TP. A single-array preprocessing method for estimating full-resolution raw copy numbers from all Affymetrix genotyping arrays including GenomeWideSNP 5 & 6. Bioinformatics. 2009; 25:2149-2156.
41. Hupe P, Stransky N, Thiery JP, Radvanyi F and Barillot E. Analysis of array CGH data: from signal ratio to gain and loss of DNA regions. Bioinformatics. 2004; 20:3413-3422. 42. Mermel CH, Schumacher SE, Hill B, Meyerson ML,
Beroukhim R and Getz G. GISTIC2.0 facilitates sensitive and confident localization of the targets of focal somatic copy-number alteration in human cancers. Genome biology. 2011; 12:R41.
43. Yoshida K, Sanada M, Shiraishi Y, Nowak D, Nagata Y, Yamamoto R, Sato Y, Sato-Otsubo A, Kon A, Nagasaki M, Chalkidis G, Suzuki Y, Shiosaka M, Kawahata R, Yamaguchi T, Otsu M, et al. Frequent pathway mutations of splicing machinery in myelodysplasia. Nature. 2011; 478:64-69.
44. Sato Y, Yoshizato T, Shiraishi Y, Maekawa S, Okuno Y, Kamura T, Shimamura T, Sato-Otsubo A, Nagae G, Suzuki H, Nagata Y, Yoshida K, Kon A, Suzuki Y, Chiba K, Tanaka H, et al. Integrated molecular analysis of clear-cell renal cell carcinoma. Nature genetics. 2013; 45:860-867. 45. Sakaguchi H, Okuno Y, Muramatsu H, Yoshida K,
Shiraishi Y, Takahashi M, Kon A, Sanada M, Chiba K, Tanaka H, Makishima H, Wang X, Xu Y, Doisaki S, Hama A, Nakanishi K, et al. Exome sequencing identifies secondary mutations of SETBP1 and JAK3 in juvenile myelomonocytic leukemia. Nature genetics. 2013; 45:937-941.
46. Yoshida K, Toki T, Okuno Y, Kanezaki R, Shiraishi Y, Sato-Otsubo A, Sanada M, Park MJ, Terui K, Suzuki H, Kon A, Nagata Y, Sato Y, Wang R, Shiba N, Chiba K, et al. The landscape of somatic mutations in Down syndrome-related myeloid disorders. Nature genetics. 2013; 45:1293-1299.
47. Wendl MC, Wallis JW, Lin L, Kandoth C, Mardis ER, Wilson RK and Ding L. PathScan: a tool for discerning mutational significance in groups of putative cancer genes. Bioinformatics. 2011; 27:1595-1602.
48. Mardis ER, Ding L, Dooling DJ, Larson DE, McLellan MD, Chen K, Koboldt DC, Fulton RS, Delehaunty KD, McGrath SD, Fulton LA, Locke DP, Magrini VJ, Abbott RM, Vickery TL, Reed JS, et al. Recurring mutations found by sequencing an acute myeloid leukemia genome. The New England journal of medicine. 2009; 361:1058-1066. 49. Koboldt DC, Zhang Q, Larson DE, Shen D, McLellan MD,
Lin L, Miller CA, Mardis ER, Ding L and Wilson RK. VarScan 2: somatic mutation and copy number alteration discovery in cancer by exome sequencing. Genome research. 2012; 22:568-576.