Vol. 2, No. 1, 21-38
21 THE PSYCHOMETRIC VALIDATION OF THE PRINCIPAL PRACTICES QUESTIONNAIRE
BASED ON ITEM RESPONSE THEORY
Corinne Jacqueline Perera*, Bambang Sumintonoa, Jiang Nab
aInstitute of Educational Leadership, Faculty of Education, University of Malaya b Shangrao Normal University, Shangrao, China
*Corresponding Author Email: jacquelineperera@gmail.com
ABSTRACT
This paper examines the psychometric properties of the Principal Practices Questionnaire (PPQ) for use in school leadership research. The PPQ has been developed as a diagnostic instrument to measure the various dimensions of transformational leadership based on the Rasch Measurement Model. With the growing awareness and importance given to psychometrics, particularly on interval measurement, this paper discusses the development of the PPQ and its psychometric properties based upon the framework of Item Response Theory (IRT). The PPQ was designed to determine the extent to which principals exhibit transformational leadership practices. The PPQ was validated using 290 secondary school teachers to elicit teacher's perceptions about their principals’ leadership practices. The sample comprised practising teachers from six high performing Malaysian public schools. In this study Rasch Model was used to determine the validity of the 30 questionnaire items based on the estimates of item difficulty and psychometrics attribute criteria. The results of this study showed that the PPQ may be supported by evidence as a valid research instrument because of its psychometric properties and internal consistencies. Having shown evidence of high reliability and statistical validity, the PPQ may therefore be used as a basis for assessing the transformational leadership practices of school leaders.
Keywords: Rasch Model, questionnaire validation, Item Response Theory, transformational leadership.
INTRODUCTION
Vol. 2, No. 1, 21-38
22 increasingly being evaluated to ensure that they sustain high levels of capacity to successfully implement transformational change in their schools. In this research, the Principal Practices Questionnaire was used to measure and evaluate school principals’ leadership practices and the objective of using Rasch Model was to test the validity and reliability of the 30-item PPQ.
There have been various diagnostic research instruments particularly questionnaires and inventories that have been developed for measuring various aspects of leadership. However, there are limited number of research instruments used to diagnose the leadership practices of school principals (Devine, 2013; Leithwood & Sun, 2012). The Leadership Practices Inventory is an established instrument constructed primarily to rate the transformational leadership behaviours of corporate leaders. In this study the LPI was selected as the research instrument because of its sound psychometric properties with other studies where evidence of internal reliability and credibility had been established. Nevertheless, the items of the LPI had to be adapted for use with school leadership research within the context of an Asian school leadership setting after which the resultant questionnaire was named ‘Principal Practices Questionnaire’ or PPQ. Thus, the aim of this article is to report on the internal construct validity of the PPQ designed to measure school principals’ leadership practices using the framework of Item Response Theory (IRT).
LITERATURE REVIEW
Scale Metrics in Social Science Research
Questionnaire validation is a crucial part of quantitative research inquiries. Multiple quantitative research studies found between the years 1940 to 1980 were mostly analysed based upon the Classical Test Theory (CTT) in which the validation process was conducted using confirmatory factor analysis (CFA) (Kouzes & Posner, 2012). CFA is associated with traditional factor analysis, in which Likert scale items are assumed to be continuous and normally distributed when in fact they are a set of ordered categories (Bond & Fox, 2007). The interval between Likert scale values are not equal, hence any mean, correlation or other parametric statistics applied to them is considered inappropriate (Jamieson, 2004). According to Jeong and Lee (2016), questionnaire validation using CFA is deemed theoretically incorrect. Smith (2016) also argues that raw scores should not be treated as interval scale data, when in actual fact these scores are ordinal in nature. This is due to the parametric assumption of mathematical theories underlying statistical tests which states that they may be applied to variables that are continuous or based on an interval scale.
Vol. 2, No. 1, 21-38
23 trait known as ‘person’s ability’ while measuring items in terms of ‘item difficulty’. In response to such empirical evidence and the scholarly criticism of the CTT methodology, this study opts for the IRT strand and the use of Rasch Model in determining the internal validity of the items in the Principal Practices Questionnaire.
Item Response Theory Framework
By comparison, IRT is a more recent development in Psychometrics compared to CTT and it is treated more as a model than a theory. Comparison of frameworks also indicates that IRT can determine the reliability scores of item difficulty and person’s abilities whereas CTT fails to take into account the reliability scores of items and persons simultaneously (Bond & Fox, 2007). IRT has been increasingly used to evaluate educational and psychological tests (Bond & Fox, 2007). It is found extensively in studies of cognitive and personality traits and is used as the framework for which unobservable characteristics of respondents are measured (Whittaker & Worthington, 2016). Moreover, Fitkov-Norris & Yeghiazarian (2015) notes the recent use of Rasch analysis in the context of education which is to validate learning inventories and learning preference constructs, although its use has been limited. Meanwhile, the preference for selecting either CTT or IRT has contributed to continuous statistical debates among researchers.
The uniqueness of IRT Rasch Modelling lies in rescaling measures mathematically by transforming ordinal data to equal-interval measures. The Rasch calibration shows evidence of how fundamental measurement should operate with social and psychological variables (Bond & Fox, 2015). Rasch Model is useful as a diagnostic tool for determining the reliability and validity of items in a questionnaire. Rasch Model provides two reliability measures which is item reliability and person reliability. Bond and Fox, (2007) further illustrates the definition of item reliability as the consistency of assessment outcomes generated by an instrument when it is tested on another group of respondents with similar traits. Person reliability refers to how reliable a group of respondents are towards providing similar responses toward another instrument having items of similar difficulty level. On the same lines, Abdullah and Lim, (2013) stated that the reliability measures of an instrument is an indicator that benchmarks how capable the instrument is in distinguishing the level of conceptual understanding among the group of respondents.
Vol. 2, No. 1, 21-38
24 METHODOLOGY
Development of the Principal Practices Questionnaire (PPQ)
The PPQ was adapted from Kouzes and Posner’s ‘Leadership Practices Inventory’ and was developed through a course of 3 pilot testing phases. During the first phase every effort was taken to adhere to the ethical requisition procedures involved in obtaining the consent from the instrument developers and their authorised publisher for the official use1 of the ‘Leadership Practices Inventory’ in this study. The reason for the purchase and official permission required from the developers of the LPI was because the LPI was a tried and tested research instrument suitable for measuring the leadership practices of exemplary corporate leaders. For the present study the LPI was selected mainly because of its leadership practices construct and its five sub-dimensions that was used as the theoretical basis for developing an instrument that can measure the leadership practices of high performing school principals. This was the reason for the adaptation of the LPI. However, the items of the LPI could not be used in its original form because they were designed to measure the leadership practices of corporate leaders and not school leaders or school principals.
The original LPI underwent a series of pilot tests. During the first pilot test, the LPI was administered to three school principals from best performing private schools in Malaysia. A follow-up interview with these 3 principals provided useful qualitative evidence regarding the 10-point rating scale being too wide a range implying a preference for a smaller range instead. They also commented about the wordings of the items being more suited for corporate leadership practices. As a result, the second pilot test involved modifying the items of the LPI and scale reconstruction to enhance the credibility of the new instrument for use with school leadership research. The following section describes how the items of the LPI were modified and how it eventually led to the development of the PPQ:
• The items of the LPI were modified and reworded to suit the educational setting of this research study. Appendix 1 further illustrates the comparison between the LPI and the PPQ, showing that the bold text in the LPI indicates the selected text that were removed and substituted with suitable words to reflect a school leadership setting. As a result, the newly modified LPI gave rise to the PPQ and this instrument was used in this study to measure principal leadership practices within an Asian school context.
• The original items of the LPI is based on 5 sub-dimensions which collectively measure the exemplary leadership practices of leaders: Model the way; Inspire a shared vision; Challenge the process; Enable others to act; Encourage the heart. According to the developer of the LPI these dimensions model after transformational leadership and that this leadership construct is underpinned by the transformational leadership theory (Perera, 2015). In the same manner, the PPQ is also built upon these 5 same dimensions and it measures the extent of which the school principal is perceived as a transformational leader (see Table 1 for the sub-dimensions and their corresponding items).
Vol. 2, No. 1, 21-38
25
• Response categories of the LPI were altered to a 7-category rating scale and set at ‘never to always’. According to Lubke and Muthen, (2004) a 7-point rating is a better predictor of ordinal continuity compared to a 5-point rating scale. This has been argued from the perspective of factor analysis and the underlying Classical Test Theory.
• The rating categories were designed without a number coding scheme that label responses. This was to reduce inter-rater biasness among respondents who may possibly show a preference for certain numbers in their response options.
[image:5.595.109.490.385.471.2]• The inclusion of negative-worded items was the authors intended choice to modify the positive worded LPI by using a mixture of positive and negative wordings. Six negative-worded items were included by reversing the positive wordings of the original LPI items by using negative connotations (see Table 1 and Appendix A for the reverse-worded items. The inclusion of negative-worded items were intended to prevent response bias. According to Van Sonderen, Sanderman and Coyne, (2013) reversing items is a case where the direction of the item is changed by using words with an opposite meaning. This will compel respondents to read the survey items carefully and keep respondents attentive to their responses. It was also done intentionally to identify the effect of these negative items on the survey responses and to verify whether the inclusion of negative-worded items did evidently improve respondents’ attentiveness or did it actually obscure the meaning of the items.
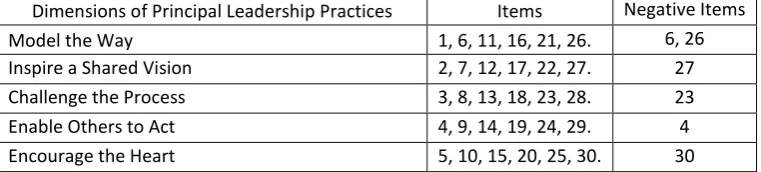
Table 1: Principal Practices Questionnaire: Dimensions and Items
Dimensions of Principal Leadership Practices Items Negative Items
Model the Way 1, 6, 11, 16, 21, 26. 6, 26
Inspire a Shared Vision 2, 7, 12, 17, 22, 27. 27
Challenge the Process 3, 8, 13, 18, 23, 28. 23
Enable Others to Act 4, 9, 14, 19, 24, 29. 4
Encourage the Heart 5, 10, 15, 20, 25, 30. 30
• The English version of the original LPI was translated to ‘Bahasa Malaysia’ (lit. Malay) to accommodate the respondents’ language preference in Malaysia. The resultant PPQ was thus developed as a bilingual (English/Malay) questionnaire and was then administered to 105 randomly selected teachers from two Malaysian high performing schools.
During the third pilot phase, an interview was conducted with a respondent who volunteered to provide interpretations of the questionnaire items. The critical feedback obtained from this interview provided useful suggestions for refining some of the items which had ambiguous wordings and this provided qualitative evidence that established cognitive validity for the instrument. The constructive feedback also provided further suggestions on adopting the more commonly used Likert ratings. Subsequently the following response options were used: ‘Strongly Disagree’ to ‘Strongly Agree’ (see Table 2). The uniqueness of this rating scale is that there are no numbers assigned to the response options as seen in Table 2.
Vol. 2, No. 1, 21-38
26 PPQ. Subsequently the instrument was sent to three language experts to authenticate the content and face validity of the translation. An additional three-step ‘back-translation’ procedure as described in Perera (2015) was used to check the accuracy and ensure equivalence in both the original and translated instruments. So the questionnaire validation process ensured that the translations were linguistically correct and thereby established face and content validity of the PPQ. Eventually the new 30-item bilingual questionnaire was administered to a random sample of 290 teacher respondents who volunteered to elicit their perceptions regarding each of their school principal’s leadership practices. These participants were selected from six Malaysian high performing secondary schools and they formed the sample size of this present study.
Table 2: Likert-type Rating Scale
STRONGLY
DISAGREE DISAGREE NEUTRAL AGREE
STRONGLY AGREE
Addressing the concerns about the sample selection and the notion of generalizability, this paper purports that it is not the scope of this research project to generalise the findings of this study towards all school principals in Malaysia. The sample selection of six daily secondary school principals compared to the population of more than ten thousand public schools in Malaysia certainly does not allow for generalization. In addition, the authors acknowledge that through this research the psychometric properties of the PPQ were established and it can now serve as a reliable research instrument for use with educational leadership research.
The next part of this article focusses on the construct validity of the PPQ with the aim of providing empirical evidence of the reliability indices obtained through the mathematical formulations computed through Rasch Modeling. The Results section reports on the overall fit of the PPQ using the software Winsteps (version 3.73) whereby various ‘Output Tables’ were generated through the Rasch analysis procedure and were used for the psychometric evaluation of this instrument.
RESULTS
In this study Rasch Modeling provided the basis for establishing the measurement scale of the PPQ. Through its calibration of item difficulties and person abilities the Winsteps software mathematically transformed raw ordinal data into logit measures while simultaneously assessing the overall fit of the instrument (Linacre, 2012). The result of this iterative process generates important output tables that present the diagnostic evaluation of the PPQ relevant for reporting on the fit statistics and psychometric properties of this instrument.
Summary Statistics
Vol. 2, No. 1, 21-38
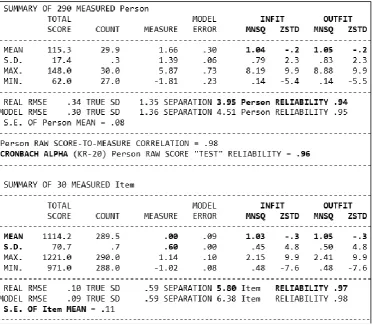
27 Person Reliability and Item Reliability
[image:7.595.114.487.268.596.2]According to the Summary Statistics of Table 3 the ‘real’ Person Reliability index (0.94) indicates that the consistency of person responses is ‘very good’ (Sumintono & Widhiarso, 2014). This implies that the scale discriminates very well between the persons. The same logic of interpretation applies to the Item Reliability measures of 0.97, which is also classified as ‘very good’ (ibid). This suggests that the probability of persons responding to items will very likely be high. High Item Reliability estimates also suggest that the items define the latent variable very well. As such the PPQ may be regarded as a reliable instrument for use with different group of respondents.
Table 3: Summary Statistics
Cronbach Alpha
Vol. 2, No. 1, 21-38
28 Person and Item Separation Index
Person Separation index is an estimate of how well the PPQ can distinguish between ‘Person abilities’ in terms of the latent trait. The bigger the separation index the more likely the respondents will respond correctly to the items. On the other hand the Item Separation index indicates how wide spread the items are in defining both the easy and difficult items. The wider the spread is the better the fit. In this study the Person Separation index (3.95) and the Item Separation index (5.80) are clear indications of good spread across the range of respondents and items. These criteria endorse the PPQ as a fit and reliable instrument for the study of identifying principal leadership practices of school principals.
Item Calibration
Item calibration involves an IRT modeling iteration process whereby item locations are often scaled first. Items are ordered and scaled according to their level of difficulty. The higher the location of an item the more difficult the item gets (see Figure 2). By default the Item Mean (µItem) is set to 0 logit (0.00). Items located at zero logits represent items of average difficulty. For purpose of illustration the red line drawn across 0 logit in Figure 2 is the location of the Item Mean. The ‘M’ located on the item side refers to the Mean Item measure generated by Winsteps (Boone et al., 2014). The Summary Statistics also report on the Mean score of Items as 0.00 logit and the Standard Deviation as 0.60 logits. The region of the scale where the Items are ordered is in the range of (+1.14) to (-1.02) logits. This shows that the item calibrated points lie within the 2-Standard Deviation (SD) range whereby 1 SD = 0.6 logit and 2 SD = 0.6 x 2 = 1.2 logit. The 2SD Item calibrations is also an indication of the absence of misfit items found in this instrument.
Precision of measurement
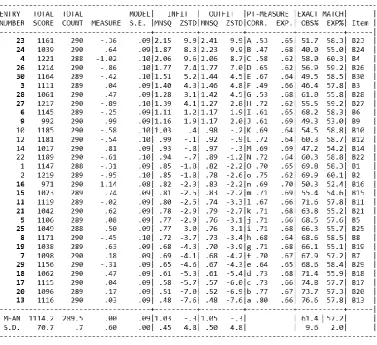
Precision of measurement for any instrument is crucial for inferences and conclusions drawn. Therefore, accurate and reliable measurement is vital when evaluating the reliability and discriminating power of instruments (Zagorsek, Stough, & Jaklic, 2006). The precision of item estimate values are illustrated in the Item Column Fit Order (Table 4). The column labeled ‘Model S.E.’ is the ‘Standard Error of Measure’ associated with each item estimate. Standard errors in well-targeted instruments should be within 0.5 logits (< 0.5). The standard errors of Item estimates in Table 4 indicate that the range is between 0.08 – 0.10 logits. This is indicative of reliable and good Item fit suggesting precision of measurement.
Misfit Indices
Vol. 2, No. 1, 21-38
29 Outfit Mean Square
[image:9.595.111.489.291.636.2]The Outfit MNSQ is an un-weighted statistic that ascribes to the sums of squared standardized residuals. It also refers to the size of ‘misfit’ reported in the actual data. According to Bond and Fox (2015) the variance is larger for well-targeted observations and smaller for extreme observations. In this study the Outfit MNSQ (+1.05) shows acceptable variances within the responses because the accepted value of this fit statistic is close to 1. It is also important to examine and consider the existence of misfit items in a questionnaire which could arise if items are either too easy or too difficult for respondents. This could result in a situation where the items do not exactly measure the desired latent variable. Outfit MNSQ measures are more susceptible to extreme responses compared to Infit MNSQ measures. In this study the Outfit Mean Square measures fall within the acceptable fit range (0.5 < y < 1.5) (Abdullah & Lim, 2013).
Table 4: Item Column Fit Order
Outfit Z Standard (ZSTD)
Vol. 2, No. 1, 21-38
30 Point Measure Correlation
The Point Measure Correlation is the measure used to identify the internal consistencies of both Items and Persons. Items with negative Point Measure Correlation are an indication of misfit items. The Point Measure Correlation estimates are listed in Table 4 under the column labelled ‘PT-MEASURE CORR.’. According to the values seen in the PT-MEASURE CORR column there are no negative values identified. Moreover, all values fall within the acceptable criteria of 0.32 < x < 0.8 as described in Abdullah and Lim (2013). In summary a general guideline in Boone et al. (2014) concerning content validity, fit statistics or identifying misfit items or persons according to the Rasch Measurement Model, is to ensure that the estimates fall within these defining criteria:
• Point Measure Correlation: 0.32 < x < 0.8
• Outfit Mean Square: 0.5 < y < 1.5
• Outfit Z standard: -2.0 < Z <+2.0
CONSTRUCT VALIDITY
Unidimensionality Analysis
Unidimensionality is the fundamental requirement in construct validity because instruments should be designed to measure only one latent construct. In Rasch Modeling ‘Unidimensionality’ refers to invariant measurement (Engelhard Jr, 2013). The requirement of Unidimensionality is essential for establishing the parameter estimates of Rasch Modeling (Sinnema et al., 2016). The importance in establishing a unidimensional structure is that it provides evidence of internal consistency (Curtis & Boman, 2007; Huberty, Vener, Gao, Matthews, Ransdell, & Elavsky, 2013). The Item Unidimensionality analysis shown in Table 5 provides unbiased reliability estimates that report on the coherence of items and their conformity to the requirement of Unidimensionality. According to Sinnema et al. (2016) the criteria for establishing Unidimensionality is that the ‘raw variance explained by measure’ should account for at least 20 percent of the test variance. The raw data (48.4%) does account for much more than 20% (see Table 5). This indicates that the Unidimensionality requirement has been met. Engelhard Jr (2013) suggests that further analysis of dimensionality may be achieved through the Eigenvalue units of observed data (4.9, 2.5, 2.2, 1.8 and 1.5) obtained from the matrix of item inter-correlations displayed in Table 5. These Eigenvalues conform to the 3-to-1 ratio of the first-to-second Eigenvalues (Huberty et al., 2013; Alagumalai et al., 2005). This is another criteria for establishing Unidimensionality as suggested by Sinnema et al. (2016). Further evidence of Unidimensionality was established by the ‘unexplained variance (expressed in terms of raw residuals) and the five factors showing that the Eigenvalue units are less than 15%. This is the empirical evidence of Unidimensionality and construct validity established for the PPQ.
Rating Scale
Vol. 2, No. 1, 21-38
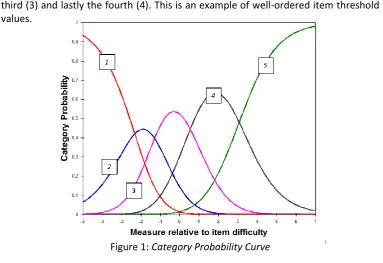
[image:11.595.107.489.223.369.2]31 negative to positive: (- .37), (- .28), (+.50), (+ 1.77) and (+3.17). This test is an indication that the respondents are able to discriminate between the 5-point response options (strongly disagree to strongly agree) used in the PPQ. The results of the rating scale analysis therefore implies that the increasing values of ‘Observed Average’ verify the respondents’ level of agreement based on these 5-point rating categories. Further analysis of the ‘options response functions’ of this study represented by the following five response categories proceeded with the analysis of the Category Characteristic Curves (CCC) seen in Figure 1.
Table 5: Item Unidimensionality
The respondents were asked to choose one of the following Likert-type options as shown in Table 2: ‘1 = Strongly Disagree’; ‘2 = Disagree’; ‘3 = Neutral’; ‘4 = Agree’; or ‘5 = Strongly Agree.’ These rating options reflect the increasing levels of the latent construct which correspond to the categories 'strongly disagree' 'disagree', 'neutral', 'agree' and 'strongly agree'. The graph in Figure 1 defines the boundaries between the ordered response categories. As such each rating category is segregated because of the item threshold values between these rating categories. The item threshold values are ordered from low to high and are presented in such a manner where the first probability curve (1) cuts the second probability curve (2) then followed by the third (3) and lastly the fourth (4). This is an example of well-ordered item threshold values.
[image:11.595.107.491.506.769.2]Vol. 2, No. 1, 21-38
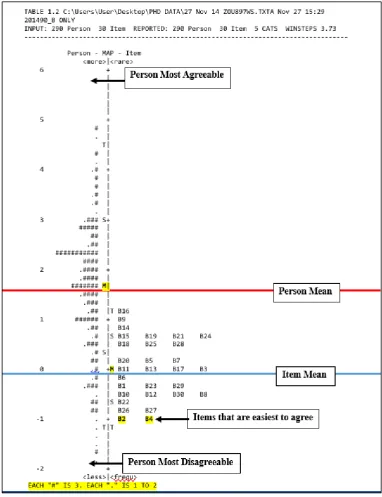
32 Item-Person Variable Map
[image:12.595.107.490.133.631.2]One of the highlights of IRT is the Variable Map which plots the distribution of Persons and Items on a singular measurement continuum.
Figure 2: Variable Map
Vol. 2, No. 1, 21-38
33 values are the Persons who tend to be ‘more disagreeable’ or ‘less able’. As for Item difficulty parameters the Variable Map orders items according to their difficulty level. Items located at the top right are difficult to yield a correct response while items at the lower right are easy to yield a correct response.
The left of the Variable Map denotes the location of the respondents ordered from the lowest to the highest ratings spanning from the bottom to the top. According to Figure 2 the Person logit measures are spread over almost 8 logits. This means that the Person ability estimates span across much of the Likert response continuum. As for the item locations, they appear to be distributed not as adequately across the difficulty continuum of the construct. This lack of item spread can prevent the scale’s ability to clearly differentiate between the respondents high and low ability estimates. Furthermore, the position of the 30 items are found to be clustered around the centre region of the continuum with item calibrations spanning between +1.14 and -1.02. Moreover, looking at the position of the most ‘difficult item’ (B16) located at +1.14 logit, there is a reasonably large number of Persons estimates located above B16.
Besides, the location of the Person Mean measure represented by the horizontal line drawn across +1.66 logit implies that the average respondents appeared to agree with all the items since the ‘most difficult item’, B16 (+1.14 logit) is located below the Person Mean measure (+1.66 logit). By comparison to a Classical Test analysis a highly-scored test may point to the conclusion that the respondents have high ability and therefore scored very well. By contrast, an IRT test analysis through the Variable Map is an indication of respondents’ ability mapped out against their respective responses. The Variable Map also singles out any outliers for Person and Items. As for item difficulty the Variable Map analysis would identify the overall level of item difficulty. The Variable Map serves as a benchmark that is highly useful for instrument developers in improving the quality of their instrument.
In this study the PPQ was calibrated using Rasch Model. After having undergone rigorous item-testing based on a series of psychometric analyses the PPQ was reported to have attained overall fit of the persons and items to the model. The reliability indexes of the items and persons were found to be acceptable and this indicates that the PPQ has met the acceptable standards of validity and reliability.
CONCLUSION
Z-Vol. 2, No. 1, 21-38
34 Standard indicators of item fit statistics. Validity coherence was also established through the unidimensionality test and rating scale discrimination. In terms of fit statistics all the items appear to fulfil the quality criteria, however the overall spread of items across the Person-Item continuum is apparent. Ideally the item parameters and their difficulty levels should spread across the person estimates or else it may have implications in establishing construct validity within an IRT scale fitting. For practical usefulness the option to revise the difficulty level of the items would be an attempt to further refine the PPQ for use in other school settings. In this study the PPQ has been empirically tested and validated as an instrument for evaluating the extent of transformational leadership practices exhibited by school principals’. The establishment of the PPQ through its fit and reliability indices has provided a foreground for replicating its use while making an added contribution towards school leadership research. This paper concludes that the PPQ developed for this study has demonstrated practical significance for its continued use in educational research and could thereby be used as an instrument for measuring transformational leadership practices of leaders in an educational context.
FUNDING
This research study received its source of funding from the “South East Asia Leadership” (SEAL) project grant (J-50105-73519) University of Malaya, Malaysia.
REFERENCES
Abdullah, N., & Lim, B. K. (2013). Parallel Circuit Conceptual Understanding Test (PCCUT). Procedia-Social and Behavioural Sciences, 90, 431-440. Doi: 10.1016/j.sbspro.2013.07.112
Adams, D., Raman Kutty, G., & Mohd Zabidi, Z. (2017) Educational Leadership for the 21st Century. International Online Journal of Educational Leadership, 1(1), 1-4.
Alagumalai, S., Curtis, D. D., & Hungi, N. (2005) Applied Rasch Measurement: A book of exemplars. In Rupert M. and Ryo W. (Series Ed.): Vol. 4. Papers in Honour of John P. Keeves. Netherlands: Springer.
Allerup P., & Torre A. (2017) Views on Classical Statistical Modeling in Competition with the Rasch Methodology. In Rosén M., Yang Hansen K., & Wolff U. (Eds), Cognitive Abilities and Educational Outcomes. (pp. 295-312). Cham, Switzerland: Springer International Publishing.
Bond, T. G., & Fox, C. M. (2007). Applying the Rasch Model: Fundamental Measurement in the Human Sciences (2nd ed.). Mahwah, NJ: Lawrence Erlbaum Associates Inc.
Bond, T. G., & Fox, C. M. (2015). Applying the Rasch Model: Fundamental Measurement in the Human Sciences (3rd Edition). New York: Routledge. Boone, W. J., Staver, J. R., & Yale, M. S. (2014). Rasch Analysis in the Human
Sciences. Netherlands: Springer.
Curtis, D. D., & Boman, P. (2007). Xray your data with Rasch. International Education Journal, 8(2), 249-259.
Devine, D. (2013). Practising leadership in newly multi-ethnic schools: tensions in the field? British Journal of Sociology of Education, 34(3), 392-411. Doi: 10.1080/01425692.2012.722273
Vol. 2, No. 1, 21-38
35 Fitkov-Norris, E. D. & Yeghiazarian, A. (2015). Validation of VARK learning modalities
questionnaire using Rasch analysis. Journal of Physics: Conference Series. 588(1), 012048.
Hambleton, R. K., Swaminathan, H., & Rogers, H. J. (1991). Fundamentals of Item Response Theory. Newbury Park, CA: Sage.
Harris, A., Jones, M. S., Adams, D., Perera, C. J., & Sharma, S. (2014). High-Performing Education Systems in Asia: Leadership Art meets Implementation Science. The Asia-Pacific Education Researcher, 23(4), 861-869.
Harwell, M. R., & Gatti, G. G. (2001). Rescaling Ordinal Data to Interval Data in Educational Research. Review of Educational Research, 71(1), 105-131. Huberty, J., Vener, J., Gao, Y., Matthews, J. L., Ransdell, L., & Elavsky, S. (2013).
Developing an Instrument to Measure Physical Activity Related Self-Worth in Women: Rasch analysis of the Women's Physical Activity Self-Worth Inventory (WPASWI). Psychology of Sport and Exercise, 14(1), 111-121. Doi: 10.1016/j.psychsport.2012.07.009
Jamieson, S. (2004). Likert scales: how to (ab)use them. Medical Education, 38(12), 1217-1218
Jeong, H. & Lee, W. (2016). Item Response Theory-Based Evaluation of Psychometric Properties of the Safety Attitudes Questionnaire-Korean Version (SAQ-K). Biometrics & Biostatistics International Journal, 3(5), 1-15.
Jones, M., Adams, D., Hwee Joo, M. T., Muniandy, V., Perera, C. J., Harris, A. (2015). Contemporary Challenges and Changes: principals’ leadership practices in Malaysia. Asia Pacific Journal of Education, 35(3), 353-365.
Kouzes, J., & Posner, B.Z. (2012). The leadership challenge (5th ed.). San Francisco, CA: Jossey-Bass
Leithwood, K., & Sun, J. (2012). The Nature and Effects of Transformational School Leadership: A Meta-Analytic Review of Unpublished Research. Educational Administration Quarterly, 48(3), 387-423. Doi 10.1177/0013161x11436268 Linarce, J.M. (2012). A user’s guide to Winsteps Ministeps Rasch-model computer
programs [version 3.74.0], Chicago IL: Winstep.com.
Lubke, G. H., & Muthén, B. O. (2004). Applying multigroup confirmatory factor models for continuous outcomes to Likert scale data complicates meaningful group comparisons. Structural Equation Modeling: A Multidisciplinary Journal, 11(4), 514-534.
Perera, C. J. (2015). Principal Leadership Practices and Teacher Collegiality in Malaysian High Performing Schools (Unpublished doctoral dissertation). University of Malaya, Kuala Lumpur, Malaysia.
Sinnema, C., Ludlow, L., & Robinson, V. (2016). Educational leadership effectiveness: a Rasch analysis. Journal of Educational Administration, 54(3), 305 - 339. Smith, W. Z. (2016). The Effects of Scaling on Trends of Development: Classical Test
Theory and Item Response Theory. (Master's Dissertation) University of Nebraska, Lincoln, United States.
Sumintono, B., & Widhiarso, W. (2014). Aplikasi model Rasch untuk penelitian ilmu-ilmu sosial (edisi revisi). Cimahi, Indonesia: Trim Komunikata Publishing House. (in Indonesian)
Van Sonderen, E., Sanderman, R., & Coyne, J. C. (2013). Ineffectiveness of Reverse Wording of Questionnaire Items: Let’s Learn from Cows in the Rain. PLoS ONE, 8(7), e68967. http://doi.org/10.1371/journal.pone.0068967
Vol. 2, No. 1, 21-38
36 Whittaker, T. A. & Worthington R. L. (2016). Item Response Theory in Scale
Development Research: A Critical Analysis. The Counselling Psychologist, 44(2), 216-225.
Zagorsek, H., Stough, S. J., & Jaklic, M. (2006). Analysis of the reliability of the leadership practices inventory in the item response theory framework. International Journal of Selection and Assessment, 14(2), 180-191.
APPENDIX A ITEM
NO. LPI (2012) PPQ
1 I set a personal example of what I expect of others.
I set a personal example of what I expect from the teachers.
2 I talk about future trends that will
influence how our work gets done --- Unchanged ----
3 I seek out challenging opportunities
that tests my own skills and abilities. --- Unchanged ---- 4 I develop cooperative relationships
among the people work with.
I do not support and encourage collaboration among teachers.
5 I praise people for a job well done. I praise teachers for a job well done.
6 I spend time and energy making certain that the people I work with adhere to the principles and standards we have agreed on.
I do not set aside time to
monitor teachers’
performance.
7 I describe a compelling image of what
our future could be like. --- Unchanged ---- 8 I challenge people to try out new and
innovative ways to do their work.
I challenge teachers to be creative and innovative in delivering their work responsibilities.
9 I actively listen to diverse points of view.
I listen actively to different views/opinions from teachers.
10 I make it a point to let people know about my confidence in their abilities.
I make it a point to let teachers know about their confidence in their abilities. 11 I follow through on the promises and
commitments that I make. --- Unchanged ----
12 I appeal to others to share an exciting dream of the future.
I seek cooperation from teachers in sharing their dreams of the future.
13 I search outside the formal boundaries of my organization for innovative ways to improve what we do.
I look for innovative ways to improve what teachers do.
Vol. 2, No. 1, 21-38
37 and respect.
15 I make sure that people are creatively rewarded to the success of our projects
I make sure that teachers are rewarded appropriately for their contributions to the success of projects.
16 I seek for feedback on how my actions affect other people’s performance.
I seek for feedback on how my actions affect teachers’
performance. 17 I show others how their long-term
interests can be realized by enlisting in a common vision.
I show teachers how their long-term interests can be achieved through a common vision.
18 I ask “What can we learn?” when things
do not go as expected. --- Unchanged ----
19 I support the decisions that people make on their own.
I support the decisions made by the teachers.
20 I publicly recognize people who exemplify commitment to shared values.
I recognize teachers publicly who exemplify commitment to shared values.
21 I build consensus around a common set of values for running our organization
I build consensus around a common set of values for running our school.
22 I paint the “big picture” of what we
aspire to accomplish. --- Unchanged ----
23 I make certain that we set achievable goals, make concrete plans and establish measurable milestones for the projects and programs that we work on.
I do not encourage teachers to set and achieve their goals.
24 I give people a great deal of freedom and choice in deciding how to do their work.
I give teachers a great deal of freedom in deciding how to do their work.
25 I find ways to celebrate
accomplishments. --- Unchanged ----
26 I am clear about my philosophy of leadership.
I am not clear about the philosophy of school leadership.
27 I speak with genuine conviction about the higher meaning and purpose of our work.
I do not motivate teachers to understand the impact of their teaching on student achievement.
28 I experiment and takes risks, even when
there is a chance of failure. --- Unchanged ---- 29 I ensure that people grow in their jobs
by learning new skills and developing themselves.
Vol. 2, No. 1, 21-38
38 30 I give the members of the team lots of
appreciation and support for their contributions.