comment
reviews
reports
deposited research
interactions
information
refereed research
Research
A basis for a visual language for describing, archiving and analyzing
functional models of complex biological systems
Daniel L Cook*
, Joel F Farley
and Stephen J Tapscott*
Addresses: *Division of Human Biology, Fred Hutchinson Cancer Research Center, Seattle, WA 98109-1024, USA. RainTown, 331 N 72nd St,
Seattle, WA 98103, USA.
Correspondence: Daniel L Cook. E-mail: [email protected]
Abstract
Background:We propose that a computerized, internet-based graphical description language for systems biology will be essential for describing, archiving and analyzing complex problems of biological function in health and disease.
Results:We outline here a conceptual basis for designing such a language and describe BioD, a prototype language that we have used to explore the utility and feasibility of this approach to functional biology. Using example models, we demonstrate that a rather limited lexicon of icons and arrows suffices to describe complex cell-biological systems as discrete models that can be posted and linked on the internet.
Conclusions: Given available computer and internet technology, BioD may be implemented as an extensible, multidisciplinary language that can be used to archive functional systems knowledge and be extended to support both qualitative and quantitative functional analysis.
Published: 22 March 2001
GenomeBiology2001, 2(4):research0012.1–0012.10
The electronic version of this article is the complete one and can be found online at http://genomebiology.com/2001/2/4/research/0012 © 2001 Cooket al., licensee BioMed Central Ltd
(Print ISSN 1465-6906; Online ISSN 1465-6914)
Received: 1 September 2000 Revised: 10 January 2001 Accepted: 7 February 2001
Background
Standard graphical representations of complex systems have been developed for many disciplines in order to communi-cate, archive and analyze systems knowledge. Electronic circuit diagrams and architectural plans, for instance, can be created, read and analyzed by knowledgeable persons, yet there is no such common graphical language for describing functional systems in biology. A variety of representations are used in print or online to archive knowledge in particular domains such as metabolic pathways [1,2], gene networks [3], signaling networks [4,5], and molecular interactions [6,7], yet are not sufficiently standardized to represent cross-disciplinary systems - the interactions of gene expression and metabolism at the inter- and intra-molecular levels, for instance. To describe such multidisciplinary biological prob-lems at multiple levels of abstraction (for example, from
intramolecular to disease phenotype), biologists customarily resort to informal cartoon diagrams which, although expres-sive, are often ambiguous and must be annotated to be inter-preted properly.
Results and discussion
Functional properties: a basis for a biological description language
If the goal were simply to standardize the graphics of cartoon diagrams, one could collect and standardize sets of icons and arrows for use as clip art in general-purpose graphics soft-ware or as templates in diagramming softsoft-ware such as Visio (Microsoft; for Windows) or TopDown (Kaetron Soft-ware; for MacOS and Windows). To build a sophisticated software editor for a visual language and, especially, to design the language to support computer archiving and analysis, one must, however, establish deeper foundations for creating, organizing and using graphic elements.
As a starting point, consider the common metaphor of bio-logical systems as circuits. Indeed, viewing metabolic path-ways as electrical circuits is particularly apt as, in each case, a limited set of entity classes (metabolites versus resistors, capacitors and inductors) are represented by icons that are linked by lines (or arrows) representing interactions between iconified entities. The benefit of such pathway and circuit diagrams is, of course, that they help us infer and track how a change in a state property (for example, metabolite concentration versus electrical voltage) of one icon acts via an action property (metabolic flux rate versus electrical current) on the state properties of linked icons. The problem for biologists is that metabolite concentrations and flux rates, while absolutely fundamental to many biolog-ical systems, are not the only functional properties that need to be considered.
Just as architectural plans must display and distinguish several interacting circuit systems with different properties (such as power, water, drainage, ventilation, telephone, security, and digital cable), diagrams of multidisciplinary biological systems must distinguish multiple functions (metabolic pathways, enzyme kinetics, ion fluxes, fluid flow) characterized by different properties (concentration, cat-alytic activity, voltage, pressure, respectively). Thus, the key challenge for describing, archiving and analyzing complex biological systems is not simply to collect expressive icons and arrows but to establish a system of expressive icons and arrows that consistently and unambiguously represents the functional entities and their specific functional properties. Does an arrow increase (or decrease) the concentration or the catalytic activity of an enzyme icon? Can we consistently represent the separate effects of transmembrane ion flow on both ion concentration and transmembrane voltage?
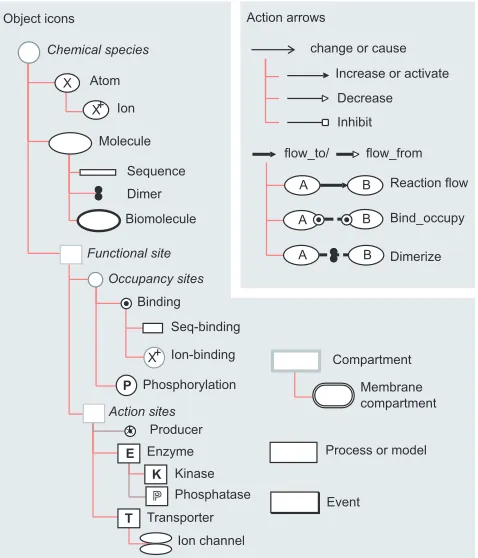
Whereas state and action properties are generally implicit in most diagrams, computer implementation of a visual lan-guage requires that lanlan-guage elements be formalized as com-putational objects in order to edit, archive and analyze models. To this end, we began designing BioD by creating building-block icons (Figure 1) that represent primitive func-tional entities such as atoms, molecules, compartments and
so on, where each icon is understood implicitly (as in meta-bolic pathway and electrical circuit diagrams), but specifi-cally, to possess one or more state properties. For instance, atom and molecule icons each have a concentration prop-erty. A compartment icon has volume and (surface) area properties. A membrane-bound compartment icon, derived from a simple compartment, is used to represent cells and organelles and inherits the compartments volume and area properties while including a (transmembrane) voltage property. In this manner, an extensible hierarchical lexicon of building-block icons can be built by deriving new icons from existing icons. Furthermore, additional state properties (such as temperature, ionic charge, isotopy, pressure) can be created and appended to new or existing icons as needed to create new functional entities; an ion icon is an atom icon with an ionic charge property, for instance.
[image:2.609.318.557.364.643.2]In addition to creating new icons by derivation, compound icons representing complex structures can be built by aggre-gating icons according to common-sense structural rules (for example, a molecular site, but not a cell, can be part of a molecule). In the examples below, a simple model of the
Figure 1
A basic lexicon of icons and arrows for describing the function of complex biological systems using BioD. Object icons are provided for common biological structures such as atoms, molecules, molecular sites and compartments, and for events and processes. ‘Action’ arrows represent the actions that the functional properties of one object can have on the functional properties of other objects and actions.
B A
K P
T E
Event Compartment
Membrane compartment Biomolecule
Dimer Ion
Binding
Phosphorylation
Enzyme Kinase
Transporter Ion-binding
A B
Bind_occupy Reaction flow
Dimerize
Occupancy sites
Functional site A B Sequence
Decrease change or cause
flow_to/ Atom
X X+
X+
Inhibit Molecule
Seq-binding
Producer
P
P Phosphatase
flow_from
Process or model
Ion channel
Action sites Chemical species
Action arrows Object icons
comment
reviews
reports
deposited research
interactions
information
refereed research
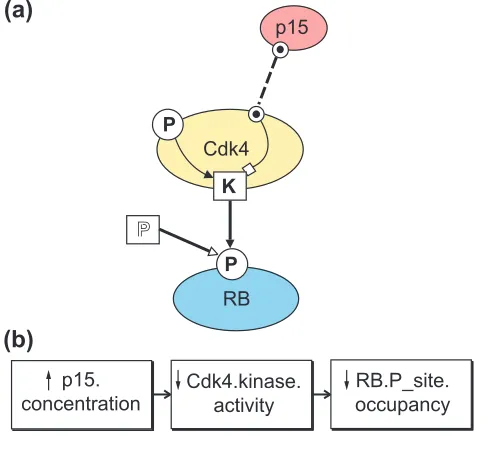
cell-cycle kinase Cdk4 begins as a molecule icon to which is appended a kinase site (a square with a K), a phosphoryla-tion site (a circle with a P) and a binding site (a small circle with a dot) (Figure 2a). As another example, the membrane-bound compartment representing a cell could contain other compartments representing internal organelles or even com-partments defined solely by diffusion-limitations (for example a submembrane compartment).
Functional interactions between building-block icons, whether aggregated as compound icons or not, are repre-sented by action arrows (Figure 1, upper right panel) that are designed to minimize the functional ambiguity of informal cartoon diagrams. It is required, for instance, that arrows consistently distinguish: which (if there is more than one) of an icons functional properties are affected either by context (as in cartoons) or by appearance (for example, double-weight arrows change concentration properties, by chemical reactions or transport, whereas single-weight arrows activate or inhibit activity properties); and how the property is affected (for example, filled heads mean increase, open
heads mean decrease). As for the lexicon of icons, the lexicon of action arrows in Figure 1 could be extended to include other forms to represent, say, thermal fluxes (which change temperature properties) and fluid flows (which change compartmental volume and pressure properties).
In the Cdk4 kinase model of Figure 2 we use single-weight arrows to represent how the activity of the kinase site is inhibited by occupancy of the p15 binding site and is acti-vated by occupancy of the phosphorylation site. A double-weight, solid-headed phosphorylate arrow represents the transfer of phosphate groups by the kinase site of Cdk4 to increase occupancy of the retinoblastoma protein (RB) phos-phorylation site. A phosphatase molecular site (a square with open-style P) represents how an unspecified phosphatase activity reduces the occupancy of the RB phosphorylation site. A dashed, double-weight occupy arrow represents the binding to and increased occupancy of p15 to its binding site on Cdk4. In this manner the diagram can represent both intra- and inter-molecular site-site interactions while distin-guishing activation/inhibition (as by conformational changes) from chemical reactions between species.
Consistent coding of qualitative effects as increase or decrease arrows allows qualitative what if experiments where an initiating event - an increase or decrease of a functional property of one icon, say - can be tracked through a model (or a network of models, see below) as a chain of events. Such events chains can be displayed in event dia-grams to represent some events (but not necessarily all events) as chains of event icons (each representing a change of a specific functional property) linked by cause arrows. For instance, the event diagram in Figure 2b displays the consequences (as events icons) of increasing the concentra-tion of p15 in the model in Figure 2a. In complex systems, such consistent qualitative representations can reveal previ-ously unappreciated causal links - redundant parallel path-ways or feedback loops - in models built solely from pairwise interactions of many functional parts.
As we will discuss below, formalizing a functional descriptive language for biology can offer additional benefits for explor-ing and understandexplor-ing the function of complex biological systems if the functional structures and processes can be adequately and unambiguously described.
Extending BioD to other domains
[image:3.609.53.297.354.579.2]A major criterion for the utility of any technical language is whether it can fully express concepts within a domain of knowledge; that is, is the language complete? For a domain such as biology which is almost limitless in terms of physical (not to mention psychic, social and evolutionary) phenomena, it is unlikely that any single language will suffice for all pur-poses - nor could such a language be proved complete by some inductive process. Rather, in our approach to designing and developing BioD, we have begun with basic cell-biological
Figure 2
(a)A simplified model of a Cdk4 kinase molecule illustrates how basic BioD icons and action arrows can concisely represent intra- and inter-molecular actions. The Cdk4 molecule includes a kinase site (K) that, when active, phosphorylates a phosphorylation site (P) on the RB protein. The kinase site on Cdk4 is activated (filled arrow) by occupancy of its phosphorylation site and inhibited (open-squared arrow) by occupancy of the binding site (dotted circle) that binds the Cdk4 inhibitor p15. (b)An ‘event model’ derived from the model above. Events are defined as changes of state of one or more functional properties of icons in a state model. Here, for instance, the event model displays a chain of events triggered by an increase of p15 concentration (see text).
p15
Cdk4
K
RB
P
P
P
P
Cdk4.kinase.
activity
p15.
concentration
RB.P_site.
occupancy
(a)
models as test beds for BioDs conceptual framework (that is, of functional properties, icons and arrows), its lexicon and its icon-arrow linking rules (tantamount to a graphical grammar). We have iteratively tested and modified the lan-guage to describe an expanding array of biological functions that now includes online models of: the cell-cycle G1/S check-point machinery as it may be controlled by ion channel activa-tion [8]; and the metabolic, signaling and neuronal pathways by which the ketogenic diet may affect seizure susceptibility [9]. In this early phase of design we expect modifications in basic as well as superficial features (as for any software design process), but we also expect that the basic precepts of the functional-property approach can be extended to other phe-nomenological domains such as fluid flow, heat exchange, neural circuitry, and so forth. To demonstrate the progress of language development within the cell-biological domain, we will describe and discuss the G1/S checkpoint control model.
Extending the lexicon to describe G1/S checkpoint machinery
With a few additional icons and arrows, the complex molec-ular signaling network that includes Cdk4 and controls the G1/S transition can be described compactly (Figure 3). First, a simple rectangle is used to represent a process that may be, but need not be, specified by a separate model (see below). Second, we use an arrow with a starred circle as a tail to mean produces to correspond to commonly used short-hand for saying that a commodity is produced where the specific mechanism of production is either unknown or not germane to the model. Figure 3 can then represent a very complex network of intramolecular and intermolecular actions controlling the G1/S cell-cycle transition [6,10-14], including Cdk2, cyclins A and E, the inhibitor proteins p21 and p27 and inputs from transforming growth factor->
(TGF->) stimulation and DNA damage processes.
Extensions for compartmental transport, gene expression and membrane biophysics
BioDs iconography can be extended to accommodate addi-tional cell-biological phenomena. For instance, the model of Figure 4 introduces membrane-bound compartments in order to model the dependence of the nuclear concentration of cyclin D1 on the complex kinetics of its synthesis, degra-dation and cytoplasmic-nuclear transport. The figure also introduces two derivatives of the molecule icon: a dimer icon (adapted from Kohn [6]) to represent dimers such as cyclin D1-Cdk4 and a biomolecule icon as a shorthand to represent catalytically active molecules with both concen-tration and activity properties (for example the kinases in the mitogen-to-ERK and -Akt kinase cascades). The dimer-ization action arrow (dashed, double-weight) is derived from the bind occupy arrow to link to species participating in the dimerization reaction.
To describe the possible effects of membrane potential and ion fluxes on cellular activity in Figure 5, we have introduced
an electrical voltage property (represented by the depol (depolarization) process icon) of membrane-bound com-partments and an ionic charge property used to derive ion icons from atom icons. Ion channel function is modeled as a transporter-derivative ion channel that is used to repre-sent the K+and Ca2+ion transport pathways as parts of
ATP-sensitive potassium channels (KATP) and calcium channels, respectively. A depol process icon is appended to the cyto-plasmic compartments membrane to represent how depo-larization is decreased by K+efflux, increased by Ca2+influx,
and further activates voltage-dependent Ca2+channels. With
these additions, we can represent the hypothetical action of K-channel blockers that bind to and inhibit ATP-sensitive potassium channels so that increased intracellular Ca2+
acti-vates intranuclear calmodulin.
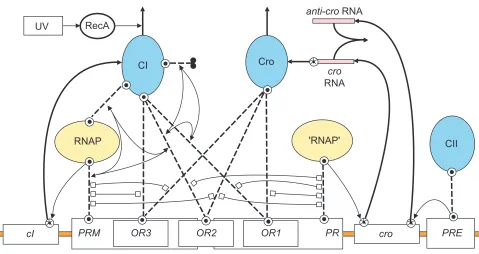
The lexicon and example models presented so far have focused primarily on cell signaling and transduction path-ways where intramolecular site-site interactions (for example conformational regulation of kinase activity) are prominent. However, intermolecular steric interactions figure just as prominently in gene-regulatory systems, as exemplified in the classic problem of the lysis-lysogeny genetic switch of lambda phage [15]. This system is modeled in Figure 6 to illustrate how activation and inhibition arrows can be adapted to represent both steric hindrance and mutual coop-erativity of binding. For instance, steric hindrance between the binding of the transcription factor Cro to its operator (Cro-OR1) and RNA polymerase (RNAP) to the promoter PR
(RNAP-PR) is represented by a double-headed inhibition arrow linking the respective binding-reaction arrows. The positive cooperativity of the binding reactions CI-OR2, RNAP-PRMand CI-RNAP is represented by three pairs of double-tailed activation arrows that each link two binding reactions to a third reaction that is enhanced by the two pre-vious binding events. The cooperativity being mutual, the three sets of double-headed arrows are superimposed to form a triangle of arrows linking the three binding arrows. Similar cooperativity in the formation of CI-CI and CI-OR1 bonds with the CI-OR2 bond further stabilizes the association of RNAP with PRM(see Figure 6 legend for further discussion).
the diagram. Even at this stage of development, BioD dia-grams created by these general graphic and diagramming tools can be readily imported to available web page design tools to create, edit, link and post models on the internet (see sample BioD model sites [8,9]).
Design considerations for a BioD editor
To fully realize the advantages of a standardized visual lan-guage, however, custom editors will be required for creating new icon and arrow objects, for maintaining icon and arrow
lexicons, and for creating and editing models. The key first step in developing editors (as well as archiving and analysis software, see below) is to develop standardized, platform-independent computer representations of core BioD language elements (functional properties, icons, arrows and models) in object-oriented programming (OOP) terms so that editors and browsers can be developed on a number of platforms.
In OOP parlance, for instance, BioD icons and arrow objects would know how to draw themselves, inherit functional
comment
reviews
reports
deposited research
interactions
information
[image:5.609.67.540.94.512.2]refereed research
Figure 3
A BioD model of structures and functional elements controlling the G1/S transition of the cell cycle [6,10-14]. Key molecular players are represented by binding sites, phosphorylation sites and kinase sites whose occupancies and activities interact to control the cell cycle. The critical synthesis and degradation kinetics of cyclin D1 are represented by an ‘identity’ link to the nuclear cyclin D1 icon in the ‘process’ modeled in Figure 4. Additional inputs to the model (TGF->stimulation and DNA damage) and outputs (G1/S transition) are included as unmodeled processes. CAK, cyclin-activating kinase; DP, DRTF1-polypeptide; DRTF, differentiation-regulated transcription factor; E2F, E2F transcription factor; TK, thymidine kinase; TS, thymidylate synthetase; POL, DNA polymerase.
E2F
DP
DNA
damage
TGF-
β
stimulation
cyclin D1
p15
p21
Cdk4
K
RB
P
P
P
P
Cdk2
K
P
P
cyclin E
p53
cyclin A
K
CAK
p27
DHFR
TK
TS
POL
G1/S transition
P
Fig4.nucleus.
cyclin D1
P
and graphical properties from parent icons and arrows, and know how to link to each other. The tasks of a BioD editor, as we envisage, would be to create icons and arrows, organize them into lexicons and palettes, and allow users to draw and link them into models. A particularly attractive, but consid-erably more sophisticated, feature would allow models to be built and formatted automatically according to pairwise functional interactions as available in metabolic pathway, gene network and protein interaction databases.
Model-model links for archiving and searching system models
A standardized biological description language that is for-malized in terms of computational and not just graphical objects offers two very attractive benefits. First, it would be possible to build models of very large systems by linking
individual submodels into distributed model networks on the internet. Second, it would be possible to treat such model networks as searchable archives of functional knowledge that can be queried for specific functional relationships.
The first possibility can be illustrated by linking models (see Figures 3-5) into networks using only two kinds of model-model links: action and identity links. Action links allow a functional property of an icon in one model to act on a func-tional property of an icon or action in another model, as if in a single model. For instance, an action link (iconified as a wall plug) allows the calcium-dependent activation of calmodulin in Figure 4 to inhibit the export of cyclin D1 from the nucleus in Figure 3. Identity links, on the other hand, allow models to share a common icon and its properties. For instance, an identity link (iconified as an = sign) establishes that the cyclin D1 concentration in Figure 2 represents the same cyclin D1 concentration as in the nucleus in Figure 3. Additional examples of model-model links can be seen in a network of models created to explain how the ketogenic diet might affect seizure activity [9].
[image:6.609.65.298.88.366.2]The second possibility is to establish online models as searchable archives of functional, as opposed to structural, relationships. Just as modern bioinformatics provides immense databases and search tools for molecular
Figure 5
A model of the activation of calmodulin (CaM) by calcium influx in which K-channel blockers [46-48] inhibit ATP-sensitive potassium channels (KATP) and thus cause membrane depolarization (depol). Membrane depolarization activates voltage-dependent calcium ‘ion channel’
transporters and Ca2+influx which have the dual effects of
increasing intracellular Ca2+concentration and further
increasing depolarization. The action of Ca2+-activated CaM
is linked via an action link (Fig4.nucleus.cyclinD1.export) to the inhibition of cyclin D1 export in Figure 4.
Cytoplasm
Nucleus
KATP
depol
CaMCa
Ca2+
Ca2+
K+
K+
CaM Ca
Ca2+
K channel blocker
Fig4.nucleus. cyclin D1 export
Figure 4
The activation of cyclin D1 gene expression by parallel Ras kinase cascades [44] modeled with BioD. Nuclear cyclin D1 levels depend on cytoplasmic-nuclear transport [45] and cytoplasmic degradation of cyclin D1 via an unmodeled ubiquitin proteolysis (‘Ub proteolysis’) process. The cyclin D1 icon in this model is identified with the cyclin D1 icon in Figure 3 using an identity link (Fig3.cyclin D1; which is reciprocal to the Fig4.nucleus.cyclin D1 link in Figure 3). The inhibition of nuclear export of cyclin D1 is inhibited by an ‘action’ link (Fig5.CaM.action) that allows activated
calmodulin (CaM) in the model of Figure 5 to reach into and affect this model. ERK, extracellular-regulated kinase; G3K3>, glycogen-3-synthase kinase-3>; MEK, MAP/ERK kinase; PI3K, phosphatidylinositol trisphosphate kinase.
Nucleus
G3K3β K
cyclin D1
Cdk4
cyclin D1
P
cyclin D1 gene
Ras
Raf PI3K
MEK
ERK Akt
Ub_proteolysis
Cytoplasm
Mitogen
Fig5.CaM.action PP
P P
P
Cdk4
Fig3.cyclin D1
cyclin D1 export
[image:6.609.317.551.91.289.2]structures and polymer sequences [16], we envisage that with suitable computational implementation, distributed online models may be queried not only for local pairwise interactions (such as site-site interactions) but also for long-distance chains of events (for example Find models where a potassium channel blocker affects cell-cycle progression), a capability not available in any other approach to biological systems. Implementing this capability would depend, first, on encoding and storing BioD language elements and models as objects in XML (Extensible Markup Language [17]). This is a standard language for describing and
exchanging information on the internet and is rapidly begin-ning to fulfill its promise [18] as a means of representing biological knowledge such as polymer sequences [19], cellu-lar and anatomical structures [20] and mathematical models of biological systems [21]. Second, to link model elements into distributed networks on the internet, XML-encoded BioD objects and models can be linked using XLink (XML Linking Language [22]) and queried for patterns of func-tional interactions using query languages such as Lore (Lightweight Object Repository [23]) that have been devel-oped for distributed, semistructured data.
comment
reviews
reports
deposited research
interactions
information
[image:7.609.64.543.98.352.2]refereed research
Figure 6
The use of ‘inhibit’ and ‘activate’ arrows to represent steric hindrance and cooperative binding reactions in a model of the lysis-lysogeny decision network of phage lambda [15]. A single-molecule icon is used to represent transcription factors that are actually homodimers of CI, Cro and CII. Key pathways for the synthesis and degradation of CI and Cro are as follows. Binding of RNA polymerase (RNAP) to the PRMpromoter activates production of CI via the cIgene. The binding of ‘RNAP’ (the quotation marks signify that the icon is a duplicate of the RNAP icon and is not a separate entity) to promoter PR
activates production of croRNA via the crogene. Binding of CII to promoter PREat the opposite end of the crogene activates production of antisense cro RNA (‘anti-cro’). croRNA required to produce Cro protein is degraded and removed from the system by a quenching reaction with anti-cro. The degradation of CI (the vertical reaction arrow at the top of the CI icon) depends on the proteolytic enzyme RecA, which is activated by ultraviolet light (UV). Cro degradation is unregulated, and CII degradation is not represented. The diagram is laid out to emphasize the symmetry between the CI and Cro synthesis and degradation pathways. The symmetry is broken, however, when one considers how competitive binding of the transcription factors (CI and Cro) to the operators (OR1, OR2and OR3) controls access of RNA polymerase to the back-to-back promoters PRMand PR. Transcription repression by CI and Cro is nearly symmetric as they each limit access (by steric hindrance; shown as double-headed ‘inhibit’ arrows) of RNA polymerase to the promoters. RNA polymerase access to PRis limited in four instances by CI or Cro binding to either OR1or OR2, whereas access to PRMis limited in three instances by Cro binding to either OR2or OR3, or by CI binding to OR3. The break in symmetry occurs because, rather than being repressive, CI binding to OR2actually enhances PRM transcription, which is stabilized in two ways. First, CI bound to OR3
directly binds RNA polymerase to stabilize its binding at its promoter site. Second, CI stabilizes its own binding to OR2by establishing a homodimerization bond (the dimerization arrow extending to the right of the CI icon) with a CI molecule bound to OR1. The result is two trimers (CI-gene-RNAP and CI-gene-CI) within which the ability of pairs of bonds to stabilize a third bond is indicated by a double-tailed activation arrow. As such bond stabilization is mutually cooperative, the three double-tailed arrows are superimposed to form the triadic arrows shown in the figure.
PRM
Cro
PR.. CI
UV RecA
OR3
cI OR2 OR1 cro
RNAP 'RNAP'
PRE
CII
anti-cro RNA
cro
Beyond description: model simulation and analysis
Visual languages in other fields [24,25] have been imple-mented as formal computer languages so that the diagrams are not only comprehensible to humans but can be analyzed by computers. This includes CAD systems for electronic circuit design and visual languages for computer program-ming (for example ProLog) as well as mathematical model-ing software that translates diagrams into mathematical equations for quantitative analysis. Indeed, visual lan-guages suitable for mathematical modeling in biology (for example Stella [26], SAAM II [27,28] and KineCyte [29,30]) have contributed to the establishment of quantita-tive modeling as a gold standard and critical element of biological analysis.
Despite the successes and value of quantitative analytical methods, it must be recognized that progress in the knowl-edge of biological systems proceeds largely on qualitative information and reasoning (A binds to B. If C increases then D decreases.) rather than quantitative analysis. This is due in large part to the huge range of experimental conditions and phenomena that are encountered and must be considered, and the great time, effort and expense required to generate consistent sets of quantitative system properties (concentra-tions, reaction rates and binding constants, for instance) many of which are experimentally inaccessible. In the face of such difficulties, biology, perhaps more than other disci-plines, consists of a vast amount of qualitative information that forms the basis for speculation, reasoning and decision-making at all levels from the basic science laboratory to the clinic. To exploit this reservoir of qualitative biological knowl-edge, a variety of qualitative and hybrid qualitative/quantita-tive simulation and analysis tools that have been developed in the artificial intelligence community [31-34] have been adapted to the analysis of biological problems [35-38].
The advantage of hybrid qualitative/quantitative methods with BioD is that they allow simulation and analysis of the behavior of complex systems at the prevailing level of systems knowledge; BioD models may be brainstormed in descriptive terms early in the discovery process and then upgraded in stages as qualitative information and then quantitative data become available. Model development and testing can, therefore, become an integral part of early dis-covery and hypothesis testing all within the context of a single graphical description, rather than developing models simply as validations of well understood phenomena. In effect, BioD models would fill the descriptive and analytical gap between informal cartoons and fully quantitative mathe-matical models.
To accomplish this, BioD object data structures would have to be extended to first represent functional properties and then provide action arrows with logical rules or mathemati-cal functions that determine how the states of linked icons affect each other. Within a BioD editor, such rules and
functions would be selectable in preprogrammed form from context-sensitive menus of appropriate and specific action arrows (a feature in KineCyte simulation software; Rain-Town [39]). Encoding BioD data structures in XML accord-ing to the Systems Biology Markup Language (SBML), a recently proposed open standard for exchanging mathe-matical models of biological systems [21], would allow BioD models to be exported and quantitatively simulated in a variety of analytical software platforms.
Dissociating the specification of functional properties and values from the graphical description of the model means that models can be created on a purely speculative basis, and then, as system knowledge matures, qualitative values and action rules can be selected (or specified) to support qualita-tive reasoning and hypothesis testing. As quantitaqualita-tive values and functions are warranted, they can then used to constrain the qualitative predictions of the model.
Discussion
We propose a conceptual basis for an extensible biological description language that is designed to be implemented as visual computer language for describing, archiving and ana-lyzing complex, multidisciplinary biological systems. We view this suggestion not as radical but as a natural, perhaps inevitable, extension to biomedicine of the visual computer language paradigm [24,25,40] that has been successfully applied in other technical disciplines. The major challenge is that biology offers perhaps some of the most complex and functionally diverse systems known.
The prototype language we present here is designed primar-ily for describing cell-biological systems as discrete networks of interacting functional objects at multiple conceptual levels. As such, it may prove cumbersome for describing massively parallel systems (such as the coupled expression of thousands of genes) or continuum systems (such as the wave propagation of cytoplasmic calcium). Even in these modeling domains, however, a standardized visual computa-tional interface would allow modelers to describe discrete parts (finite elements) of systems and/or to embed the systems in larger BioD models that both control and depend on the massive or continuum systems models.
How might BioD evolve and be extended from a core set of elements as described above to more general biological description language? In our approach, we have followed the model of recent developments of internet protocols, operat-ing systems and computer languages by envisionoperat-ing that if a core computational framework can be established, it can be extended and implemented for a variety of methods, lan-guages and operating systems. Thus we envision that, given the development of one (or more) editor applications, users could invent BioD language elements (functional properties, icons, arrows and models) as needed to describe specific domains. As domain lexicons and model-model networks expand, with inevitable conflicts and duplications, we would suggest more global standardization be negotiated according to open-source mechanisms of distributed, cooperative development [43] used for developing the Linux operating system and now being applied to SBML development [21].
By whatever mechanism, language development raises other key issues. How can one maintain the delicate balance of expressiveness and readability - can the language concisely describe all systems of interest while still being understand-able without extensive training? When does the ability to derive more expressive icons begin to diminish readability as viewers are required to recognize and interpret subtle differ-ences between similar icons? Even if successfully developed for selected domains and purposes, inevitably there will be edges to any language for describing all domains and for all analytical purposes - hence the continued appearance of new computer languages such as Java.
Conclusions
We have proposed that a generalized biological descriptive language akin to schematic diagramming languages in other disciplines is a necessary step in the evolution of functional bioinformatics. Toward this, we have developed a prototype language, BioD, that we have used to test the value of this approach and to explore the feasibility of computational implementation using object-oriented programming methods in the context of Internet-based communications. We suggest that a sufficiently formalized descriptive lan-guage built on the BioD concept of functional properties
can anchor a computational framework capable of support-ing the archivsupport-ing of extended, web-linked model networks and model analysis using hybrid qualitative reasoning and quantitative simulations.
Acknowledgements
We thank Jim Roberts, Dan Gottschling and Barbara Trask for helpful dis-cussion during the preparation of this manuscript.
References
1. Karp PD: Metabolic databases.Trends Biochem Sci 1998, 23:114-116.
2. From sequence to function. An introduction to the KEGG project[http://kegg.genome.ad.jp/kegg/kegg2.html]
3. McAdams HH, Shapiro L: Circuit simulation of genetic net-works.Science 1995, 269:650-656.
4. Takai-Igarashi T, Nadaoka Y, Kaminuma T: A database for cell sig-naling networks.J Comput Biol 1998, 5:747-754.
5. Transpath home page[http://193.175.244.148/index.html] 6. Kohn KW: Molecular interaction map of the mammalian cell
cycle control and DNA repair systems. Mol Biol Cell 1999, 10:2703-2734.
7. MODULES in extracellular proteins [http://www.bork.embl-heidelberg.de/Modules/extra.html]
8. BioD model of G1/S checkpoint machinery [http://www.rainbio.com/BioD_G1-S.html]
9. BioD model of the ketogenic diet and epilepsy [http://depts.washington.edu/perc/infoscientists/ketogenicdiet/ KD_Events.html]
10. Sherr CJ, Roberts JM: Inhibitors of mammalian G1 cyclin-dependent kinases.Genes Dev 1995, 9:1149-1163.
11. Harper JW, Elledge SJ: Cdk inhibitors in development and cancer.Curr Opin Genet Dev 1996, 6:56-64.
12. Sherr CJ: Cancer cell cycles.Science 1996, 274:1672-1677. 13. Kaldis P: The cdk-activating kinase (CAK): from yeast to
mammals.Cell Mol Life Sci 1999, 55:284-296.
14. Sherr CJ, Roberts JM: CDK inhibitors: positive and negative regulators of G1-phase progression.Genes Dev 1999, 13:1501-1512.
15. Ptashne M: A Genetic Switch. Cambridge, MA: Cell Press; 1992:20-28. 16. Gelbart WM: Databases in genomic research. Science 1998,
282:659-661.
17. Extensible Markup Language (XML) 1.0 (Second Edition) [http://www.w3.org/TR/REC-xml]
18. Mackenzie D: New language could meld the Web into a seamless database.Science 1998, 280:1840-1841.
19. Fenyo D: The Biopolymer Markup Language. Bioinformatics 1999, 15:339-340.
20. The Physiome Markup Languages [http://www.physiome.org.nz/]
21. Systems Biology Markup Language [SBML] [http://www.cds.caltech.edu/erato/index.html] 22. XML Linking Language (XLink) Version 1.0
[http://www.w3.org/TR/xlink/]
23. McHugh J, Abiteboul S, Goldman R, Quass D, Widom J: Lore: A database management system for semistructured data. SIGMOD Record 1997, 26:54-66.
24. Backlund B, Hagsand O, Pehrson B: Generation of visual lan-guage-oriented design environments. J Vis Lang Comput 1990, 1:333-354.
25. Meyers BA: Taxonomies of visual programming and program visualization.J Vis Lang Comput 1990, 1:97-123.
26. Hargrove JL, Hulsey MG, Summers AO: From genotype to phe-notype: computer-based modeling of gene expression with STELLA II.Biotechniques 1993, 15:1096-1101.
27. Barrett PH, Bell BM, Cobelli C, Golde H, Schumitzky A, Vicini P, Foster DM: SAAM II: Simulation, Analysis, and Modeling Software for tracer and pharmacokinetic studies.Metabolism 1998, 47:484-492.
28. Cobelli C, Foster DM: Compartmental models: theory and practice using the SAAM II software system.Adv Exp Med Biol 1998, 445:79-101.
comment
reviews
reports
deposited research
interactions
information
29. Cook DL, Atkins WM: Enhanced detoxification due to distrib-utive catalysis and toxic thresholds: A kinetic analysis. Bio-chemistry 1997, 36:10801-10806.
30. Cook DL, Gerber AN, Tapscott SJ: Modeling stochastic gene expression: implications for haploinsufficiency.Proc Natl Acad Sci USA 1998, 95:15641-15646.
31. Bonarini A, Maniezzo V: Integrating qualitative and quantita-tive modeling.Int J Expert Systems Res Appl 1991, 4:51-70. 32. Fishwick PA, Zeigler BP: Creating Qualitative and Combined Models with
Discrete Events. IEEE/Computer Society Press: Los Alamitos, CA, 1991.
33. Kuipers BJ: Reasoning with qualitative models.Artificial Intelli-gence 1993, 59:1-2.
34. Kuipers BJ, Shults B, Eds: Reasoning in Logic About Continuous Systems. San Francisco, CA: Morgan Kaufman Publ.; 1994.
35. Eisenberg M: The kineticist’s workbench: qualitative/quantita-tive simulation of chemical reaction mechanisms. Expert Systems Appl 1991, 3:367-377.
36. Ursino M, Avanzolini G, Barbini P: Qualitative simulation of dynamic physiological models using the KEE environment. Artificial Intelligence Med 1992, 4:53-73.
37. Tyson JJ, Novak B, Odell GM, Chen K, Thron CD: Chemical kinetic theory: understanding cell-cycle regulation. Trends Biochem Sci 1996, 21:89-96.
38. Thieffry D, Thomas R: Qualitative analysis of gene networks. Pac Symp Biocomput 1998, 77-88.
39. KineCyte™ biological systems simulator [http://www.rainbio.com/KineCyte.html]
40. Glasgow J, Narayanan NH, Chandrasekaran B, Eds: Diagrammatic Reasoning: Cognitive and Computational Perspectives. Cambridge, MA, The AAAI Press; 1995.
41. Corkill DD: Blackboard systems.AI Expert 1991, 6:40-47. 42. Buschmann F, Meunier R, Rohnert H, Sommerlad P, Stal M:
Pattern-Oriented Software Architecture; A System of Patterns.New York: John Wiley and Sons; 1996.
43. DiBona C, Ockman S, Stone M (eds): Open Sources: Voices from the Open Source Revolution. Sebastopol, CA: O’Reilly & Associates, Inc; 1999).
44. Gille H, Downward J: Multiple ras effector pathways con-tribute to G(1) cell cycle progression. J Biol Chem 1999, 274:22033-22040.
45. Diehl JA, Cheng M, Roussel MF, Sherr CJ: Glycogen synthase kinase-3beta regulates cyclin D1 proteolysis and subcellular localization.Genes Dev 1998, 12:3499-3511.
46. Woodfork KA, Wonderlin WF, Peterson VA, Strobl JS: Inhibition of ATP-sensitive potassium channels causes reversible cell-cycle arrest of human breast cancer cells in tissue culture.J Cell Physiol 1995, 162:163-171.
47. Heist EK, Schulman H: The role of Ca2+/calmodulin-dependent
protein kinases within the nucleus.Cell Calcium 1998, 23:103-114.
comment
reviews
reports
deposited research
interactions
information
refereed research
This article is reprinted from
Genome
Biology
Aims and Scope
Genome Biologyaims to serve the biological research community as an international forum, both in print and on the web, for the
dissemination, discussion and critical review of information about all areas of biology informed by genomic research. Subjects covered include any aspect of molecular, cellular, organismal or population biology studied from a genomic perspective, as well as genomics, proteomics, bioinformatics, genomic methods (including structure prediction), computational biology, sequence analy-sis (including large-scale and cross-genome analyses), comparative biology and evolution.
Publication of primary research on the web
Genome Biologyoffers a very fast publication schedule whilst maintaining rigorous peer-review. Contributors who are in doubt
about the suitability of their paper are welcome to send a presubmission enquiry. The editors will provide an initial response to all presubmission enquiries and submitted articles within one working day and will make every effort to give authors a decision following peer review within four weeks of an articles submission. Articles are published electronically as promptly as possible after they are accepted, and within one month of acceptance. The publication date of each article is the date of publication on the web. The full-length version of all research articles is available to individuals free of charge on the web.
Copyright, advertising and subscriptions
Genome Biologymakes no charge to individual authors or readers of primary research articles, and authors retain copyright of
their own articles (Genome Biologyretains the right to print and distribute articles). The costs of providing peer-review and
publishing primary papers is offset in part by the subscription fee charged for access to the review, comment and analysis services provide by Genome Biologyand in part by advertising. If an advertisement appears on this page, its subject should be
viewed as completely independent of the content of the article but it is, in part, helping to offset the cost of making primary research available free of charge.
For further information, please contact the editors: [email protected]
advertisement
?
How do you
keep informed
of the
latest innovations
in
RNA research
Ambion
’
s TechNotes Newsletters
With each FREE issue of Ambion’s TechNotes Newsletter you will receive:
• In-depth technical articles detailing current RNA technologies
• Information about innovative new products
• Answers to your questions about the isolation, detection and quantitation of RNA
• Research that investigates the dogma on which many protocols are based
Ambion
’
s RNA FlashNotes E-mail Newsletter
Sign up for RNA FlashNotes for the latest information about advances in RNA isolation, detection and quantitation. Once every three weeks Ambion, The RNA Company, will email information to you concerning the hottest technologies, the newest products and the most influential RNA based research to enable you to make informed decisions about your RNA
research methodologies. T H E R N A C O M PA N Y™
Sign up for your
FREE
subscription today by:
• Faxing this sheet to (512) 651-0201 or
• E-mailing your complete postal mailing address to [email protected] stating which newsletter you would like to subscribe to.
Name_____________________________________
Institution__________________________________
Dept______________________________________
Bldg/Room_________________________________
Street Address______________________________
__________________________________________
City/State__________________________________
ZIP______________Country__________________
O I would like a FREE subscription to RNA FlashNotes, Ambion’s e-mail newsletter.
![Figure 3A BioD model of structures and functional elements controlling the G1/S transition of the cell cycle [6,10-14]](https://thumb-us.123doks.com/thumbv2/123dok_us/8601209.864858/5.609.67.540.94.512/figure-biod-model-structures-functional-elements-controlling-transition.webp)
![Figure 4The activation of cyclin D1 gene expression by parallel Raskinase cascades [44] modeled with BioD](https://thumb-us.123doks.com/thumbv2/123dok_us/8601209.864858/6.609.65.298.88.366/figure-activation-cyclin-expression-parallel-raskinase-cascades-modeled.webp)