A Modified Redescriptive Data Mining Technique to
Relate Cyclones and Temperatures of Coastal AP, India
M. Kamala Kumari
Prof. P. Suresh Varma
Department of CS Department of CS
AKNU, Rajahmundry, India. AKNU, Rajahmundry, India
ABSTRACT
Redescription Mining, not a new problem describes set of objects or entities in at least two ways either with Boolean, Categorical or Real data. With the consideration of real valued data, the constraints that are applied with some range of values given more scope to the accuracy of redescriptions and that are to be statistically significant.
Considering Geographical area, pertained to some specific regions of Andhra Pradesh, India, in this paper we consider the Natural Hazards and the effect of Temperature on those areas that can describe the regions in two ways, either by the variations in temperature or by the effect and severity of natural hazards. An attempt is made in this paper, to show the correlation between frequency of Natural hazards and temperature increase in the coastal areas of Andhra Pradesh. The algorithm proposed works for real-data on either side of the description. Nine coastal districts of Andhra Pradesh are considered. Study on these districts shows how these districts are more vulnerable to Cyclones in specific, when compared to other districts. Experiments on this resulted in the redescription of coastal areas with temperature and cyclones.
Keywords
Redescription Mining, Natural Hazards, Coastal Andhra Pradesh, Data Mining.
1. INTRODUCTION
Whatever the domain we focus, there exists huge data associated with it. Mining is the activity of extracting the information hidden in the large database, but there also exists redundancies in describing that data. So we need to find that redundancy of description and if we identify at least two different types of description for the same set of entities then we call that as re-description. Finding multiple ways to characterize the same entities is a problem in today‟s science domains. In Science, related to Medicine, D. Kumar3[2007] said for example, we may typically want to find subset of patients with a combination of similar symptoms and related genes. As another example, according to Redescription Mining research of E.Galbrun4[2011], the bioclimatic constraint that must be met for a certain species to survive constitutes that species bioclimatic envelope.
In Geological Science, The Natural Hazards, NH are directly proportional to the temperature effect for some typical regions. Global warming is an issue for the fluctuations in temperature and NH, M.K.Kumari6[2012]. There exists a positive correlation between NHs and temperatures. Our analysis study has shown that there exists a positive correlation between the temperature increase and the
frequency of NH. We try to figure out the specifications in the temperatures and NHs by considering the real-valued data on both sides. Say for example, we can say that a specific area is re-described by stating thatthe area of South coastal region of Andhra Pradesh having Cyclones of winds ranging from 47m/s to 50m/s wind , is also the area with the average mean temperature of 420 Celsius to 470 Celsius during the months of May and June.
In our re-description mining, we consider the input containing regions described by two sets of characterizing variables. One set of variables contains Natural Hazards and the other set of variables contains temperature spread across the years. The task is to find a pair of queries whichreturns the same subset of entities where the queries contains the combination of variables of temperature and Natural Hazards and entities are nothing but the regions considered. We see that the set of entities are the same in both the domains.
Motivation:
Until now re-description mining algorithms are well implemented with Boolean data. Esther5[2011] Proposed Reremi algorithm which considers real-valued data. We have considered real valued data of temperature and intensity of Natural hazards. The constraints, Minimum threshold value for Jaccard Coefficient which measure similarity, independency of two random queries, number of entities in a redescription, Number of entities contributed by a variable, Number of variables in a query, Statistical significant of the queries and the type of the query are considered in this paper.
Andhra Pradesh and its Coastal Districts.
Andhra Pradesh is the 4th largest state in India by an area of 2,75,608 km2 and 5th largest population spread over 23 districts. Although it lies in the central part of the Peninsular Indian shield it has prone to many disasters. The state has a coastline of approximately 1030 km and an equal history of major Natural hazards like Cyclones, Earthquakes and Tsunamis. Coastline has a total of 9 districts and among them 2482 are villages.
Why we should relate Natural Hazards and Temperature:
Fig 1 shows the occurrences of Natural hazards illustrating the consequences of Temperature rise. Changes in climate affect not only average temperatures but also extreme temperature increases the likelihood of generating Natural Disasters.
Fig 1: Occurrences of hazards due to temperature
Climate change is predicted to have a range of serious consequences, some of which will have impact over the longer term, like spread of disease and sea level rise, while some have immediately obvious impacts, such as intense rain and flooding. While recognizing the importance of the other predicted consequences of Natural hazards, this paper focuses on identifying those areas which are affected by them due to rise of temperatures.
2. CYCLONES IN ANDHRA PRADESH
Andhra Pradesh is battered by every kind of natural disasters: Cyclones, Floods, Earthquakes and Droughts. The coastal region suffers repeated cyclones and floods. The 1977 cyclone and tidal wave, which resulted in great loss of life, attracted the attention of the central and state Governments of India and the international donor communities, as did those of 1979, 1990 and 1996. The floods in the Godavari and Krishna Rivers caused havoc in the East and West Godavari and Krishna districts. More than seventy cyclones have affected AP last century. According to Disaster Management Department, DMS Government of Andhra Pradesh, the history of 118 years Cyclones data from 1892 to 2010, shows 72 Cyclones which crossed Andhra Pradesh Coast have affected only all nine coastal districts. The incidence of cyclones seems to have increased in the past decades, to the extent that severe cyclones have become a common event occurring every two to three years, repeatedly and severely affecting the state's economy while challenging its financial and institutional resources. Almost 2.9 million people are vulnerable to cyclones and their effects in Coastal AP, 3.3 million of who belong to communities located within five km of the seashore. Recently, [11],Cyclone „Laila‟ in May 2010 is at an extreme with a death toll of 50 from coastal districts. Fig 2 (Obtained from The Hindu News paper dated: 18th May 2010) shows the „Laila‟ affected coastal districts of Andhra Pradesh. Very recently from October 28th 2012 to 31st Cyclone Nilam, the deadliest Cyclone since „Jal‟ in 2010 has affected more than 75 deaths(Only to castal districts of AP). Wind speed of this is 100 km/hour. Affected districts of
Nilam are Nellore, Chittor, Prakasam , Ongole, East Godavari and Visakhapatnam.
Fig 2: ‘Laila’ effected areas in Coastal AP, India
2.2 Effect of Temperature on Cyclones in
Coastal Andhra Pradesh
Andhra Pradesh is located at 12041' and 220N latitude and 770 and 84040'E longitude. Summers in Andhra Pradesh lasts from the month of March to June. A comparative temperatures with Rayalaseema, Telangana and Coastal districts shows coastal districts record more temperatures in May and June. Temperature generally ranges from 300 to 450C. Due to these higher temperatures, water at sea level increases. And hence, the higher sea temperature is the higher sea level. This sea level rise causes inundation of coastal habitats for humans as well as plants and animals and more powerful Cyclone surges that can devastate low-lying areas. According to weather experts, higher ocean temperatures cause more frequent and stronger Cyclones. United States Environmental Protection Agency, EPA states that, The Green house gasses stay in the atmosphere for hundreds of years and even if we stabilize this emission, the surface air temperature continue to warm. This is because the oceans which store the heat takes many decades to fully respond to higher green gas concentrations. The oceans response to these concentrations and higher temperature will continue to impact climate over the next several decades to hundreds of years. So we can derive the fact that the major temperature to an area especially the coastal one leads to climatic effects like Cyclones, Storms etc.,Fig 3 illustrates the said derivation.
Human activities Green gasses emission
Rise in Land temperatures Rise in sea temperatures
Rise in sea level Causes Natural Hazards
Fig 3: Cause for Natural Hazards
[image:2.595.60.277.118.316.2] [image:2.595.318.529.587.647.2]the places situated nearly at sea level record relatively large amount of variation in the daily pressure. Andhra Pradesh is the second largest state to be effected by the Cyclones. Andhra Pradesh has the longest coastline of all the states in the country. The 760km length along the sea has laid bare the state to the fury of cyclones that have been a regular feature in the Bay of Bengal. Fig 4 shows the number of Cyclones in
Fig 4 : Number of Cyclones in the Coastal districts of AP
Coastal districts of AP according to the data given by IMD. May month temperature variations, is shown in Fig 5 for the same districts during the same period. The data is obtained from Water Portal India and from that only May mean temperatures of the years from 1995 to 2002 is considered. There is significant direct relation between the effect of Temperatures and the origination of Cyclones on the Coastal Districts of Andhra Pradesh for the considered time period.
Fig 5: Average Temperatures for the May month
3. OUR APPROACH
Redescription Mining has been extended to consider categorical and real valued data. An algorithm has been constructed which computes the optimal discretization dynamically. We present experimental studies with synthetic data to verify that our algorithm returns good results. We also assess the significance of the results by testing them against different null models. Our Primary application of real valued redescription mining is identifying the regions in South Coastal Andhra Pradesh which are prone to Cyclones as well as heavy temperatures.
3.1 Notations and Definitions
For any object to describe, consider four different types of attributes. Boolean attributes, Real-valued attributes, Ordinal
attributes and Categorical attributes. Consider Boolean attributes and real valued attributes in experimentations. Two sets of attributes AL and AR are considered for two different domains. Redescriptors are framed over these two attributes. The set of entities, which are going to be described byAL and
AR is denoted by E. Represent the data using two matrices DCL and DTR. Both matrices have |E| rows and Di has |Vi| columns. The value of DCL(i, j) is the value of aj AL for ei E. If I is a set of row indices (or a characterizingvector thereof), D(i, j) is the column j of D restricted to the rows in I. The data is a 5-tuple D = (AL, AR, E, DCL,DTR). Identifyvariables in AL and
AR with the corresponding columns in DCL and DTR when
there is no risk of ambiguity.
Consider all four types of variables which are afore mentioned. If a A then we interpret the column corresponding it as the truth value assignment for e E normally, if it is real-valued and ordinal we consider an interval [a,b] and the truth value assignment induced by the relation a [a,b]. Special case can be when a is categorical. Then consider a = c for some category of c. These truth value assignments are denoted by notation [a <= a <=b] is the Boolean vector that has 1 in the rows where a [a,b], and 0 if not. [a=c] is defined analogously. The literals come out from these truth value assignments and their negations for attributes in A. Notice that there are infinitely many intervals yielding the same truth value assignment for some real-valued a A. To avoid ambiguity, consider only the shortest interval yielding some truth value assignment.
Literals are combined with Boolean operators (and),( or) and ¬ (negation). A Boolean formula is obtained by combining literals with Boolean operators in between. A query over A is a Boolean formula with literals of A. A redescription R of D = (AL; AR; E; DCL; DTR) is a pair of
queries (qL, qR) over AL and AR, respectively. For a
redescription R = (qL, qR), where qL is the boolean formula of left hand side data, i.e of one domain and qR is the boolean formula of right side data i.e., another domain data. Use AL(R) to denote the attributes of qL; AR(R) is defined
analogously. The support of a redescription R = (qL; qR),
suppD(qL; qR), is the intersection of supports of qL and qR,
supp(qL, qR) = supp(qL) /supp(qR). A redescription R =
(qL,qR) is exact if and only if supp(qL) = supp(qR). If a
redescription is notexact, it is approximate.The accuracy of a redescription R = (qL,qR) is measured using the Jaccard
Coefficient, J(R). | ) sup( | | ) sup( | | ) sup( ) sup( | ) ( ) ( , r l r l r l q q q q q q J R J
Formally, redescription mining is approached as follows: Given data D = (AL; AR; E; DCL; DTR) and a set of
constraints C, and all redescriptions R1,R2, ….of D that satisfy constraints in C. The constraints we took are as follows:
Accuracy which is based on given threshold value. Redescriptions should be statistically significant Adding a literal should give any new information The type of the query.
Size of the support of the redescritpion
Number of entities by which each variable contributes to it.
3.2. EREREDM Algorithm
A typical approach to mine such patterns is to first fix the intervals of the attributes we consider and then fix set theoretic expressions and then search in the space of possible instantiations.
Skeleton of the algorithm: We use an approach EReReDM analogous to ReReMi[4], to explore the solution space as well as to improve the efficiency. The algorithm starts redescriptions from singleton redescriptions to redescriptions with logical operators in between until the number of limited attributes in both the queries.
Algorithm EReReDM(D,R) I/P :
D = (AL, AR,E,DL,DR)
DL : = Left database, DR = Right database, AL = Attributes of DL, AR = Attributes of DR
rs= 0, positive integer to hold Initial Singleton redescriptions, ri = positive integer to hold Best Intermediate redescriptions for each iteration
C = Constraints on the Redescriptions to filter and for accuracy of the algorithm.
ηe= Number of entities involved in Redescriptions Ra = Number of attributes in each Redescription Jc = Threshold value for Jaccard Coefficient E = Total number of entities
I = Number to hold intermediate singleton redescriptions O/P: A set of Redescriptions, R
R ← φ; I = φ; m= rs
//Find out first best Initial Redescriptions for each aiAL
for each ajAR
if supp(ai,aj) >Jc
then I ← I (ai,aj) and rs ← rs +1 select best rs best redescriptions with the highest Jaccard
Coefficient order and leave the remaining.
I ← { rs best Singleton Redescriptions} for each of SI do
K ← {S}
// get free variables(not yet included in Redescriptions) to add to the obtained RDs FL(S) ← All left side variables in DL not in S FR(S) ← All right side variables in DR not in S If FL(S) ≠ 0 and FR(S) ≠ 0 then
ε ← {S} // Set of RDs to be extended during the // next iterations.
while ε ≠ 0 do for each Riε do
for side, s{left, right} and operator o{ } and lL FL(S) lR FR(S) do
If Ri can be extended on side s with o and l {FR(S),FL(S)} then
K ← K { Best such extension of Ri admitting constants C }
K ← bestof(K, ri)
ε ← { Ri K :FL(R) ≠ 0 and FR(R) ≠ 0 } // end of while loop
R ← R K
// check constraints on R Let Jc = Given threshold value Let PR = (| supp(qL)| |supp(qR)|) / |E|2
//Check the independency of two random queries, qL and qR in R using Poison distribution.
𝑝𝑣𝑎𝑙𝑀 𝑞𝐿, 𝑞𝑅 ≅ |𝐸| e− E ∗P
𝑆=|𝑠𝑢𝑝𝑝 𝑞𝐿,𝑞𝑅 | R ∗ (( 𝐸 ∗ (𝑃R))
S)/S!
If pvalM(qL,qR) > J then R can be discarded Let Ne = No: of entities in R(qL, qR)
If Ne< ηe then R can be discarded Return R
3.3 Framework of the algorithm
This algorithm is similar to Reremi algorithm[4] with extensions and changes to it. The outline of the algorithm follows the example given above. To find out the boundaries of the solution space we followed beam-search. Beam-search is heuristic search algorithm, that explores a graph by expanding the most promising node in a limited set. Here consider most promising queries starting from singleton queries and then expand them by adding most promising variables and logical operators in between. The queries are constructed bottom-up, starting from single variable on both sides of the queries. This is progressively expanded by appending appropriate operators and attributes. For example we could start with a pair (c, ¬t) as initial redescription and then extend this in turn as (ceq, ¬t) (ceq, ¬t) (c¬eq, ¬t) (c¬eq, ¬t),etc., After evaluating all possible one step extensions and satisfy Jaccard‟s threshold, we select the best candidates and extend them in turn.
The EReredm algorithm stores the two input data of two domains in the form of two matrices, DL and DR. Algorithm starts by storing null value in to the Redescription set R. As described above singleton redescriptions are first identified based on threshold value, Jc. We keep rs the most promising out of them. Let I, hold all these redescriptions to consider one after the other. Considering each one in toS, take FL as the free variables of DL except those that are in S. These free variables are added to the existing redescriptions to get full query. Similarly we do for the right hand side query by considering DR and free variables of it keeping in FR. As long as these sets are not empty, extend them by side,s either to the left or right and considering operators, o with the attribute,l either from FL or FR. This is appended to K. Again ε is updated with new Intermediate redescriptions, Ri. This process is repeated until ε is equal to empty. Bestof() is a function which will select only rs best redescriptions based on Jc.
Why Poison Distribution?
probability they have used binomial distribution. Here we have taken Poison distribution for probability. This is given by
pvalM(qL, qR) = 𝑒− 𝐸 ∗𝑃𝑟 𝐸 ∗(Pr ) 𝑆
𝑆! Eq (1)
where Pr = |supp(qL)| |supp(qR))| / |E|2.
The higher the p-value the more the queries are independent and less significant the query is. So for any two queries, qL and qR is p-value is larger, then that query combination is not used.
Poison distribution is widely used discrete probability distribution for the counts of events that occur randomly in a given interval of time or in a given space. We prefer this when N, Number of approaches is very large and probability of each approach will be of infinite. We also use Poison when the number of situations occur in which we observe the counts of events with in a set unit of time, area, volume, length etc.,Eg., Number of cases of a disease in different towns. In such situations we are interested in whether the events occur randomly in time or space or not. The probability of observing x events in a given time interval is given by an approximation of Poison distribution, where λ = n*p.
P(X=x) ≈ 𝑒−𝜆 𝜆𝑥! x=0,1,2,3… Eq (2)
Where X is the number of events in a given interval and λ is mean number of events per interval. If n is large and p is small then B(n,p) can be approximated with Po(λ).
If the exact distribution has too much of detail and if there are some features which are irrelevant(The ones which are not satisfying Jc) to the queries we want
.
So to approximate distribution, we focus on thethings that are really concerned with. Also a Poison random variable can take on any positiveinteger value, but in contrast a Binomial Distribution always has a finite upper limit.
Since Natural hazards data is considered with large range of values and each occurrence is of less probability we have chosen Poison distribution to be the best approximated value for the statistical significance of the query. This we have checked in the algorithm after Redescriptions are found and few of them will be removed which does not satisfy the constraint. Similarly, when appending an attribte,a to a Redescription.
3.4
Checking
Constraints
on
the
Redescriptions
For the efficiency improvement of the algorithm, we formulate some constraints and check the compatibility of redescriptions with them. As a preliminary constraint the check on is the accuracy constraint which will be obtained through threshold value for Jaccard coefficient. Basically Jaccard coefficient is used to find the accuracy of similarity between two entities.
4. EXPERIMENTATION
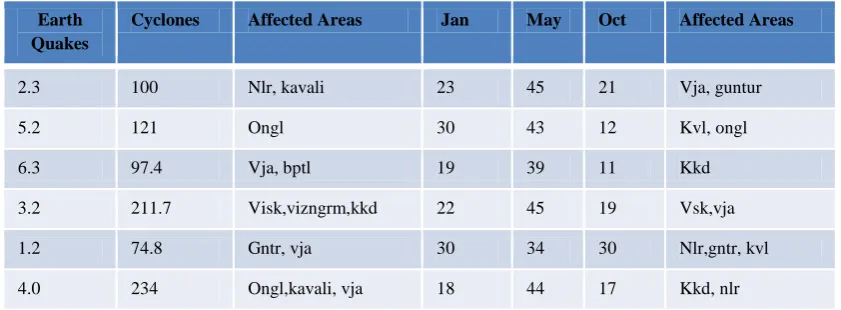
Table 1. Earth quakes, Cyclones and Temperature data
Earth Quakes
Cyclones Affected Areas Jan May Oct Affected Areas
2.3 100 Nlr, kavali 23 45 21 Vja, guntur
5.2 121 Ongl 30 43 12 Kvl, ongl
6.3 97.4 Vja, bptl 19 39 11 Kkd
3.2 211.7 Visk,vizngrm,kkd 22 45 19 Vsk,vja
1.2 74.8 Gntr, vja 30 34 30 Nlr,gntr, kvl
[image:6.595.81.502.108.263.2]4.0 234 Ongl,kavali, vja 18 44 17 Kkd, nlr
Table 2. Redescriptions for few areas of Coastal Andhra Pradesh
1.2 <= EQ <= 4.0
100 < Cycl < 211.7 { nlr, kvl, ongl, vsk, vja, kkd}19<= temp(Jan) < 23
temp(May) = 44 { kkd, vja, vsk, nlr}Here the four element set, {kkd, vja, vsk, nlr} can be redescribed with either of qL or qR with a strength , JC of 4/6 = 0.667
4.0 > EQ < 6.5
Cyc > 121 { ongl, vja, bptl, vsk, viziangrm, kkd, kvl}30= temp(Jan)
43 = temp(May)
30> temp(Oct) {nlr, gntr, kvl, ongl}Here the two element set {ongl, kvl} can be redescribed with either qL or qR but with a lesser strength of 2/4 = 0.25
2.0 >= EQ <= 3.2
Cyc >= 100 { vsk, viz, kkd, kvl, nlr} 22 > temp(Jan)
21 >= temp(Oct) { vja, gtr, kvl, ongl, nlr, kkd}5. CONCLUSION
A study has been done on the frequent occurrences of Cyclones and Earthquakes of Coastal districts of Andhra Pradesh, India. Similarly temperature levels are also observed for specific months for a period for the same areas. Causes for the temperature rise and also for Cyclones are mentioned clearly. For the first time redescription of Coastal Andhra Pradesh has been described in terms of the Cyclones, Earthquakes and temperature. A random data has been considered and experimented with the algorithm outlined and results are displayed. The effectiveness of the algorithm has been increased by using Poison Distribution instead of Binomial Distribution in measuring and checking constraints. Much contribution is confined to Cyclones and Temperature. A study on Earthquakes and Tsunamis of Coastal Andhra Pradesh has been done. Challenging task ahead is relating earthquakes and tsunamis with temperature. Earthquakes and Tsunamis which are related should also redescribe the targeted areas. A study on Earthquakes reveals that, it has a direct proportion with temperature below the earth‟s surface. Temperature at a down-going slab, at a subduction zone when penetrates, rocks under this slab hotter than the incoming temperature are too ductile to generate Earthquakes. Also, due to the severe rise in temperature levels at mountain areas and near north poles, which causes glaciers to melt, will generate earthquakes. On the other side, there is an ambiguity to relate temperature and earthquakes according to few researchers and geologists. A detailed and analyzed study may lead to a corner. Similarly tsunamis are on the same path to relate with temperatures. But earthquakes and tsunamis recount on one side if we see the affected areas.
6. ACKNOWLEDGMENTS
Our thanks to our colleague Dr. Swamy, Geological department, from our University who has contributed geological data for our experimentation. We also thank team of India Water portal for maintaining the monthly wise temperature data. Our sincere thanks to IMD who has
sufficient and necessary data of Cyclones in their Website which has made our work to go insight.
7. REFERENCES
[1] A. Gallo., P. Miettinen, and H. Mannila. 2008. Finding subgroups having several descriptions: Algorithms for redescription mining. In SDM, pages 334–345.
[2] B. Mcguire, April 2010 Potential for a hazardous geospheric response to projected future climat changes Published 19 doi:10.1098/rsta.2010.0080Phil. Trans. R. Soc.
[3] D. Kumar, 2007. Redescription mining: Algorithms and applications in bioinformatics. Ph.D thesis, Department of Computer Science, Virginia Tech.
[4] E. Galbrun and P. Miettine , 2011. From Black and White to Full Colour: Extending Redescription Mining Outside the Boolean World. In SDM, pages 546–557.
[5] M.K. Kumari, P. Suresh Varma, Aug 2012. Redescription Mining with Three Primary Data Mining Functionalities. IJCSIT vol 4. pages 64-69.
[6] M.K. Kumari, P. Suresh Varma and A. Praveen., 2012. Redescription Mining with Geological data. In the proceedings of ACC. July 26-28 pp 158-163.
[7]. Mohammed J. Zaki et al, 2005, “Reasoning about Sets using Redescription Mining” KDD’05, August 21–24, Chicago, Illinois, USA.
[8] M. Usman et al, 2011, Effects of Temperature Increase on Earthquake Frequency and Depth in Northern Pakisthan, 2010 International Conference on Biology, Environment and Chemistry, IPCBEE vol 1.
[9]. Philip N S and Joseph K B, 2001. On the Predictability of Rainfall in Kerala: An Application of ABF Neural Network, In Proceedings of Workshop on Intelligent Systems Design and Applications (ISDA).