Modeling and Performance Evaluation of Dual Polarized
MIMO Land Mobile Satellite Channels
Gamal Mabrouk
Abdelhamid
Military Technical Collage
Gamal Hamad
Military Technical Collage
Yasser Kamel Badran
Military Technical Collage
ABSTRACT
The paper is concerned with generating of narrow-band dual polarized Multi Input Multi Output (MIMO) over land Mobile Satellite (LMS) fading channels. In the absence of accurate experimental results of MIMO-LMS channels, a statistical model for the characterization of MIMO-LMS is proposed based on available experimental results for Single Input Single output (SISO) LMS and MIMO wireless channels as well as on their extrapolation to the MIMO-LMS case of interest. In this paper a step-by-step methodology for transforming SISO model (Loo model) to MIMO model with detailed description and block diagrams for the simulation and time series signal generation for MIMO-LMS, with the desired power, probability distribution, covariance relations and spectrum. Moreover, based on the proposed channel model, the channel capacity statistics as well as the error performance of MIMO-LMS are evaluated through computer simulation. Useful numerical results on the capacity are also provided taking into account several operational system parameters. The simulation model and results are useful for LMS-MIMO physical layer researches and system designer, who need an easy to implement and realizable model, representative of typical MIMO-LMS communication systems.
Keywords
Fading channels, land mobile satellite (LMS), multiple-input multiple-output (MIMO), polarization diversity statistical modeling.
1.
INTRODUCTION
Multiple-Input-Multiple Output (MIMO) channels are an abstract and general way to model many different communication systems of diverse physical nature, ranging from wireless multi-antenna channels, to wire line digital subscriber line (DSL) systems, and to single-antenna frequency-selective. In particular, wireless MIMO channels have been recently attracting a great interest since they provide significant improvement in terms of spectral efficiency and reliability with respect single-input-single output (SISO). Larger capacity is obtained via the potential decorrelation between the channel coefficients of the multiple-input-multiple–output (MIMO) radio channel, which can be exploited to create several parallel sub-channels. However, the potential capacity gain is highly dependent on the multipath richness, since a fully correlated MIMO channel only offers one sub-channel, while a completely decorrelated radio channel potential offers multiple sub-channels depending on the antenna configuration [1].The appealing gains obtained by MIMO techniques in terrestrial networks [2], generate further interested in investigating the applicability of the same principle in satellite networks [3]. However, the fundamental difference between the terrestrial and satellite channels make such applicability a nontrivial and non-straightforward task. These differences are mainly related to the line-of-sight (LOS)
operation of satellite links and to the absence of scatters in the vicinity of the satellite, which eliminate multipath fading profiles over the space segment and lead to an inherent rank deficiency of the MIMO channel matrix. A possible solution to form a MIMO matrix channel in a satellite environment is the polarization diversity.
The present work focuses on the modeling of dual-polarized MIMO LMS channels and proposes a statistical model for their characterization. A useful methodology for simulation and time-series generation of such MIMO-LMS channel is also provided, which facilitates the design and end-to-end performance assessment of MIMO-LMS transmission systems. On the related (previous) work, statistical models for narrowband and wideband dual-polarized MIMO-LMS channels are presented in [4-8], respectively but most of them its time series generation can obtained in terms of time consuming and complex simulation but in this paper we introduce a new simple method to generate the channel coefficient for dual polarized MIMO-LMS channels parameters, based on available experimental results for Single Input Single output (SISO) LMS and MIMO wireless channels as well as on their extrapolation to the MIMO-LMS case of interest. In this paper a step-by-step methodology for transforming SISO model (Loo model) to MIMO model with detailed description and block diagrams for the simulation and time series signal generation for MIMO-LMS, with the desired power, probability distribution, covariance relations and spectrum. Moreover, based on the proposed channel model, the channel capacity statistics as well as the error performance of MIMO-LMS are evaluated through computer simulation. Useful numerical results on the capacity are also provided taking into account several operational system parameters.
This paper presents the basic concept for transforming SISO models to MIMO models in order to make benefit from the numerous SISO models and experimental results, and also it introduces the idea for simulating the low earth orbit (LEO) LMS channel. The paper is organized as follows: Section I introduce the paper. Section II describes the procedures of converting SISO-LMS statistical model to dual-polarized MIMO-LMS statistical model and section III describes the detailed steps for the channel matrix generation, while section IV provides the simulation results section V gives the performance evaluation of dual polarized MIMO land mobile satellite channels and section VI concludes the paper.
2.
CONVERTING SISO-LMS
STATISTICAL MODEL TO
DUAL-POLARIZED MIMO-LMS
STATISTICAL MODEL
2.1
SISO-LMS Channel Statistical Model
multipath component , the amplitude of the direct component is log-normally distributed with mean (decibel relative to LOS) and standard deviation (dB)and the amplitude of the multipath component is Rayleigh distributed with average power (decibel relative to LOS), where the Loo statistical ( ) are triple parameter experimental dataset which is first presented in [4].
(1)
The multipath channel can be simulated by generating two independent identically distributed(i.i.d) Gaussian random variables each with zero mean and variance and adding them in Quadrature, this will give rise to complex Gaussian random variable with Rayleigh amplitude and uniform phase over , the value of can be calculated according to the multipath signal power parameter from the relation
(2)
Where: is the parameter expressed in linear scale not db. While the direct component can be simulated by generating a Gaussian random variable (x) with dB mean and standard deviation respectively, then converting it to a log-normal random variable (y) by applying the following transformation
(3)
The random variable is log-normally distributed and therefore it can be used to represent , to form the complex direct LOS channel the random variable had to be multiplied with the phase of the direct signal which can be considered as the phase shift resulting from the change in distance between the satellite and mobile station (MS) [12].
2.2
Procedure for Converting SISO
Statistical Models to Dual Polarized
MIMO Models
The main idea is to generate the complex MIMO channel matrix ( ) from 4 SISO sub-channels (2 co-polar and 2 cross-polar) will be denoted by where
(i, j =1, 2.)
Each of these 4channels will be generated with parameters ( ) which are driven from the original SISO
tabulated Loo statistical parameters ( ),the relation between the old and new parameters will be calculated such that the MIMO sub-channels will satisfy the following power conditions:
The total power of the 4 sub-channels must be normalized.
The power ratio between the co-polar channels and the cross-polar channels must satisfy the cross polarization discrimination (XPD) relations.
After generating the 4 channel with the appropriate power relations, the covariance relations will be added to them according to the measured covariance relations values.
The following section will describe these procedures.
3.
CHANNEL MATRIX GENERATION
3.1
The Power Normalization
For the SISO channel, since is Rayleigh distributed then the power of the multipath channel is given by
(4)
and since is log-normally distributed then the power of the direct LOS channel is given by
(5)
For the MIMO channel normalization will consider that the total power coming from each transmitter equals to the power of the SISO channel which means that:
(7)
3.2
The XPD effect
Due to the effect of the cross polarization discrimination of the multipath signal ( ) the sub-channels must satisfy the following equation:
Where is expressed in linear scale not in dB and it is not related only to the antenna but also to the environment [1& 6].
From (6) and (8) we can get that
While the direct channel cross polarization discrimination ( ) depends on the antenna only and it is given as
From (7) (11) we can get that
Applying straight forward algebra it can be shown that to satisfy the equality on (12) and can be calculated as
The 4 MIMO sub-channels needs 12 zero mean, unite variance random Gaussian generators, 8generators are used to form the 4 complex Gaussian channel elements of the multipath channel matrix and 4 generators are used to form the4 Gaussian channel elements of the direct channel matrix ,the suffix w stands for white since the elements of these matrices are i.i.d. The next steps will describe the procedure used in generating the direct LOS channel matrix and multipath complex channel matrix by adding the appropriate power properties and covariance relations to .
3.3
The Correlated Multipath Channel
Matrix Generation
Figure1: The Multipath signal channel block
Due to the angular spread of the multipath components and the co-location of multiple antenna elements at the satellite and mobile station the multipath fading components suffer from polarization correlation. In order to obtain a correlated complex Gaussian matrix that have a convenience matrix , this can be done by first generating a 2x2 matrix with i.i.d. zero mean and unite variance complex Gaussian elements and then apply the following equation to form the correlation relations between the channel elements
The multipath channels could be considered separable and according to the Kronecker model which was first presented in [7&8] we can find by knowing the transmit and receive covariance matrices respectively from the following equation
Where denotes the Kronecker product operator, each of
is a 2x2 positive semi-definite Hermitian matrix.
Typical values of transmit and receive polarization correlation coefficient respectively are obtained from intense
experimental results and can be found in [2, 9, 10].
In order to obtain the desired power properties of the channel as described in equation 3and 4, we can redefine equation 6 to be
Where T matrix is given as
and (i,j =1,2 ) can be obtained from equation 9. The whole procedure is described in figure 1.
3.4
The Correlated Direct Signal
Channel Matrix Generation
In the case of the LMS the small distance between each of the two antennas on the satellite with each other and the two antennas on the land with each other leads to high correlation values between the elements of the direct channel matrix. In order to obtain the correlated log-normal distribution , matrix we first generate a 2x2 w matrix with i.i.d. zero mean and unite variance Gaussian elements then change it to a correlated Gaussian matrix ,and multiply it with the 4x4 direct
channel covariance matrix according to the following equation:
The value of the matrix depends on the type of environment and can be found in [2] based on extensive experimental results. After that change to a correlated lognormal
matrix with the wanted and normalization parameters by applying the following equation:
Where G is a 1x4 matrix defined as
and values are obtained from equation 13.
The matrix obtained from equation 12 is then changed to a complex by multiplying it with the phase shift according to
(20)
[image:3.595.318.548.632.726.2]Where , and is the change in the distance between the satellite and the MS. The whole procedure is described in figure 2.
3.5
Enhancing the Model using the
Markov Chain
The Markov chain is used to add the effect of the different shadowing conditions that the MS will suffer from during its movement (e.g., if the MS goes from clear LOS to behind a tree or a building) each of these shadowing can are simulated using three states Markov chain that represents three different shadowing conditions as following
State 1: line of sight (LOS) conditions
State 2: moderate fading conditions
State 3: deep fading conditions
The three states Markov chain is described by 3x1 state probability matrix W and 3x3 state transition probability matrix P, the W and P matrixes are calculated for each shadowing condition from intense measurements and tabulated according to the antenna type, the environment, the used frequency and the satellite elevation angle. Each state from these three states is corresponding to a different value of the Loo statistical triplet ( ) tables, for w and p matrices and for the equivalent Loo parameters for each shadowing condition can be found in [4&5].
[image:4.595.54.283.354.536.2]3.6
Triggering and filtering
Figure 3: Block diagram for the GEO satellite MIMO channel model
The model combines three rates of variations as following, The Markov chain rate which is characterized the minimum state length that represents the minimum traveled distance for
any state to be changed; while modeling the Markov chain a new state should be drawn randomly every time the mobile travels a distance ( 3–5 m was observed in the
analysis of a large experimental S-Band data set) [6].The multipath block engine will generate the samples with spacing
not more than , and this value could be decreased according to the purpose of the simulation[12]. The samples will then be filtered using a Butterworth filter in order to reshape its spectrum and reduce its maximum frequency to the maximum Doppler spread frequency as shown in figure 1. The direct signal block must have the same as the multipath block (since they will be added together), the direct signal variations are characterized by the correlation distance , which is greater than in order to force the direct signal to have a correlation distance equals to , the samples will
go throw first order recursive linear time-invariant digital filter [12] with the following difference equation
(21)
Where , the filtered samples are then
multiplied by in order to restore the original mean and variance of the samples before the filtering as shown in figure 2. The whole model is described in figure 3.
3.7
Adding the Effect for Low Earth
Orbit Satellite to the Simulation
The main difference between LEO satellites and the Geostationary GEO satellites is that the LEO satellite elevation and distance from the mobile station (d) is always changing during the communication session, the change in the distance
leads to changes in the received power and phase of the received signal while the change in the in the elevation leads to changes in the probability of being in a line of site LOS or shadowed condition which is described by Markov chain, another main different is that the communication link may be handed over from one satellite to another during the same communication session. The values of the Loo parameters ( ) are normalized for each elevation separately with respect to the LOS signal, the effect of the power changes due to is simulated by adding a dB value to the decibel sum of the direct LOS channel and the multipath channel, in order to calculate we will assume that the channel is normalized at a certain distance , which means that when the satellite is at this distance =0 and if it is at a distance greater than then will be negative and vice versa, can be calculated from the next formula
(22)
The Markov chain and the Loo statistical parameters tables are categorized according to the satellite elevation angle (every ), to add the effect of the change in elevation angle the values of the Markov P and W matrixes and the values of the Loo statistical parameters have to be cheeked and updated whenever the value of the modeled satellite elevation angle
reaches the range of the elevation angle of new category in the tables [4]. The Equations used to calculate the values of and depending on the satellite orbital parameters and the MS latitude and longitude can be found in [11]. The block diagram in figure 3 can be modified to add the effect of the LEO satellites as illustrated in figure 4.
[image:4.595.311.540.561.726.2]4.
THE SIMULATION RESULTS
This section presents the simulated model output for the parameters in table I.
The lower part of Figure 5 represents the simulated time-series of the model output while in the upper part of the figure the equivalent Markov states are plotted to illustrate the effect of the different states on the signal power and variations
Figure 5: Simulated time-series signal and the different Markov states
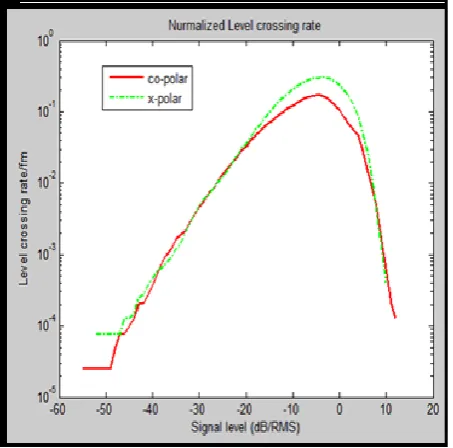
[image:5.595.324.540.84.306.2]Figure 6 shows the normalized average fade duration and Figure 7 shows the level of crossing rate with respect to the maximum Doppler spread frequency for the simulated co-polar sub-channels and cross-polar sub-channels, while Figure 8 shows the Ergodic capacity versus SNR achieved through Monte Carlo simulation for different cross polarization discrimination XPD in open area environment, the figure shows that by increasing the antenna XPD improves the dual polarized MIMO capacity.
[image:5.595.50.275.132.341.2]Figure 6: Normalized average fade duration
Figure 7: Normalized level of crossing rate
Figure 8 shows the Ergodic capacity versus SNR achieved through Monte Carlo simulation for different cross polarization discrimination XPD in open area environment, the figure shows that increasing the antenna XPD improves the expected dual polarized MIMO capacity.
Table 1: The parameters used in the model
Parameter value
Operating frequency 2.2GHz
MS speed 50km/h
Satellite orbit LEO
Satellite elevation 60
Environment type urban
15 dB
4.629 dB
0.5 , 0.5
[image:5.595.315.542.359.583.2] [image:5.595.54.282.421.618.2]
5.
PERFORMANCE EVALUATION
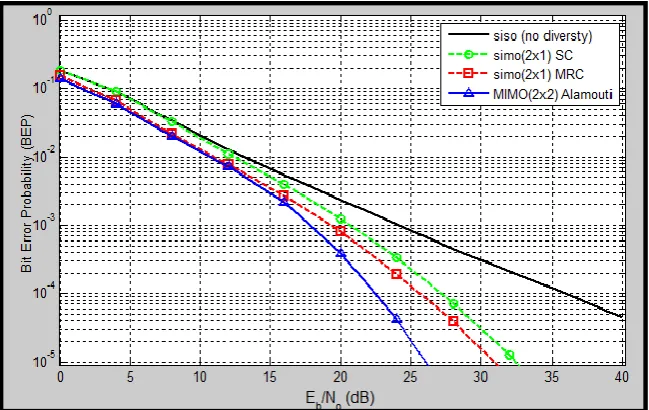
Based on the presented channel model, the error performance of SIMO and MIMO LMS for QPSK modulated system was estimated and presented in this section. According to [13] the bit error probability BEP for 2x1 receive diversity SIMO system can be calculated for each channel realization for both maximal ratio combining (MRC) and selection combining (SC) systems according to the following equations
Where: is the complementary error function, is the energy per bit and is the noise power spectral density.The
gain of 2x2 dual polarized MIMO systems in the case of coherent QPSK modulation can be achieved using Space-Time Block Code. The
[image:6.595.88.529.65.286.2]MIMO BEP was calculated for a system using Alamouti Code after halving the transmitter power so that the total transmitted power will be identical with that of the SIMO and SISO systems for a fare comparison.
Figure 9 compares the error performance of QPSK modulation in sub-urban environment for four different LMS systems (dual polarized 2x2 MIMO using Alamouti Code, 2x1 dual polarized receive diversity SIMO using MRC, 2x1 dual polarized receive diversity SIMO using SC and SISO system without any diversity) and it is clear that the MRC performance is better than that of the SC while the best performance is achieved by using the 2x2 Alamouti coded MIMO system, it can be seen that the Alamouti coded 2x2 MIMO achieves about 13 dB gain over the uncoded SISO at BEP level .
Figure 8:.Ergodic capacity versus SNR in open area environment for different antenna XPD.
[image:6.595.110.435.525.730.2]6.
CONCLUSION
This paper presented a statistical channel model for simulating dual-polarized MIMO-LMS channel and introduces detailed block diagrams and procedures for this simulation, all the values and the filters used in this model can easily be modified for further tuning to adapted the model to simulate deferent satellite scenarios, environmental conditions and Antenna types, this simulation can be useful in designing the dual-polarized MIMO systems over LMS and on investigating its gain. Moreover, based on the proposed channel model, the channel capacity statistics as well as the error performance of a SIMO-LMS diversity system, assuming both maximal ratio combining (MRC)and selection combining (SC), and MIMO-LMS using Space-Time Block Code are evaluated through detailed computer simulations. Useful numerical results on the capacity and diversity gains achieved are also provided taking into account several critical operational system parameters.
7.
REFERENCES
[1] Konstantinos P. Liolis, "Statistical Modeling of Dual-Polarized MIMO Land Mobile Satellite Channels", IEEE transactions on communications, Vol. 58, No. 11, November 2010.
[2] P. King, “Modeling and measurement of the land mobile satellite MIMO radio propagation channel", Ph.D. dissertation, University of Surrey, U.K, June 2007.
[3] P. King and S. Stavrou, “Low elevation wideband land mobile satellite MIMO channel characteristics". IEEE Trans. Wireless Comm., vol. 6, no. 7, pp. 2712-2720, July 2007.
[4] FF. P. Fontán, M.-A. V. Castro, C. E. Cabado, J. P. García, and E. Kubista, “Statistical modeling of the LMS channel", IEEE Trans. Veh. Technol., vol. 50, no. 6, pp. 1549-1567, Nov. 2001.
[5] R. P. Cerdeira, F. Pérez Fontán, P. Burzigotti, A. Bolea Alamañac, and I. Sanchez Lago, “Versatile two-state land mobile satellite channel modelwith first application to DVB-SH analysis", Int. J. Satell. Comm.Netw., DOI: 10.1002/sat.964, 2010.
[6] Loo, C., “A statistical model for a land mobile satellite link”, IEEE Transactions on Vehicular Technology, vol. 34, no.3, Aug.1985, pp.122-127.
[7] C.N. Chuah, J.M. Kahn, and D. Tse., "Capacity of multi-antenna arraysystems in indoor wireless environment", In Proc. Globecom 1998 – IEEE Global telecommunications Conf., volume 4, pages 1894–1899, Sydney, Australia, 1998.
[8] D.S. Shiu, G.J. Foschini, M.J. Gans, and J.M. Kahn., "Fading correlation and its effect on the capacity of multielement antenna systems", IEEE Trans. Commun., 48(3):502–513, March 2000.
[9] M. Sellathurai, P. Guinand, and J. Lodge, “Space-time coding in mobilesatellite communications using dual-polarized channels", IEEE Trans.Veh. Technol., vol. 55, no. 2, Jan. 2006.
[10] J. Lempiäinen and J. Laiho-Steffens, “The performance of polarizationdiversity schemes at a base station in small/micro cell at 1800 MHz", IEEE Trans. Veh. Technol., vol. 47, no. 3, Aug. 1998.
[11] Dennis Roddy “Satellite Communications Fourth Edition”, McGraw-Hill,1989.
[12] F. Pérez Fontán and P. MariñoEspiñeira, “Modeling the Wireless Propagation Channel: A simulation approach with Matlab”, John Wiley & Sons, 2008.