A Survey on Various Classification Techniques for
Medical Image Data
Niranjan J. Chatap
M. Tech Scholar,Dept. of Computer Science Engineering, NIIST Bhopal, India
Ashish Kr. Shrivastava
Associate Prof.Head PG Dept. of Computer Science Engineering, NIIST Bhopal, India
ABSTRACT
In this paper a survey on various classification techniques for medical image and also its application for detection of many diseases. Several classification techniques are investigated till today. One of the best methods for classification techniques artificial neural network and SVM (Support Vector Machine). In past many classification techniques by using GA (Genetic Algorithm) and PSO (Particle Swarm Optimization) are commonly used. The classification techniques provide invaluable information to pathologist for diagnosis and treatment of diseases. By identifying and counting blood cell within the blood smear using classification techniques it’s quite possible to detect so many diseases. If we use one of the new classifier i.e. nearest neighbor and SVM it is quiet possible to detect the cancer cell from the blood cell counting.
Keywords
Medical imaging, classification technique, Artificial Neural Network, Nearest Neighbor Network, SVM
1.
INTRODUCTION
2 Input Image Acquisition
CT MRI X-RAY PET SPEC
ULT-SOUND
Region Based Wavelet feature
Sharpening Noise Filtering Pseudo coloring Contrast stretching Smoothing Histogram
Equalizatio n
Feature Extraction
Textural Feature
Gabor Features
Histogram Based GLCM
Based
Image classification Image Pre-Processing
Image Cropping
Image Filtering Gradient Operations Scaling
Image Enhancement
Supervised Unsupervised
Supervised
Unsupervised
Feature selection
PCA analysis
Classifier Technique
Spectral analysis GA/GA based
technique
Cluste
ring K-Mean Fuzzy C
Means
ICA Minimum
Distance Bays Decision
trees
ANN
& SVM
Conte xtual classif iers Iodated
& RBF
Image Segmentation
Fuzzy C Means Fuzzy +
GA Fuzzy + MLP
MLP
Many algorithms in data mining are used for this purpose they are as follow
1.1
Classification and Regression trees
(CART
)
CART algorithm was developed by Brieman, Friedman, Olshen and Stone in 1984 [2]. CART creates trees that have binary split on nominal or interval inputs for a nominal, ordinal or interval target. The CART algorithm does not require binning; data is handled in its raw state. CART also supports the towing splitting criteria which can be used for multiclass problem.It uses the minimal cost complexity pruning to remove features from the classifier that are not significant. CART algorithm automatically balances the class variable, can handle missing values, and allows for cost-sensitive learning and probability tree estimation.
1.2
The Cat Swarm Optimization (CS.O)
Algorithm
The CS.O decision tree algorithm developed by Quinlan in 1998 [3-4]. It can built either a derision tree or a rule set. The CS.O uses the information gain ratio to estimate split at each interval node of tree CS.O model words by slitting the data according to the field that provides the maximum information gain. Each branch defined by the first split is then split again the process repeats until the data cannot be split any further.
1.3
Chi-squared
Automated
Interaction
Detection (CHAID)
This algorithm is proposed by Kass in 1980 [5]. It is a classification method that uses chi-square statistics to identify optimal split to build a decision tree. CHAID uses a Bonferroni adjustment for the number of categorical values of the input variables, thereby mitigating the bias towards inputs with many values.
1.4
Quick, Unbiased, Efficient, Statistical
Tree (QUEST)
This algorithm was introduced by Wei-Yin Loh and Yu-Shan Shin in 1997 [6]. QUEST is a binary classification method for building decision trees. In order to reduce the processing time required for CART, QUEST uses the quadratic disseminate analyses on selected input variables to get the best split, thereby improving the speed over. CART use to determine the optimal split.
1.5
Discriminate Analysis
Discriminate analysis was developed by R.A. Fisher in 1936 [7]. Discriminate analysis is a multivariate statistical technique used to build a predictive or descriptive model of group discriminate based on observed predictor variables and classify each observation into one of the groups
.
1.6
Logistic Regression
Logistic regression refers to methods for describing the relationship between a categorical
response variable and set of predictor variable. Logistic regression describes a function of means (which is a probability) as a function of theexploratory variables. In logistic regression the legit transformation is used [8-9].
1.7
Naive Bayes
The Naive Bayes classifier works on a simple but intuitive concept. It is based on Bayes rule of conditional probability. Naïve Bayes assume that all attributes of the dataset are independent of each other given the context of the class. In
this algorithm assumptions for the conditional probability are expressed. Also Naïve Bayes model has shown itself to be more consistently robust to violation of a conditional independence assumption [10-11].
For previous surveys and recent review papers we came across some new classification technique which is more powerful and easy to implement and also help us for development for diagnosis. In 2011 a review made by many author and they explain several techniques as texture classification, Neural Network classification and Data mining classification [11].
2.
TEXTURE CLASSIFICATION
In texture classification the goal is to assign an unknown sample image to one of set of known texture classes [11]. Texture classification is one of the main domains in the field of texture analysis. It is important for many application of computer image analysis for classification of segmentation of image based on local spatial variations of intensity of color. Main aim of its classification is to finding the defects and diseases. It is divided into four categories i.e. statistical, geometrical, model based and signal processing.
3.
NEURAL NETWORK
CLASSIFICATION
Neural Networks used as an important tool for classification of medical images many research take important growth in this. First Neural network is data driven self adaptive methods. Second Neural networks are universal functional approximation. All these methods are describes and reviewed in [11]. These methods are used in many applications like Magnetic Resonance Imaging (MRI). When we studied about classification techniques many advance techniques have been research like as Fuzzy logic, Artificial Neural Network, Multi layer Neural Network (MLNN), Polynomial Neural Network (PNN), Radial Basis function neural network (RBFNN). Hybrid Techniques like Neuro-Fuzzy Technique, Adaptive Neuro- Fuzzy Inference system (ANFIS), Neuro-Genetic Technique. All these techniques were described by Hota H.S. Shukla S.P. and GulhareKajalKiran [12]. In this paper these methods were describe for the help of concern supervisor, expert persons and medical practitioners. In this paper we think on new technique which is helpful for cancer detection. Many authors and researchers explain about cancer detection. Cancer research is one of the key research fields in medical science. Cancer classification using single genes by gene expression profiles using single genes are described by XIAOSHENG WANG and OSAMU GOTOH. [13].The main advantage of these single-gene Models is that the predication procedures and results are understood with ease. But one might doubt the utility of this methods as he hold that cancerous pathogenesis is so complex that it must be connected with many genes instead of just one, and it is difficult to gauge which genes are essential in cancerous pathogenesis. These disadvantages are over come in advantages and new technique by N. Revathy and Dr. R. Amalraj [14]. These papers propose a technique called Enrichment Score for ranking purpose. Support Vector Machine used as classifier and the result shows the better accuracy of classification which was compared to the conventional method.
4.
SUPPORT VECTOR MACHINES
(SVM)
4 separating hyper plane between the two. For this reason SVM
tends to generalize better. With the basic design of Support Vector Machines, it can only discriminate between two classes. In order to allow for the classification of more than two classes, one of the following methods can be employed. One such method is the "one-vsone" method which creates one binary classifier for each pair of classes. If for our case, for example three classes are there then three binary classifiers are created. Support Vector Machines in their simple form, are called linear classifiers. It is possible however to create a nonlinear SVM by increasing the dimensionality of the feature space, and by using the so-called "kernel-trick". It is thus possible to find a separating the hyper plane in a higher dimensions where such a hyper plane would not exist in lower dimensions. There are many choices for which kernel, to use. The standard choices are the linear kernel (which is otherwise called as dot-product kernel), the polynomial kernel and the Gaussian Kernel. The Gaussian Kernel is the special case of Radial Basis Function (RBF) kernel. In the standard case, the distance used, is the Euclidean distance. In the RBF kernel, the parameters determine, the width of the kernel, and d(x, y) is the distance metric[15].
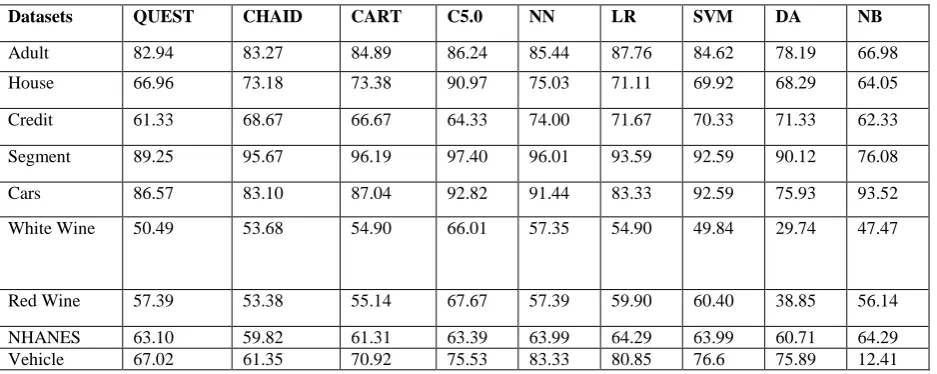
The performances of the selected algorithms were evaluated on the nine publicly available datasets shown in Table 1 .
[image:4.595.50.519.381.568.2]Table 1 shows, for each dataset, the estimated classification accuracy of the nine algorithms. As one can see from Table 2, the classification accuracy of the C5.0 algorithm tends to be better in five out of the nine datasets. The results also show that QUEST, CHAID, CART, SVM and DA show relatively low overall classification accuracy in all the datasets. Naïve Bayes (NB) has the best classification accuracy with the Cars dataset. From the table, it can be seen that both logistic regression (LR) and NB have the best classification accuracy for the NHANES dataset. For the Vehicle dataset, neural networks (NN) came out on top. Based on the results, one can argue that the C5.0 algorithm is the best algorithm because of its performance in five out of the nine dataset; as shown in Table 2, NB accuracy is better in two of the nine datasets (NHANES and Cars), but is inferior to the rest of the algorithms in four datasets (shown in red in Table 2). Some of the classifiers show good to excellent results on some of the datasets but show inferior on most of the datasets. For example all the classifiers show excellent results on the Segment and the Cars dataset and relatively good performance on the adult dataset but they show relatively poor results on the Red wine, White wine and the NHANES datasets.
Table 1: A comparison of the accuracy of Naive Bayes (NB), Neural Networks (NN), Support Vector Machine (SVM), C5.0, Logistic Regression (LR), Discriminant Analysis (DA), QUEST, CHAID and Classification and Regression Tree (CART) on
the nine datasets
Datasets QUEST CHAID CART C5.0 NN LR SVM DA NB
Adult 82.94 83.27 84.89 86.24 85.44 87.76 84.62 78.19 66.98 House 66.96 73.18 73.38 90.97 75.03 71.11 69.92 68.29 64.05 Credit 61.33 68.67 66.67 64.33 74.00 71.67 70.33 71.33 62.33 Segment 89.25 95.67 96.19 97.40 96.01 93.59 92.59 90.12 76.08 Cars 86.57 83.10 87.04 92.82 91.44 83.33 92.59 75.93 93.52 White Wine 50.49 53.68 54.90 66.01 57.35 54.90 49.84 29.74 47.47
Red Wine 57.39 53.38 55.14 67.67 57.39 59.90 60.40 38.85 56.14 NHANES 63.10 59.82 61.31 63.39 63.99 64.29 63.99 60.71 64.29 Vehicle 67.02 61.35 70.92 75.53 83.33 80.85 76.6 75.89 12.41
performance on the Adult and the Segment dataset. From the figure we can argue that the C5.0 model generally performs well for all the datasets, while the performance of the other models largely depends on the data used. For example, the NB obtains reasonable results The NB algorithm shows relatively poor for the Cars and Segment datasets but generates terrible results when using the vehicle dataset.
5.
RESEARCH METHODOLOGY
Our new proposed method for cancer detection from counting blood cells within the blood smear by SVM and NN classifiers. Counting of blood cells from blood smear provides invaluable information to pathologist for diagnosis and treatment of many diseases [16]. In their work blood cell image classification based on Hierarchical SVM were used. Also focus on most existing methods of classification of leucocytes however, identification of erythrocytes and thrombocytes which is important for disease diagnosis. The
median filter was used for noise removal. The algorithm could not only remove noise, but also keep the edge and sharp details of the image.
Here we will use Nearest Neighbor Classifier (NN) which is one of the oldest methods known. The idea is extremely simple, to classify X find its closest neighbor among the training points (Call it X’) and assign to X the label of X’. It is conceptually simple. It does not require learning and also used even with few examples. Even for Moderate K: wonderful performer. It works very well in low dimensions for complex decision surfaces. SVM (Support Vector Machine) network use as a classifier with its very good generalization ability and extremely powerful leaving procedure. With these two classifiers we will detect or detect difference in concern blood cells.
6.
CONCLUSION
by new classifiers that’s SVM (Support Vector Machine) and NN (Nearest Neighbor) classifiers. It will also improve efficiency and better results in cancer field for pathologist and concern users as compare to other previous said methods.
7.
REFERENCES
[1] S.N.Deepa and B.Aruna Devi, “A survey on artificial intelligence approaches for medical image classification”; IJST, vol 4, No.11 (Nov 2011).
[2] Breiman;L; Fredman, J.H., Olshen, R.A., & Stone C J. (1984). Classification and Regression Trees. Wodsworth, Belmont.
[3] Quinlan J. R. (1994) comparing Connectionist and Symbolic Learning Methods”. Computational Learning Theory and National Learning Systems: Constraints and prospects,1.
[4] Quinlm R (1998) C5.0: An informal Tutorial. Rule quest. Retrieved from http://www.rulequest.com/sec5-win.html [5] Kass G. V. (1980). Applied statistics, 29, 119-127 [6] Lim, T, Loh W, &Shih .y (2000).A comparison of
predictive accuracy complexity and Training time of Thirty. Three old and new classification algorithms Machine Learning, 40(3), 203-228, Klywer academic publication, Boston.
[7] Klecka, W.R. (1980) “Discriminant Analysis Quantitative Application in the social Sciences Series”, No. 19. Thousand Oaks, CA: sage publication.
[8] Larose D.T. (Ed.) (2005). Discovering knowledge in Data: An introduction to Data mining. Hoboken, NJ : Wiley.
[9] Larose, D.T. (Ed.) (2006) Data mining Methods and Models. Hoboken, NJ: Wiley.
[10]McCallum A,& Nigam K. (1998). A comparison of Event Models for Naïve Bayes Text classification. Proceedings of workshop on Learning for Text categorization. American Association for Artificial Intelligence.
[11]Smitha P. Shaji L, Dr. Mini M.G., “ A Review of Medical Image classification Techniques”, International conference on VLSI communication R Instrumentation (ICVCI) 2011 (IJCA).
[12]Hota H.S. Shukla S.P. and GulhareKajalKiran, “Review of Intelligent Techniques Applied for classification and preprocessing of Medical Image Data”, IJCSI, Vol. 10, Issue 1, No. 3, January 2013, ISSN : 1694-0784, ISSNLONLONE : 1694-0814
[13]XIAOSHENG WANG OSAMU GOTOH, “Cancer classification using single Genes”. Microarray- Based cancer Perdition using soft computing Approach, cancer information, 7: 123-139, 2009.
[14]N. Revathy, Dr. R. Amalraj, “Accurate Cancer Classification using Expressions of very Few Genes”, International Journal of computer Application (0975-8887), Vol.14, No.-4, January 2011.
[15]D. Jegelevicius, A. Krisciukaitis, A. Lukosevicius, V. Marozas, A. Paunksnis, V. Barzdziukas, et al, “Network Based Clinical Decision Support System” Proceedings of the 9th International Conference on Info~ation Technology and Applications in Biomedicine, ITAB 2009, Larnaca, Cyprus, November 2009