http://dx.doi.org/10.4236/jss.2015.311024
How to cite this paper: Zhou, M.Z., Liu, W.J. and Yang, X.W. (2015) Operating Efficiency of National High-Tech Industrial Development Zones in China and Its Difference Analysis—Based on DEA and Clustering. Open Journal of Social Sciences, 3, 197-206. http://dx.doi.org/10.4236/jss.2015.311024
Operating Efficiency of National High-Tech
Industrial Development Zones in China and
Its Difference Analysis—Based on DEA and
Clustering
Mingze Zhou, Wenjie Liu, Xiaowan Yang*
School of Business Administration, South China University of Technology, Guangzhou, China
Received 22 October 2015; accepted 14 November 2015; published 17 November 2015
Copyright © 2015 by authors and Scientific Research Publishing Inc.
This work is licensed under the Creative Commons Attribution International License (CC BY). http://creativecommons.org/licenses/by/4.0/
Abstract
Taking China’s 56 national high-tech zones as the research objects, this paper respectively dis-cusses the decomposition, features and diversity issues of the operational efficiency of the high- tech zones, based on DEA evaluation of its comprehensive efficiency, pure technical efficiency and scale efficiency. This research shows: 1) Over the years, the operating efficiency of China’s high- tech zones characterizes cycle development, and the low efficiency of the “first entrepreneurship” and “secondary entrepreneurship” stages result from invalid scale efficiency and pure technical efficiency; 2) China’s high-tech zones can be divided into four types, namely, the versatile and efficient type, the inefficient scale type, the inefficient allocation type and the continuous im-provement type, and the low efficiency of high-tech zones is mainly rooted in pure technical ineffi-ciency.
Keywords
China’s High-Tech Zones, DEA, Operating Efficiency, Difference, Rapid Cluster Analysis
1. Introduction
China’s National High-tech Zones (hereinafter referred to as “high-tech zones”) are important carriers aiming to improve our capability of independent innovation, the implementation of innovation-driven development strate-gy. Since the late 1980s, China has established high-tech zones to explore the path and model of innovative
velopment, after 20 years of construction in the “first entrepreneurship” and “secondary entrepreneurship” phase, high-tech zones have become a banner to China’s scientific and technological innovation, economic develop-ment, and the road of independent innovation with China’s characteristics, which lead to wholly social devel-opment, innovation development and the strategy guide of sustainable development. In 2014, high-tech zones continued to thoroughly implement innovation-driven development strategy, achieving gross full-caliber pro-duction 6.6 trillion yuan, accounting for 10.4% of GDP. But behind the huge scale, there remains intense homo-geneous competition [1]. Innovation of high-tech zones in general is not only weak but exists huge difference [2] and other issues. In the current situation of scarce innovation resources, this paper identifies the situation and the reasons for the innovation efficiency of different high-tech zones [3]-[5] and studies how to improve the innova-tive technology efficiency of high-tech zones to produce innovation output as high as possible with limited in-novation investment. It will undoubtedly have important theoretical and practical significance for strengthening the dominant position of the high-tech areas of technological innovation, rapidly increasing China’s technologi-cal innovation capability, and accelerating the process of innovation-driven strategy.
2. Research Design
2.1. Construction of the DEA-BCC Model
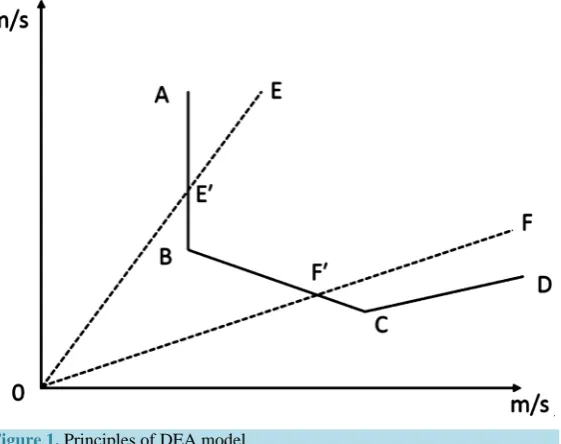
DEA method is an efficiency measurement method, based on fixed returns to scale hypothesis, for the evalua-tion of the efficiency of decision units (DMU), and its aim is to construct an envelope nonparametric frontier line, of which efficient points locate on the production frontier and invalid points at the forefront below [6]. As-suming six decision units (A, B, C, D, E, F), each DMU uses “m” kinds of input elements to produce “s” kinds of output, the “i” DMU efficiency value θ exists the following three conditions: when θ = 1, then means that unit is effective and at the forefront of the surface, as A, B, C, D shown in Figure 1; on the other hand, if θ < 1, it means that the unit is invalid and it is located below the frontier, such as E and F.
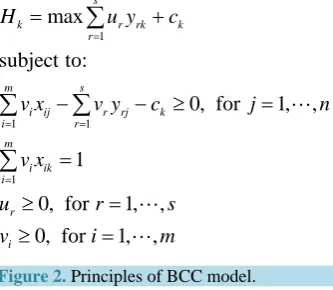
Charnes [7] and others employ changes returns to scale hypothesis replacing with fixed returns to scale hypo-thesis, developed into BCC model. Suppose there are n number of evaluation units DMU j (j = 1, ···, n), DMU j the input xj = (x1j, x2j, ···, xnj)T, xij is inputs of j-decision unit for i-type investment, output yj = (y1j, y2j, ···, yrj) T,
yrj is output of j-decision unit for r-type outputs, xj, yj ≥ 0 (j = 1, 2, ···, n), ck is an additional variable based on CCR, namely, k-th returns to scale index. BCC model shown in Figure 2.
[image:2.595.177.458.495.717.2]DEA-BCC model to evaluate the efficiency of high-tech zones has the following three advantages: first, the weight of each DEA input and output is carried out from the angle of the most favorable to the evaluation unit; Second, DEA does not have to determine the relationship between input and output, with a strong objectivity; Third, comprehensive efficiency is decomposed into pure technical efficiency and scale efficiency in BCC model,
1 1 1 1 1 max subject to:
0, for 1, ,
0, for 1, ,
0, for 1, ,
s
k r rk k
r
m s
i ij r rj
i r m i ik i r i k
H u y c
c j
v x v y
v
n
r s
x
u
v i m
[image:3.595.230.397.91.236.2]= = = = = + ≥ = ≥ = ≥ − = = −
∑
∑
∑
∑
Figure 2. Principles of BCC model.
where pure technical efficiency reflects the gap between the current decision point and the efficient production frontier; but scale efficiency reflects the gap between the same size production frontier and scalable production frontier [8] [9].
2.2. Selection of Indicators and Data Sources
Operational efficiency is a multi-input, multi-output dynamic complex system. China’s scholars have no con-sensus on the view of choosing indicators of operating efficiency of high-tech zones [10]. In light of existing re-searches, the operating efficiency of high-tech zones are analyzed in terms of input-output, dividing into two elements of financial and human resources, respectively, and the asset investment and the number of practition-ers characterize two indicators; in terms of the output variables, this paper use total income, industrial produc-tion and export three indicators to characterize. We choose 2 input indicators and 3 output indicators of high- tech zones in 1996-2011, of which descriptive statistics trend show in Figure 3. The original data derive from the “China Torch Statistical Yearbook”, “China Statistical Yearbook on Science and Technology” and “China Statistical Yearbook of high-tech industries”.
3. Empirical Analysis
3.1. Development Features of the Operating Efficiency in China’s High-Tech Zones and Its Stage Analysis
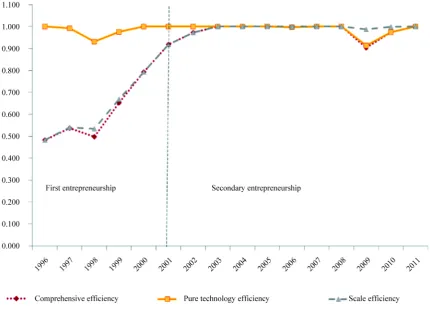
This paper uses DEAP2.1 software, based on input-oriented BCC model, to analyze the obtained results, shown in Figure 4: operating efficiency of high-tech zones shows characters of stage in the “first entrepreneurship” phase of 1996-2000, the comprehensive efficiency in the non-effective state, and comprehensive efficiency is relatively low value; pure technical efficiency is substantially in a valid state; scale efficiency shows a rising trend in a non-valid state. In the “secondary entrepreneurship” phase, from the perspective of comprehensive ef-ficiency, in 2003, 2004, 2007, 2008 and 2011, the comprehensive efficiency in the active state; pure technical efficiency is active before 2008, and have become active in the trend after 2011; Scale efficiency in 2003-2008 and 2011, have reached a valid state in both entrepreneurship phase, respectively, a volatile period, namely the 1997 Asian financial crisis and the international financial crisis in 2008. Under the impact of the crisis, the effi-ciency of high-tech zones presents poor condition. Overall, over the overall operating effieffi-ciency of the high-tech zone was circulating level of development of the state.
Figure 3. The empirical research of input and output level in China’s high-tech zones between 1996 and 2011.
[image:4.595.103.534.399.709.2]From the perspective of self-development capability, in the “first entrepreneurship” stage, the development scale of high-tech zones is in its infancy, the focus of our concerns is the infrastructure construction of high-tech zones, production elements and business gathering, yet to present the scale effect; In the “secondary entrepre-neurship” phase, the development of high-tech zones come to the stage of rapid development, when scale effects has been maximized, and even the size of a decreasing trend. Due to China’s high-tech zones dependent on gov-ernment intervention and previous excessive pursuit of scale economies, the resources combination problems are highlighted slowly, resulting in pure technical efficiency doing not reach the active state. From the aspect of the macroeconomic situation, significant fluctuations in the economic cycle will adversely affect operational effi-ciency of the high-tech zones, such as the 1997 Asian financial crisis and the 2008 international financial crisis. With the changes in the economic cycle, macroeconomic policy should be adjusted accordingly, even imple-mentation of tight policy, while the export of high-tech zones also has an enormous impact.
3.2. The Decomposition of the Operating Efficiency in China’s High-Tech Zone and Its Characteristics
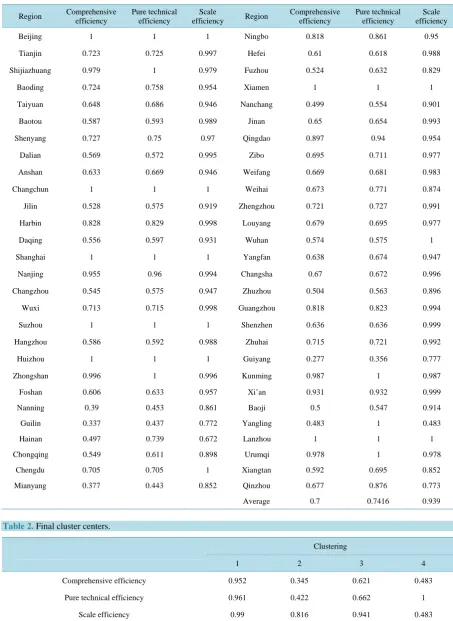
In 2011, the results of efficiency decomposition, concerned 56 high-tech zones, are shown in Table 1, and Table 1 can be drawn from the following features: 1) Judging from the population mean, mean scale efficiency is 0.6995, mean pure technical efficiency of 0.7416, and mean scale efficiency is 0.9386, scale efficiency > pure technical efficiency > comprehensive efficiency, shows that high-tech zones reach saturation state in scale, and there is considerable room for improvement as comprehensive efficiency is not optimistic on the whole; 2) efficiency values of 1 mean that the high-tech zones are effective units. 7 high-tech zones are of effective comprehensive efficiency, accounting for 12.5% of the overall number, and 12 high-tech zones are of effective pure technical efficiency, accounting for 21.4% of the overall number, and 9 high-tech zones are of effective scale efficiency, accounting for 16.1% of the overall number; 3) Judging from the standard deviation, standard deviation of com-prehensive efficiency is 1.9606, standard deviation of pure technical efficiency is 0.1796, and standard deviation of scale efficiency is 0.9528, which explain comprehensive efficiency fluctuate dramatically, and pure technical efficiency fluctuate smoothly.
4. The Clustering and Difference Analysis of the Operating Efficiency in China’s
High-Tech Zones
4.1. Cluster Analysis
Based on the precision of clustering results, we ultimately select the comprehensive efficiency, pure technical efficiency and scale efficiency, taking the three variables as clustering analysis variables. When the cluster is 4, statistical software SPSS17.0 is used to quick cluster analysis. After two iterations, the final cluster centers have been determined, and Table 2 shows comprehensive efficiency values, pure technical efficiency values and scale efficiency values of the cluster centers for each cluster.
As can be seen in Table 2, cluster 1, which has high level of pure technical efficiency and scale efficiency, has 17 high-tech zones, accounting for 30.4% of the total; Cluster 2, which has low pure technical efficiency, relatively low scale efficiency, and the most lowest comprehensive efficiency, has four high-tech zones, ac-counting for 7.1% of the total; Cluster 3, of which pure technical efficiency is relatively low, scale efficiency is high, comprehensive efficiency is not yet significant, has 34 high-tech zones, accounting for 60.7% of the total; Cluster 4, of which scale efficiency is relatively low, high pure technical efficiency is quite high, but compre-hensive efficiency is low, has only one high-tech zone, accounting for 1.8% of the total. According to variance analysis table, three indexes in cluster 4 show significant differences in fast clustering, thus the clustering results are reasonable.
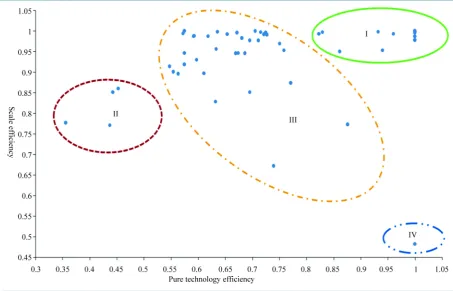
According to fast clustering analysis of the levels of comprehensive efficiency value, pure technical efficiency value and scale efficiency value, the high-tech areas are divided into the versatile and efficient type, the ineffi-cient allocation type, the ineffiineffi-cient scale type and the continuous improvement type which characterize four different regions of efficiency level, and in accordance with the value of the two dimensions of 56 high-tech zones, Figure 5 illustrates the respective values of pure technical efficiency and scale efficiency in the form of classified scatter to the four regions.
Table 1. The efficiency value of high-tech zones in 2011.
Region Comprehensive efficiency
Pure technical efficiency
Scale
efficiency Region
Comprehensive efficiency
Pure technical efficiency
Scale efficiency
Beijing 1 1 1 Ningbo 0.818 0.861 0.95
Tianjin 0.723 0.725 0.997 Hefei 0.61 0.618 0.988
Shijiazhuang 0.979 1 0.979 Fuzhou 0.524 0.632 0.829
Baoding 0.724 0.758 0.954 Xiamen 1 1 1
Taiyuan 0.648 0.686 0.946 Nanchang 0.499 0.554 0.901
Baotou 0.587 0.593 0.989 Jinan 0.65 0.654 0.993
Shenyang 0.727 0.75 0.97 Qingdao 0.897 0.94 0.954
Dalian 0.569 0.572 0.995 Zibo 0.695 0.711 0.977
Anshan 0.633 0.669 0.946 Weifang 0.669 0.681 0.983
Changchun 1 1 1 Weihai 0.673 0.771 0.874
Jilin 0.528 0.575 0.919 Zhengzhou 0.721 0.727 0.991
Harbin 0.828 0.829 0.998 Louyang 0.679 0.695 0.977
Daqing 0.556 0.597 0.931 Wuhan 0.574 0.575 1
Shanghai 1 1 1 Yangfan 0.638 0.674 0.947
Nanjing 0.955 0.96 0.994 Changsha 0.67 0.672 0.996
Changzhou 0.545 0.575 0.947 Zhuzhou 0.504 0.563 0.896
Wuxi 0.713 0.715 0.998 Guangzhou 0.818 0.823 0.994
Suzhou 1 1 1 Shenzhen 0.636 0.636 0.999
Hangzhou 0.586 0.592 0.988 Zhuhai 0.715 0.721 0.992
Huizhou 1 1 1 Guiyang 0.277 0.356 0.777
Zhongshan 0.996 1 0.996 Kunming 0.987 1 0.987
Foshan 0.606 0.633 0.957 Xi’an 0.931 0.932 0.999
Nanning 0.39 0.453 0.861 Baoji 0.5 0.547 0.914
Guilin 0.337 0.437 0.772 Yangling 0.483 1 0.483
Hainan 0.497 0.739 0.672 Lanzhou 1 1 1
Chongqing 0.549 0.611 0.898 Urumqi 0.978 1 0.978
Chengdu 0.705 0.705 1 Xiangtan 0.592 0.695 0.852
Mianyang 0.377 0.443 0.852 Qinzhou 0.677 0.876 0.773
Average 0.7 0.7416 0.939
Table 2.Final cluster centers.
Clustering
1 2 3 4
Comprehensive efficiency 0.952 0.345 0.621 0.483
Pure technical efficiency 0.961 0.422 0.662 1
Figure 5.The scatter distribution of the operating efficiency in China’s high-tech zones.
For the versatile and efficient type of high-tech zones, its comprehensive efficiency, pure technical efficiency and scale efficiency are at or close to 1, and its comprehensive efficiency, pure technical efficiency and scale ef-ficiency are at or near DEA actively. This type of high-tech zones are valid both in the allocation of resources and in the inputs and outputs on the overall size of the high-tech zones. For instance, Zhongguancun Science Park, Shijiazhuang, Changchun, Harbin, Zhangjiang Hi-Tech Park, Nanjing, Suzhou, Ningbo, Xiamen, Qingdao, Guangzhou, Huizhou, Zhongshan, Kunming, Xi’an, Lanzhou and Urumqi.
2) The continuous improvement type (Class II)
Pure technical efficiency and scale efficiency of the continuous improvement type of high-tech zones are rela-tively low, and comprehensive efficiency values are the lowest of the four types. In this type of high-tech zones, there are relatively serious problems in the allocation of resources and scale levels, for example, Nanning, Guilin, Mianyang and Guiyang.
3) The inefficient allocation type (Class III)
For the inefficient allocation type of high-tech zones, pure technical efficiency is relatively low, scale effi-ciency is yet relatively high, but the comprehensive effieffi-ciency is not high. This type of high-tech zones in terms of pure technical efficiency is invalid, a total of 34 cities exist more prominent problems in terms of input-output resource. For example, Tianjin, Taiyuan, Shenyang, Dalian, Jilin, Changzhou, Wuxi, Hangzhou, Nanchang, Zhengzhou, Wuhan, Changsha, Shenzhen, Zhuhai, Baoji, etc.
4) The inefficient scale type (Class IV)
For the inefficient scale type of high-tech zones, pure technical efficiency is generally higher than scale effi-ciency, and the comprehensive efficiency is relatively low. The high-tech zones of this type in terms of scale ef-ficiency are invalid, which means that the problem of scale level is more prominent. The main representative of this type of high-tech zones is the Yangling Agricultural High-tech Industries Demonstration Zone.
4.2. Difference Analysis of the Operating Efficiency in China’s High-Tech Zones
zones on the whole is to reach the best condition in the allocation of resources and the scale level, the operating efficiency of various high-tech zones is different.
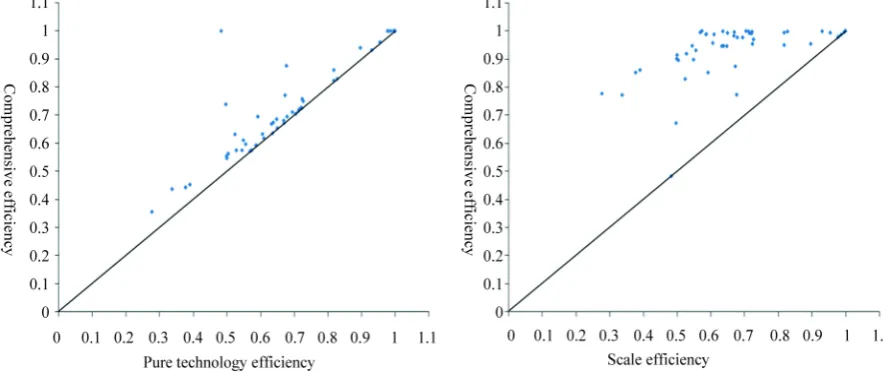
In terms of structural differences, China’s operating efficiency of high-tech zones, which reach 49, do not achieve an effective state, of which 85.7% scale efficiency value is higher than pure technical efficiency value, which is consistent with the comparison results of the mean size. To further analyze influence of pure technical efficiency and scale efficiency on the comprehensive efficiency of our high-tech zones, Figure 6 illustrates the relationships between the comprehensive efficiency of 56 high-tech zones and the two decompositions respec-tively, via the scatter plot. As can be seen from Figure 6, pure technical efficiency and the comprehensive effi-ciency fit 45-degree line significantly that is better than the scale effieffi-ciency, suggesting that the main factor leading to the different comprehensive efficiency of the high-tech zones is pure technical efficiency.
From the perspective of category differences, the inefficient allocation type of high-tech zones account the largest proportion, followed by the versatile and efficient type, the continuous improvement type, and finally the inefficient scale type. In 2011, the large proportion of the inefficient allocation type of high-tech zones directly leads to the overall operating efficiency of high-tech zones does not achieve an effective state in terms of the mean value, and the main problem of the inefficient allocation type of high-tech zones is inefficient allocation of resources, namely, the existing combination of input and output need is suboptimal, and therefore that need to be adjusted and improved. At the same time, we specially note that the inputs of Lanzhou, Urumqi and Kunming in western high-tech zones are significantly lower than other high-tech zones of versatile and efficient type. Hence, although the operating efficiency of these high-tech zones is rather high, this is not on behalf of its high levels of operating efficiency.
5. Conclusions and Recommendations
5.1. ConclusionsIn this paper, in the case of high-tech zones, we build the evaluation index system of operating efficiency of high-tech zones, based on DEA method, to calculate the comprehensive efficiency, pure technical efficiency and scale efficiency of China’s whole high-tech zones in the calendar year (1996-2011) and the 56 high-tech zones in 2011. Then according to the levels of comprehensive efficiency value, pure technical efficiency and scale ef-ficiency value, we use cluster analysis to process these data. The results show that:
[image:8.595.90.532.485.674.2]1) Over the years, the operating efficiency of China’s high-tech zones characterizes cycle development, namely, the “first entrepreneurship” phase, where overall operating efficiency of the high-tech zones is not high mainly due to an invalid scale efficiency; but in the “secondary entrepreneurship” phase, the overall operating
efficiency of the high-tech zones is not high due to an invalid pure technical efficiency. It can be seen even in the “second entrepreneurship” phase. Pure technical efficiency is still to be improved, indicating that the imple-mentation of innovation-driven strategy is still a long way to go.
2) There exists imbalance in the development of the operating efficiency of China’s high-tech zones. Accord-ing to three major efficiency standards, high-tech areas can be divided into four types: the versatile and efficient type, the inefficient scale type, the inefficient allocation type and the continuous improvement type. From the perspective of structural differences, the main factor leading to the differences of the comprehensive efficiency of high-tech zones is pure technical efficiency, namely, the input-output of resources has not yet obtained opti-mum; from the perspective of category differences, high-tech areas of the inefficient allocation type are the ma-jority, most of high-tech zones of this type “drag” overall operational efficiency, which therefore need to be ad-justed and improved.
5.2. Recommendations
Based on these findings, we recommend the following two aspects:
1) The Government should continue on introducing incentives and support measures in terms of how to im-prove the technology innovation efficiency in high-tech zones. On the one hand, high-tech zones should be en-couraged to increase their own R&D investment and pay attention to the introduction and training of technology personnel; on the other hand, enterprises should be supported to increase cooperation with universities and re-search institutions in terms of underlying technology, whereby enterprises can fully exploit their talent and knowledge accumulation, resource sharing and complementary skills. At the same time, it is necessary to change the evaluation criteria to guide enterprises focusing on the “more stronger” instead of “more bigger” as the analysis shows that the scale efficiency is higher than the pure technical efficiency in 85.7% high-tech zones.
2) For the four different types of high-tech zones, the government should focus on improving the efficiency of the inefficient allocation type and the inefficient scale type. For the inefficient allocation type of high-tech zones, enterprises in the region should strive to promote the integration of resources, phasing out enterprises of back-ward production capacity, avoiding blind expansion, and improving resource conversion capabilities. And for the scale inefficient type of high-tech zones, they may consider a merger among enterprises of chain comple-mentary advantages to improve the scale efficiency because of their pure technical efficiency generally higher than scale efficiency, and the comprehensive efficiency relatively low. Overall, the high-tech zones that do not reach the efficient type should take appropriate reform measures to reduce the differences, promote the coordi-nated development, and ultimately come to a dynamic linkage between pure technical efficiency and scale effi-ciency of the high-tech zones, which results in equalization boost to continue strengthen the dominant position of the high-tech area in terms of technological innovation, and improve our ability to technology innovation and accelerate the process of the innovation-driven strategy.
In view of the important role of high-tech zones to improve China’s capacity for independent innovation and the implement of the innovation-driven development strategy, the government should strive to design the top- level system well, clear their own role, and give priority to the market for allocation of resources and the oper-ating function in high-tech zones while being moderately guided.
References
[1] Han, L. and Zhan, Z.-L. (2015) The Choice of the Restructuring and Development of High-Tech Zones under the
Background of Overall Deepen Reform. Science & Technology Progress and Policy, 14, 31-35.
[2] Fang, Y.-M. and Liu, F.-C. (2014) Evaluation of the Innovation Capability of the National High-Tech Industrial
De-velopment Zones in China. Journal of Dalian University of Technology: Social sciences, 35, 26-32.
[3] Hou, Y.-Y. and Liu, Y. (2013) Operation Mechanism and Performance Evaluation of High-Tech Zone’s Innovation
Internationalization. Chinese Journal of Management Science, S2, 720-725.
[4] Xie, Z.-Y. (2014) Empirical Study on Agglomeration Effects of National High-Tech Industrial Development Zones in
China. Science Research Management, 5, 138-144.
[5] Yu, H.-P. (2014) Review on the Appraisement System of High-Tech Zones. Science and Technology Management
Re-search, 17, 31-36.
[6] Charnes, A., Cooper, W.W. and Rhodes, E. (1978) Measuring the Efficiency of Decision Making Units. European
[7] Banker, R.D., Charnes, A. and Cooper, W.W. (1984) Some Models for Estimating Technical and Scale Inefficiencies
in Data Envelopment Analysis. Management Science, 30, 1078-1092.http://dx.doi.org/10.1287/mnsc.30.9.1078
[8] Yang, G.-L., Liu, W.-B. and Zheng, H.-J. (2013) Review of Data Envelopment Analysis. Journal of Systems
Engi-neering, 28, 840-860.
[9] Liu, S. and Qian, S.-R. (2011) Study on Operation Efficiency of Business Incubator in Anhui Based on DEA.
Tech-nology Economics, 30, 6-10.
[10] Liu, M.-F. and Li, S.-H. (2012) A Comparative Study of Innovation Efficiency of National High-Tech Development