How to cite this paper: Wankhede, N.S. and Shah, M.S. (2014) Validation of Optimum Algorithm Parameters Required to Estimate Vocal Tract Shape for Children Using LPC Analysis. Open Access Library Journal, 1: e690.
http://dx.doi.org/10.4236/oalib.1100690
Validation of Optimum Algorithm
Parameters Required to Estimate Vocal
Tract Shape for Children Using LPC Analysis
Nilashree S. Wankhede, Milind S. Shah
Department of Electronics and Telecommunication, Fr. C. Rodrigues Institute of Technology, Navi Mumbai, India
Email: [email protected], [email protected]
Received 20 April 2014; revised 1 June 2014; accepted 15 July 2014
Copyright © 2014 by authors and OALib.
This work is licensed under the Creative Commons Attribution International License (CC BY). http://creativecommons.org/licenses/by/4.0/
Abstract
Severe or profound deafness in hearing impaired children, can curb their ability to speak due to the lack of auditory feedback. There has been a considerable attempt in developing commercial speech training aids for such children which give feedback of acoustic and articulatory parameters. Speech training aids based on visual feedback of vocal tract shape (VTS) are reported to be useful for the improvement in speech production. Since realistic VTS estimation for adult speakers and their validation has already been done successfully, VTS estimation is now necessarily required in case of children too, so that they get trained in speech at an early age. The investigation on vocal tract shape estimation based on LPC analysis of speech by appropriately selecting some of the al-gorithm parameters such as vocal tract length, LPC order, and speech sampling rate has been done in our previous work. This paper attempts to validate the obtained results for vocal tract shapes corresponding to certain recorded vowels from children belonging to specific age groups. Since MRI images of VTS are unavailable for articulating children, validation of our results is based on the results from researchers who have used other indirect techniques to obtain VTS.
Keywords
Vocal Tract Shape Estimation, Optimum Parameters, Children
Subject Areas: Education, Multimedia/Signal Processing
1. Introduction
OALibJ | DOI:10.4236/oalib.1100690 2 July 2014 | Volume 1 | e690
have access to the auditory feedback and hence hearing impaired individuals cannot speak, in spite of having proper speech production mechanism. Traditionally, hearing impaired has been understanding speech by sign language or lip movements. The development of speech training aids based on visual feedback of acoustic and articulatory parameters has been a boon to the hearing impaired persons for improvement in their speech pro-duction [1]-[7]. The acoustic parameters include intensity of speech, pitch and formant frequencies whereas ar-ticulatory parameters include vocal tract shape and tongue position. Speech training aids based on visual feed-back of vocal tract shape (VTS) for the improvement in speech production in adult speakers have been reported to be useful [7]-[9]. A hearing impaired person can observe the articulation of his own vocal tract shape and compare it with a reference articulation provided by the speech training aid thus to minimize the mismatch in VTS [7].
There are few direct imaging techniques such as ultrasound imaging [10], X-ray imaging [11], electromag-netic articulograph [12], and magnetic resonance imaging (MRI) [13] [14], etc. and indirect techniques where speech signal is used for vocal tract shape estimation. The indirect techniques include use of formants [15]-[17], lip impedance measurement [18] and LPC analysis of speech [19] [20]. With a distinct advantage of LPC analy-sis, that the real time VTS can be obtained, this method has been popularly used for adult speakers. Investigation has been done towards obtaining optimum algorithm parameters for LPC analysis using Wakita’s method [19]. The obtained parameters found are vocal tract length, LPC prediction order and sampling frequency of speech signal acquired from children in various age groups [21]. This paper presents an attempt to validate the results presented in [21] for obtaining realistic VTS of children in various age groups who have spoken vowels.
The validation for VTS obtained for adults in our previous work [21] had been done using MRI data provided by Story et al. [13]. But for children, such validation cannot be done using direct imaging technique due to nonavailabilty of MRI reference database for articulating children. Hence, the validation of our results would be trying to match our results with those obtained from few other indirect estimation techniques like acoustic pulse reflectometry and perturbation technique. Experimental results from Fitch et al. [22] can be used for preliminary validation by observing the overall growth of vocal tract and observing the trend of change in the vocal tract shape as age increases. Apart from this preliminary validation, our results for vocal tract area functions obtained for two age groups of children can be compared with those from Calcum [18] and Bunton et al. [23] who have used different estimation techniques.
Section 2 presents few implementation results of LPC based VTS estimation for children belonging to differ-ent age groups and Section 3 discusses the validation done based on results from other indirect techniques used by two researchers. Section 4 presents conclusions drawn based on the validated results.
2. LPC Based Vocal Tract Shape Estimation
2.1. Modeling Human Vocal Tract
Human vocal tract can be modeled as a non-uniform acoustic tube filter, which includes the contributions of glottal wave, vocal tract, and radiation impedance at lips and generates speech at the output [19] [20] [24] [25]. Wakita [19] [20] has assumed that the speech to be analyzed for VTS estimation is limited to periodic non-na- salized voiced sounds so that the filter is driven by an impulse train. The Wakita’s speech analysis model is shown inFigure 1 [19]. It consists of non-uniform acoustic tube filter followed by an inverse filter. The filtering process of the inverse filter is such that the difference between the output of the inverse filter and the input im-pulse train attains the minimum for a certain error criterion thus making an acoustic tube filter equivalent to the inverse filter. Power spectral envelope of speech signal is approximated by poles only and inverse filter is as-sumed to be a linear filter with only zeroes in transfer function [19] [20]. The modeling of acoustic tube filter is based on concatenated tubes of varying cross-sectional areas, i.e. an arbitrary “M” number of sections with equal length “∆l” as shown inFigure 2 [19]. The speech sampling rate “Fs”, total length of vocal tract “l” and the number of sections “M” in the acoustic tube model are related as given in Equation (1) [21].
2
Fs=Mc l (1) [19]
where c = 350 m/s.
OALibJ | DOI:10.4236/oalib.1100690 3 July 2014 | Volume 1 | e690
Figure 1. Speech analysis model [19].
Figure 2. Non-uniform acoustic tube model of the vocal tract [19].
the findings from MRI data [22] for vocal tract development from childhood to adolescence.
Our objective was to find the optimum algorithm parameters “l”, “Fs” and “M” so that we obtain realistic vo-cal tract shapes using LPC analysis for child speakers and also we are able to validate our results.
2.2. Implementation to Obtain VTS for Children
The procedure followed towards VTS estimation for children is explained here [21]. Sampled speech from adults as well as children is pre-emphasized before applying a Hamming window of 20 msec. Autocorrelation coefficients were obtained using LPC analysis. Levinson Durbin algorithm was implemented to obtain reflection coefficients from autocorrelation coefficients. Using reflection coefficients area values for each section along the vocal tract from glottis towards the lips are found out using Wakita’s method [19] [24] [25]. These area val-ues then can be plotted on y-axis taking distance from glottis to lips on x-axis.
Selection of optimum values for “M”, “Fs”, and “l” was not a difficult task for adult speakers as the average vocal tract length (VTL) in case of adults is reported to be 17 cm [13] [22] [25] and with Fs = 11.025 kHz, from Equation (1), we get M = 12. Also, it was not difficult to validate the VTS for adults [21] as the estimated shapes can be compared with the shapes obtained based on MRI techniques [18]. Procedure for obtaining VTS for children was slight different and we referred the results obtained by Fitch et al. [22]. In his paper, he had provided data for sectional growth of vocal tract in children, from the age group of 2 years to the adulthood. Based on this data, the average vocal tract length for various age groups of children was selected. This average vocal tract length is the input parameter “l” and used in the implemented algorithm for VTS estimation.
We divide the children into 5 age groups, i.e. from 2 to 6, 7 to 9, 10 to 12, 13 to 16 and 17 to 21 years. For the age group of 2 to 6 years, 10 cm is selected as the average VTL denoted by “l”; for the age group of 7 to 9, av-erage VTL of 11.5 cm is selected and so on. For obtaining optimum LPC order “M”, for a particular age group, the LPC order was varied from 8 to 12 in the implemented algorithm so that VTS results would be obtained for each selected “M”. For selected average VTL “l” and LPC order “M”, “Fs” was calculated using Equation (1). The original recordings acquired at 44 kHz using PRAAT software were down sampled to calculated “Fs”. For this particular set of “M”, “Fs”, and “l” as algorithm parameters, VTS was estimated using our MATLAB code. The procedure was repeated by increasing the value of “M” for a single age group.
Five vocal tract shapes were obtained corresponding to five prediction orders used out of which one of the re-alistic vocal tract shape was chosen for that age group based on observation and the expected trend in the varia-tions of vocal tract area values from glottis towards lips. Based on the realistic shape, corresponding value of prediction order “M”, was to be declared as optimum. For each group similar procedure was followed.
Filter Impulse
train
Speech
x(n) Inverse
filter
y(n)
Error
e(n) Σ
C
ro
ss
se
ct
io
n
al
ar
ea
Glottis
Section m+ 1
Lips
Distance Section m
Δl
xm−1 x1 x0
A0
(
,)
m m u+ t x
(
,)
m m u− t xm x
(
)
1 , 1
m m
u++ t x+
(
)
1 , 1
m m
u−+ t x +
OALibJ | DOI:10.4236/oalib.1100690 4 July 2014 | Volume 1 | e690
2.3. Sample Results for VTS of a 4-Year-Old Child
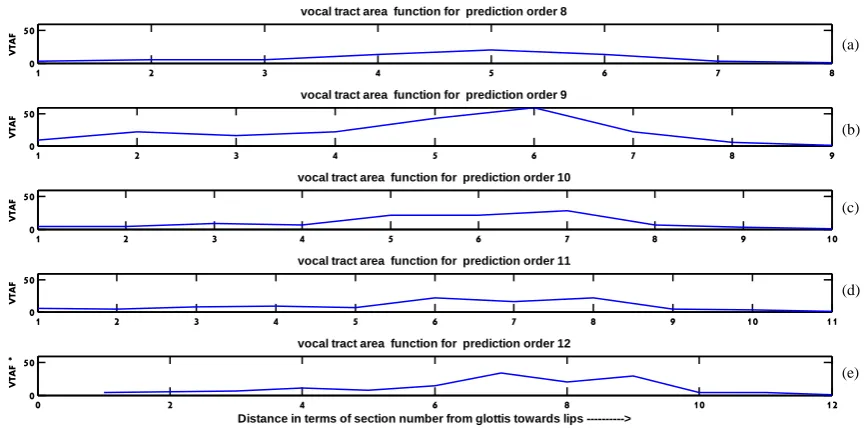
[image:4.595.103.528.481.686.2]Figures 3(a)-(e),Figures 4(a)-(e) and Figures 5(a)-(e) show sample vocal tract shapes in terms of vocal tract area function (VTAF) obtained for vowels /a/, /i/ and /u/, respectively for a 4-year-old child in the age group of 2 to 6 years. For every vowel, five vocal tract shapes are displayed by varying prediction order from 8 to 12 in steps of one. The estimated shapes based on LPC analysis are presented in terms of cross-sectional area along y-axis vs section number from glottis to lips along x-axis. FromFigure 3(a) it is observed that when vowel /a/ is spoken, a large opening at the lips is present and as we move from glottis towards lips vocal tract area values in-crease towards lips. FromFigure 4(a) it is very clear that when vowel /i/ was spoken, a small opening towards lips is observed but near to glottis large opening is present. Similarly, vowel /u/ VTS results inFigure 5(a) fol-low the trend of change in vocal tract area values from glottis to lips similar to adult vocal tract shapes [21].
Figure 3. VTAF results obtained for a 4-year-old girl speaking vowel /a/ with LPC order. (a) M = 8 (b) M = 9 (c) M = 10 (d) M = 11 (e) M = 12 (Fs = 14 kHz, average VTL l = 10 cm).
Figure 4. VTAF results obtained for a 4-year-old girl speaking vowel /i/ with LPC order. (a) M = 8 (b) M = 9 (c) M = 10 (d) M = 11 (e) M = 12 (Fs = 14 kHz, average VTL l = 10 cm).
1 2 3 4 5 6 7 8
0 2
4 vocal tract area function for prediction order 8
V
T
AF
1 2 3 4 5 6 7 8 9
0 2
4 vocal tract area function for prediction order 9
V
T
AF
1 2 3 4 5 6 7 8 9 10
0 5
10 vocal tract area function for prediction order 10
V
T
AF
1 2 3 4 5 6 7 8 9 10 11
0 5
10 vocal tract area function for prediction order 11
V
T
AF
0 2 4 6 8 10 12
0 5
10 vocal tract area function for prediction order 12
V
T
AF
Distance in terms of section number from glottis towards lips --->
* VTAF : estimated crosssectional area of the vocal tract
*
(a)
(b)
(c)
(d)
(e)
1 2 3 4 5 6 7 8
0
5 vocal tract area function for prediction order 8
V
TAF
1 2 3 4 5 6 7 8 9
0
5 vocal tract area function for prediction order 9
V
TAF
1 2 3 4 5 6 7 8 9 10
0 10
20 vocal tract area function for prediction order 10
V
TAF
1 2 3 4 5 6 7 8 9 10 11
0 10
20 vocal tract area function for prediction order 11
V
TAF
0 2 4 6 8 10 12
0 10
20 vocal tract area function for prediction order 12
V
TAF
Distance in terms of section number from glottis towards lips ---> * VTAF : estimated crosssectional area of the vocal tract
*
(a)
(b)
(c)
(d)
OALibJ | DOI:10.4236/oalib.1100690 5 July 2014 | Volume 1 | e690
Figure 5. VTAF results obtained for a 4-year-old girl speaking vowel /u/ with LPC order. (a) M = 8 (b) M = 9 (c) M = 10
(d) M = 11 (e) M = 12 (Fs = 14 kHz, average VTL l = 10 cm).
For the three vowels /a/, /i/ and /u/ spoken by four children in the age group of 2 to 6 years, it was observed that the trend in change of vocal tract area values from glottis towards the lips is similar to the adult vocal tract shapes [13] [16] [19] [21] with a shift of overall shape towards the glottis end indicating short length of pharyn-geal region as compared to oral cavity [22].
3. Validation of Estimated VTS in Case of Children
For validation of estimated VTSs for various combinations of “M” and “Fs” for a particular age group of chil-dren with average vocal tract length “l”, the overall growth of various sections of vocal tract with respect to age as reported in [22] were used as reference. From literature based on MRI [26]-[28], it is expected that for lower age groups of children, length of oral cavity is more as compared to pharyngeal region in the vocal tract. There-fore, if we observe the entire vocal tract length, we can say that as compared to adults the more variations in vo-cal tract areas could be seen closer to glottis [21]. Overall vocal tract shape in children will still remain the same as that of adults except that there will be shift of all vocal tract area values towards the glottis end indicating a very small length of pharyngeal region where hardly any changes are obtained in area values. In case of some phonemes like /i/ and /u/ produced by lowering lip areas, we observe more transition in area values in pharyn-geal regions near to glottis end which is true for adults as well as children vocal tract shapes [21].
Our results for VTS of children we are unable to compare with the MRI based shapes because MRI images for articulating children are unavailable. Hence, for validation of estimated VTS for children the following crite-rion are used 1) length of pharyngeal region is smaller as compared to oral cavity 2) shift of all area values to-wards the glottis end.
The vocal tract shapes for a 6-year-old and a 7-year-old were matched with the results obtained by Bunton et
al. [23] and Calcum [18] where these authors have used perturbation technique and lip impedance matching
technique respectively for vocal tract shape estimation for children from few specific age groups for certain vowels.
3.1. Validation Results for the Age Group of 2 - 6 Years
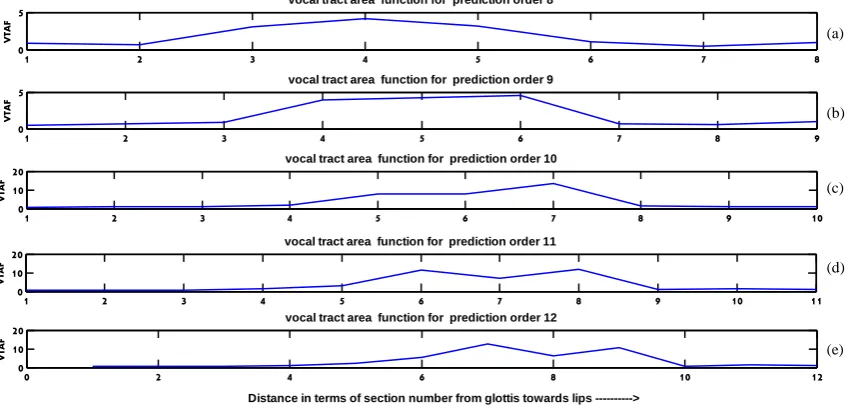
Figures 6(a)-(e), are the results for VTS in terms of vocal tract area function obtained for spoken vowel /a/ by a 6-year-old female child. This child belongs to the age group of 2 - 6 years and results inFigures 6(a)-(e) corre-spond to LPC orders 8, 9, 10, 11 and 12, respectively.
For this age group, it was possible to compare our results with the results obtained by Bunton et al. [23], who
1 2 3 4 5 6 7 8
0 10
20 vocal tract area function for prediction order 8
V
TAF
1 2 3 4 5 6 7 8 9
0 10
20 vocal tract area function for prediction order 9
V
TAF
1 2 3 4 5 6 7 8 9 10
0 10
20 vocal tract area function for prediction order 10
V
TAF
1 2 3 4 5 6 7 8 9 10 11
0 10
20 vocal tract area function for prediction order 11
V
TAF
0 2 4 6 8 10 12
0 10
20 vocal tract area function for prediction order 12
V
TAF
Distance in terms of section number from glottis towards lips --->
* VTAF : estimated crosssectional area of the vocal tract
*
(a)
(b)
(c)
(d)
OALibJ | DOI:10.4236/oalib.1100690 6 July 2014 | Volume 1 | e690
Figure 6. VTAF results obtained for a 6-year-old girl speaking vowel /a/ with LPC order (a) M = 8 (b) M = 9 (c) M = 10 (d) M = 11 (e) M = 12 (Fs = 14 kHz, average VTL l = 10 cm).
has reported a preliminary work on obtaining VTS by using perturbation algorithm which is an indirect tech-nique of VTS estimation other than LPC analysis. For a 6-year-old female speaker speaking vowel /a/ and /i/, the reported experimental results of VTS [23] are shown inFigure 7(a) andFigure 7(b) respectively. The vocal tract area values given by the curve marked as a0(x), inFigure 7(a) andFigure 7(b), is the initial seed function
and the one marked as a360(x) inFigure 7(a) and a194(x) inFigure 7(b) is the final vocal tract area function
ob-tained for vowel /a/ and /i/, after 360 iterations and 194 iterations, respectively in perturbation algorithm used by Bunton et al. [23]. On x-axis, distance from glottis to lips is represented and on y-axis the vocal tract area in square cm is plotted.
Our estimated VTS result using LPC analysis, for 6-year-old female child speaking vowel /a/ as shown in Figures 8(a)-(e), are compared with the VTS obtained by Bunton et al. [23] as shown inFigure 7(a) who has used perturbation technique to obtain VTS for a 6-year-old female child for vowel /a/. His results closely match with our result shown inFigure 6(a). The two peaks (one near to glottis and the other near to lips) in our ob-tained VTS shown inFigure 6(a), for prediction order “8”, coincide in their locations along the vocal tract with the peaks obtained in the curve a360(x) inFigure 7(a).
3.2. Validation Results for the Age Group of 7 - 9 Years
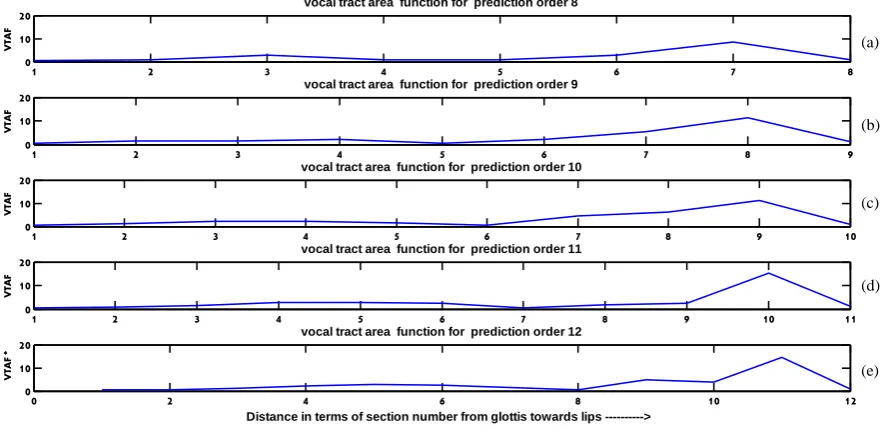
Considering the age group from 7 to 9 years, validation is been done for only one vowel i.e. /i/ for which one result is available from Calcum [18] for comparison purpose. He has used acoustic pulse reflectometry (APR) for estimating VTS for a 7-year-old female child speaking vowel /i/ as shown inFigure 9 and represented vocal tract shape in terms of radial distance from the axis of the vocal tract (axial distance). The plot for VTS obtained by Calcum [18] shows a vocal tract area function (VTAF) in terms of distance from lips to glottis for a vocal tract length of 11.5 cm as shown inFigure 9. All our results are plotted to display VTAF from glottis towards lips.
To enable comparison with the VTS shown inFigure 9, all our obtained vocal tract area values were con-verted to the radii values for the VTS estimated for vowel /i/ spoken by a 7-year-old girl child.
VTS in terms of radial distance from the axis of the vocal tract is estimated for a 7-year-old girl child for spoken vowel /i/ is shown inFigures 10(a)-(e) for different LPC orders. By comparing the estimated results for VTS of a 7-year-old female child speaking vowel /i/ shown inFigure 10(b), withFigure 9, it is found that these results match especially at the highest peak in radii values near to glottis end as well as a small peak near to the
1 2 3 4 5 6 7 8
0 1 2
3 vocal tract area function for prediction order 8
V
TAF
1 2 3 4 5 6 7 8 9
0 1 2
3 vocal tract area function for prediction order 9
V
TAF
1 2 3 4 5 6 7 8 9 10
0 1 2
3 vocal tract area function for prediction order 10
V
TAF
1 2 3 4 5 6 7 8 9 10 11
0 1 2
3 vocal tract area function for prediction order 11
V
TAF
0 2 4 6 8 10 12
0 1 2
3 vocal tract area function for prediction order 12
V
TAF
Distance in terms of section number from glottis towards lips --->
* VTAF : estimated crosssectional area of the vocal tract
*
(a)
(b)
(c)
(d)
OALibJ | DOI:10.4236/oalib.1100690 7 July 2014 | Volume 1 | e690
(a) (b)
Figure 7. (a) VTAF results obtained for a 6-year-old female speaker for vowel /a/ using perturbation algorithm by Bunton et al. [23]. (b) VTAF results obtained for a 6-year-old female speaker for vowel /i/ using perturbation algorithm by Bunton et al.
[image:7.595.92.537.88.318.2][23].
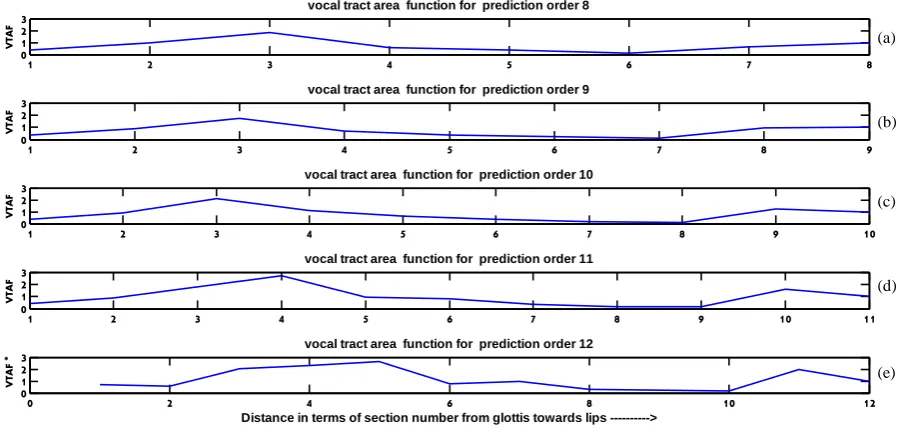
Figure 8. VTAF results obtained for a 6-year-old girl speaking vowel /i/ with LPC order (a) M = 8 (b) M = 9 (c) M = 10 (d) M = 11 (e) M = 12 (Fs = 14 kHz, average VTL l = 10 cm).
lip end. It has been found that VTS corresponding to prediction order “9” is the best match. Hence, it can be concluded based on the validated result that the optimum prediction order for realistic vocal tract shape estima-tion for children in the age group of 7 to 9 years is “9”.
Thus, it was observed that realistic VTS is obtained using LPC order 8 for vowels /a/, /i/ and /u/, spoken by children in the age group 2 to 6 years. Similarly, for the age group of 7 to 9 years optimum LPC order was found to be 9 as shown inTable 1. The summary of optimum algorithm parameters which can be used to obtain realis-tic vocal tract shapes for children is thus presented inTable 1.
Distance from Golttis (cm)
0 2 4 6 8 10 12
Ar
ea
(c
m
2)
F1 = 1028 Hz
F2 = 1543 Hz
F3 = 4200 Hz
11 10 9 8 7 6 5 4 3 2 1 0
a360(x)
a0(x)
Distance from Golttis (cm)
0 2 4 6 8 10 12
Ar
ea
(c
m
2)
F1 = 541 Hz
F2 = 2950 Hz
F3 = 3762 Hz
11 10 9 8 7 6 5 4 3 2 1 0
a194(x)
a0(x)
1 2 3 4 5 6 7 8
0 1 2
3 vocal tract area function for prediction order 8
V
TAF
1 2 3 4 5 6 7 8 9
0 1 2
3 vocal tract area function for prediction order 9
V
TAF
1 2 3 4 5 6 7 8 9 10
0 1 2
3 vocal tract area function for prediction order 10
V
TAF
1 2 3 4 5 6 7 8 9 10 11
0 1 2
3 vocal tract area function for prediction order 11
V
TAF
0 2 4 6 8 10 12
0 1 2
3 vocal tract area function for prediction order 12
V
TAF
Distance in terms of section number from glottis towards lips --->
* VTAF : estimated crosssectional area of the vocal tract
[image:7.595.88.539.369.585.2]OALibJ | DOI:10.4236/oalib.1100690 8 July 2014 | Volume 1 | e690
[image:8.595.96.529.331.550.2]Figure 9. Radii values obtained from lips towards glottis obtained for a 7-year-old female speaker for vowel /i/ us-ing APR technique [18].
Figure 10. Radii values obtained from glottis towards lips, for vowel /i/ spoken by 7-year-old female speaker with LPC order (a) M = 8 (b) M = 9 (c) M = 10 (d) M = 11 (e) M = 12, (Fs = 13 kHz, average VTL, l = 11 cm).
Table 1. Summary of optimum parameters for VTS.
Age group in years Average VTL
l (cm)
LPC order
M
Sampling frequency
Fs in kHz
2 to 5 10 8 14
6 to 9 12 8 or 9 14
10 to 12 13 9 or 10 13.5
13 to 16 14.7 10 or 11 13
17 to 21 16 11 or 12 12
Above 21yrs 17 12 11
Axial distance from lips (m) 0.025
0.02
0.015
0.01
0.005
0
Female
7 Year Old [i]
0 0.05 0.1 0.15 0.2 0.25
R
ad
iu
s
(m
)
11.5 cm
1 2 3 4 5 6 7 8
0 50
vocal tract area function for prediction order 8
V
TAF
1 2 3 4 5 6 7 8 9
0 50
vocal tract area function for prediction order 9
V
TAF
1 2 3 4 5 6 7 8 9 10
0 50
vocal tract area function for prediction order 10
V
TAF
1 2 3 4 5 6 7 8 9 10 11
0 50
vocal tract area function for prediction order 11
V
TAF
0 2 4 6 8 10 12
0 50
vocal tract area function for prediction order 12
V
TAF
Distance in terms of section number from glottis towards lips --->
* VTAF : estimated crosssectional area of the vocal tract
*
(a)
(b)
(c)
(d)
[image:8.595.144.486.609.722.2]OALibJ | DOI:10.4236/oalib.1100690 9 July 2014 | Volume 1 | e690
4. Conclusion
It is concluded that there is a need to appropriately select the vocal tract length based on the average vocal tract length during its development from infancy to adulthood, to use correct LPC order for applying Wakita’s me- thod and proper speech sampling rate while recording speech in order to estimate realistic vocal tract shapes for children using LPC analysis. The realistic shapes of vocal tract are not obtained for all age groups at the same prediction order value. It is observed that as age increases, vocal tract length increases, and therefore for obtain- ing realistic shape, sampling frequency needs to be decreased and value of prediction order to be increased.
References
[1] Nickerson, R.S. and Stevens, K.N. (1973) Teaching Speech to the Deaf: Can a Computer Help? IEEE Transactions on Audio and Electroacoustics, 21, 445-455. http://dx.doi.org/10.1109/TAU.1973.1162508
[2] Bernstein, L., Goldstein, J. and Mahshie, J.J. (1988) Speech Training Aids for Hearing-Impaired Individuals: Overview and Aims. Journal of Rehabilitation Research and Development, 25, 53-62.
[3] Park S.H., Kim, D.J., Lee J.H. and Yoon, T.S. (1994) Integrated Speech Training System for Hearing Impaired. Transactions on Neural Systems Rehabilitation Engineering, 2, 189-196.
[4] Bernstein, L.E., Ferguson, J.B. and Goldstein, M.H. (1986) Speech Training Devices for Profoundly Deaf Children. IEEE International Conference on Acoustics, Speech and Signal Processing, 11, 633-636.
[5] Watson, C.S., Elbert, M. and DeVane, G. (1987) The Indiana Speech Training Aid (ISTRA). The Journal of the Acous-tical Society of America, 81, 95.
[6] Boothroyd, A., Hanin, L., Yeung, E. and Chen, Q. (1992) Video-Game for Speech Perception Testing and Training of Young Hearing-Impaired Children. Proceedings of the Johns Hopkins National Search for Computing Applications to Assist Persons with Disabilities, Laurel, 1-5 February 1992, 25-28.
[7] Mahdi, A.E. (2008) Visualization of the Vocal-Tract Shape for a Computer-Based Speech Training System for the Hearing-Impaired. The Open Electrical and Electronic Engineering Journal, 2, 27-32.
http://dx.doi.org/10.2174/1874129000802010027
[8] Shah, M.S. and Pandey, P.C. (2005) Estimation of Vocal Tract Shape for VCV Syllables for a Speech Training Aid. Proceedings of 27th Annual Conference of the IEEE Engineering in Medicine and Biology Society, Shanghai, 2005, 6642-6645.
[9] Pandey, P.C. and Nagesh, N. (2009) Estimation of Lip Opening for Scaling of Vocal Tract Area Function for Speech Training Aids. National Conference on Communications (NCC), Kharagpur, 3-5 February 2012, 3-5.
[10] Denby, B. and Stone, M. (2004) Speech Synthesis by Real-Time Ultrasound Images of the Tongue. Proceedings of IEEE International Conference Acoustics, Speech, Signal Process, I, 685-688.
[11] Westbury, J.R. (2014) X-Ray Microbeam Speech Production Database User’s Handbook. Version 1.0.
[12] Ziad, A., Lorenzo, T., Richard, M.S. and Bhiksha, R. (2009) Deriving Vocal Tract Shapes from Electromagnetic Ar-ticulograph Data via Geometric Adaptation and Matching. INTERSPEECH’09, 2051-2054.
[13] Story, B.H., Titze, I.R. and Hoffman, E.A. (1996) Vocal Tract Area Functions from Magnetic Resonance Imaging. The Journal of the Acoustical Society of America, 100, 537-554. http://dx.doi.org/10.1121/1.415960
[14] Bresch, E., Kim, Y., Nayak, K., Byrd, D. and Narayanan, S. (2008) Seeing Speech: Capturing Vocal Tract Shaping Using Real-Time Magnetic Resonance Imaging. IEEE Signal Processing Magazine, 25, 123-132.
http://dx.doi.org/10.1109/MSP.2008.918034
[15] Schroeter, J. and Sondhi, M. (1994) Techniques for Estimating Vocal-Tract Shapes from the Speech Signal. IEEE Transaction on Speech and Audio Processing, 2, 133-150.
[16] Mermelstein, P. (1967) Determination of the Vocal-Tract Shape from Measured Formant Frequencies. Journal of the Acoustical Society of America, 41, 1283-1294. http://dx.doi.org/10.1121/1.1910470
[17] Ladefoged, P., Harshman, R., Goldstein, L. and Rice, L. (1978) Generating Vocal Tract Shapes from Formant Fre-quencies. Journal of the Acoustical Society of America, 64, 1027-1035. http://dx.doi.org/10.1121/1.382086
[18] Calum, D. (2005) Acoustic Pulse Reflectometry for Measurement of the Vocal Tract. PhD Thesis, University of Edin-burgh,Edinburgh.
[19] Wakita, H. (1973) Direct Estimation of the Vocal Tract Shape by Inverse Filtering of Acoustic Speech Waveforms. IEEE Transactions on Audio and Electroacoustics, 21, 417-427. http://dx.doi.org/10.1109/TAU.1973.1162506
OALibJ | DOI:10.4236/oalib.1100690 10 July 2014 | Volume 1 | e690
http://dx.doi.org/10.1109/TASSP.1979.1163242
[21] Wankhede, N.S. and Shah, M.S. (2013) Investigation on Optimum Parameters for LPC Based Vocal Tract Shape Esti-mation. 2013 International Conference on Emerging Trends in Communication, Control, Signal Processing & Com-puting Applications (C2SPCA), Bangalore, 10-11 October 2013, 1-6.
[22] Fitch, W. and Giedd, J. (1999) Morphology and Development of the Human Vocal Tract: A Study Using Magnetic Resonance Imaging. Journal of the Acoustical Society of America, 106, 1511-1522. http://dx.doi.org/10.1121/1.427148
[23] Bunton, K., Story, B.H. and Titze, I. (2013) Estimation of Vocal Tract Area Functions in Children Based on Measure-ment of Lip Termination Area and Inverse Acoustic Mapping. ICA 2013 Montreal, Proceedings of Meetings on Acous-tics, 19, Article ID: 060054, 1-8.
[24] Rabiner, L.R. and Schafer, R.W. (1978) Digital Processing of Speech Signals. Prentice Hall, Englewood Cliffs.
[25] O’Shaughnessy, D. (1987) Speech Communication: Human and Machine. Addison-Wesley, Reading.
[26] Vorperian, H.K., Wang, S.B., Chung, M., Schimek, E.M., Durtschi, R.B., Kent, R.D., Ziegert, A.J. and Gentry, L.R. (2009) Anatomic Development of the Oral and Pharyngeal Portions of the Vocal Tract: An Imaging Study. Journal of the Acoustical Society of America, 125, 1666-1678. http://dx.doi.org/10.1121/1.3075589
[27] Vorperian, H.K., Kent, R., Gentry, L. and Yandell, B. (1999) Magnetic Resonance Imaging Procedures to Study the Concurrent Anatomic Development of Vocal Tract Structures: Preliminary Results. International Journal of Pediatric Otorhinolaryngology, 49, 197-206. http://dx.doi.org/10.1016/S0165-5876(99)00208-6
[28] Vorperian, H.K., Kent, R., Lindstrom, M.J., Kalina, C.M., Gentry, L. and Yandell, B. (2005) Development of Vocal Tract Length during Early Childhood: A Magnetic Resonance Imaging Study. Journal of the Acoustical Society of America, 117, 338-350. http://dx.doi.org/10.1121/1.1835958
![Figure 1. Speech analysis model [19].](https://thumb-us.123doks.com/thumbv2/123dok_us/8080923.782279/3.595.137.492.82.323/figure-speech-analysis-model.webp)