Smart HVAC System Control using RF and Zigbees
Shivam Choudhary
MIT ManipalPranav Balachander
MIT ManipalABSTRACT
Many a times the industrial HVAC (Heating Ventilation Air Conditioning) systems do not rely on occupancy. Even if the number of occupants is less it continues to run thus consuming huge amounts of power. Real-time occupancy information can potentially be used to reduce energy consumption. The paper proposes an Arduino based dynamically controlled system which takes occupancy into account and then produces an optimum power solution. The proposed solution can track real-time location of tagged occupants, and report the occupancy at zone level. Using efficient power control mechanisms the efficiency of detection can be maximized and then an optimum solution for power consumption can be determined. Simple ID’s to the RF/Zigbees tags are assigned so that it can be used to track people around a room and report real time occupancy. Then using Gobetwino [1] the details are logged which are then sent to the central server and the exact occupancy is determined. To determine the exact location, Matlab is used to solve optimization equations. Now it has been observed that a person working in an organization has a fixed seat or it has only some minor variations. So using the proposed optimization algorithm it can determine whether that the person will sit in a particular location and then it optimizes the power requirement. So this will help in determining the optimum solution for that person and based on that the power will be delivered to that particular location. The system has been designed as a module so that it can be repeated and scaled to any level. Though at the beginning the system(machine learning algorithm) takes time to find the equilibrium for a particular tag but once it establishes equilibrium it holds on to it and optimizes the power requirement. This paper aims to achieve the solution to the occupancy and optimization problem through a simple Arduino solution.
General Terms
Optimization, RF Tags, Zigbees, SQL Database, Gobetwino
Keywords
Arduino, Occupancy Detection, Energy Database
Management System, RF tags, Zigbees
1.
INTRODUCTION
RF Tags [2] are simple integrated circuits that can be used to transmit and receive data. Generally the ranges of these tags are 50 feet but it varies because of various path losses. They can be readily configured and are available as separate modules. They operate at standard
Radio frequency of 434 MHZ. The proposed design aims to solve the problem of occupancy detection using RF tags. Individual RF tags are assigned to each person. A dynamic database containing information about the RF tags is read and updated. These tags specify a particular location and as soon as a tag is detected, occupancy is detected. The information indicating the occupancy is relayed back to the main control system, which houses the dynamic database containing the previous information about the energy usage of the occupants, which in turn is used to power the system. At a particular time multiple occupancies can be detected by the main system and an optimum power solution to provide sufficient power to all modules can be designed as per requirement. This design can help in regulating the power supply to all modules simultaneously and helps in conservation of energy and improves the overall efficiency of the module.
2.
DESIGN OF THE SYSTEM
2.1
Previous Research
While starting the research several solutions to determine occupancy were explored. Though several designs existed to meet the demands RF TX and RX modules were selected, which work at 433 MHZ. Now this module was programmed using an Arduino and the pins were Manchester encoded and the data which was called “Tag ID” was transmitted. Now the Tag ID data was received at the receiver’s end and that was logged into the system. The data is received serially and these can be viewed on the Arduino Serial monitor.
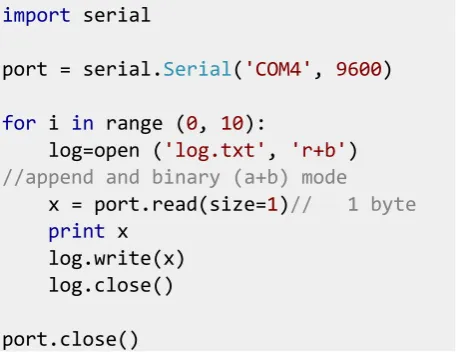
This was a problem for the system. Though the data was readily available in the serial monitor but it could not be logged into any file or any other database system .So a radical method of logging the data was required of logging that data directly through a COM port into a text file such that the file can be directly integrated into the database. There are various ways to do this. One of the ways can be using python to create software that can be used to log the data coming from the COM port. Figure 1 shows a code snippet written in python. It logs the data coming in from COM port 4 into a text file called log.txt. This is a very crude way of logging the data into the text file. This method is simple and it is not easily configurable. One must provide in the details of the COM port and other details every time it changes.
import serial
port = serial.Serial('COM4', 9600)
for i in range (0, 10):
log=open ('log.txt', 'r+b') //append and binary (a+b) mode
x = port.read(size=1)// 1 byte print x
log.write(x) log.close()
[image:2.595.53.282.72.251.2]port.close()
Figure 1: Code Snippet showing the logging of data using Python
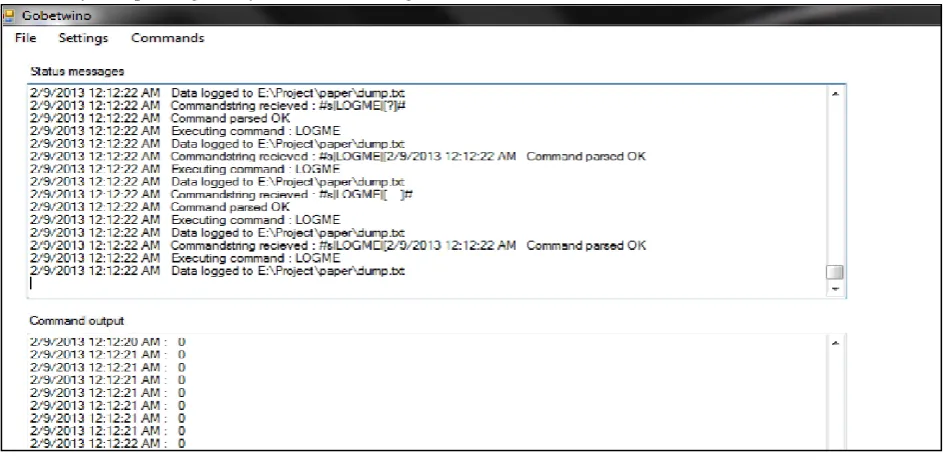
An alternative and a simpler and more user friendly approach is using Gobetwino [1].This is a GUI (Graphical User Interface) based system which can directly access data flowing through the COM port. This works only when a proper preprocessed data directive is assigned to it. Now this program simply logs the data into a text file and then this text file is connected to a database. So whenever a tag which is already present in the database comes into the vicinity of the system it was instantly detected and the data was logged in the server.
The system consists of a MySQL server and then the data was transmitted and stored in this server. Figure 2 and 3 shows the logging details of the data received from the receiver module in the database.
2.2
Problem with RF Tags
Though the design is innovative but it had a serious flaw. It could report the occupancy of a person in a room but could not tell us where exactly the person was. So this would work fine for small rooms where the numbers of occupants are less and there is a need to switch on/off lights when occupancy is detected. Secondly the sensitivity of the tag was up to 20ft so there was always a danger that tags of other people being wrongly detected. Experimentally it was observed even by using black chart papers the read range could only be limited to 17-18 feet. So this method was only applicable for small distances and some radical methods were required to change the method of data acquisition.
2.3
Zigbee Approach
A more fault tolerant and radical method was required to estimate the location at zonal level. For this the RF Modules were replaced by the Zigbee transmitters and receivers. Due to budget constraints the experimental setup consisted of only two Zigbees which were configured to act as a coordinator and as an end device respectively. Now these Zigbees send API packets
through COM ports, which have the advantage that in their BIT 7, RSSI (Received signal strength indicator) value is present. Extracting this information is of prime importance in the project because it indicates the signal strength of the received packet. This strength can indicate the occupancy at a zonal level and can be used to calculate the present occupancy and also the localized position of the person.
[image:2.595.322.544.224.354.2]For the system the Log Path Loss model was used. This model has a path loss exponent value which varies from area to area. Table 1 shows the path loss exponent for different environments.
Table 1: Path Loss exponent [3]values for Log Path Loss Model
So in the experimental setup the value of the path loss exponent was taken as 2. Thus the radius value could now be calculated.
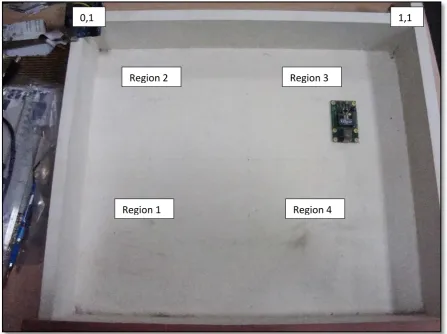
setup. Figure 4 shows the schematic of the experiment. Figure 5 shows the actual experimental setup of the experiment. By interpolating the system the following
[image:3.595.72.544.106.341.2]graph shown in Figure 6 was obtained.
Figure 2: Using Gobetwino to log data from the COM port.
[image:3.595.121.497.380.563.2]Figure 3: Logging the Tag ID directly in the system database (MySQL).
[image:3.595.191.412.603.758.2]Figure 5: Actual experimental setup of the system
Figure 6: By interpolating the system the following graph as shown in Figure 6 was obtained.
2.4
Calculations
Where
Pr= received power
at distance r.
P0= Received power when r=d, in this case d was fixed
to be 85cm(less than Fresnel distance)
R=distance from the antenna (Zigbee coordinator) d=fixed distance 85cm in the test case.
Region 2
Region 4
Region 3
Region 1
Where X,Y are the coordinates of the unknown sender R1 and R2 are the radii found out by the zigbee
calculations.
2.4.1 Obtaining the RSSI value from the Zigbee sender:
The Zigbee sender continuously transmits a data (Tag ID).The data is received in form of packets and then the
RSSI values are calculated from these values. The received packet of a Zigbee has the following format. It is known that “BYTE 7” contains the RSSI strength of the packet.
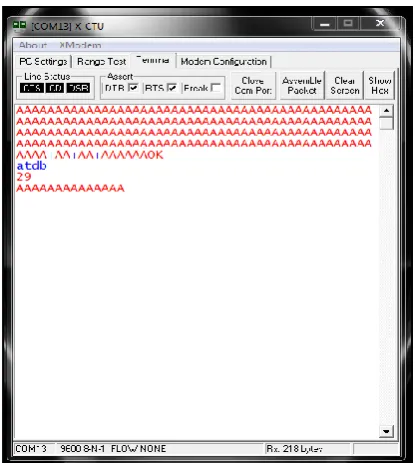
[image:5.595.52.561.186.451.2]Figure 7 shows the received packet format from the Zigbee reciever clearly showing RSSI indicator in packet.
Figure 7: Received packet format from Zigbee Receiver.
Now to obtain the value of this RSSI the following AT command is used.
+++ ATDB
By entering this command the value of RSSI can be obtained in the hex format. Now using the equation obtained in figure 6 the value first can be converted to decimal and then using the approximate equation found by interpolation the hex value can be converted into dBm.
Y= 0.1977X- 87.626
which gives Y as power in dBm and takes X as decimal equivalent of HEX.
[image:5.595.323.531.484.716.2]3.
High Level Design
Buildings operations account for 40% of the total US energy consumption. This corresponds to about $170 Billion worth of cash. One third of this energy is wasted due to inefficiency in buildings controllers. The average household spends about $2000 a year on energy bills, over half of which goes to heating and cooling. This causes a huge wastage of power on the existing power sources. This design can help us in saving huge amount of power and relieves pressure on the existing energy sources. Furthermore the whole HVAC system can be powered using solar panels. The solar panel can be modeled to autonomously provide power or can be used with a battery backup as per the requirement of the users. This makes the whole design environment friendly. Other alternative clean energy sources can be also used. To test new building technologies and to bridge the gap between computer simulation and modeling and the full scale buildings, a small scaled HVAC module was built. The outputs delivered by this module can then be scaled to a larger HVAC system with the same efficiency. The beauty of the design is basically its modularity and its scalability. The system can be expanded and then more features can be added at will.
4.
System Optimization
Once the region is estimated, depending on various factors like individual power consumption and demand, system power supply and time per hour, week usage, and an optimization function is drawn, which needs to be minimized. The constraints are defined by the individual and appliance consumption. The following mathematical model defines the optimization function used in the system:
The variable in the objective function is defined as the units of power consumed by the ith user from the jth appliance. Consider a total of m users and n appliances. The first set of equations are defined according to the consumption of the individual user where the appliance variable j is continuously keeping a fixed i value. The other set of equations defines the appliance consumption for which i variable is varied keeping j constant.
4.1.1 Formulation of optimization functions:
Once the formulation of the model is done, then
solving these equations depends on the constraints
used.
In this case, the equations can be solved using the Simplex and Dual simplex method if the numbers of variables are less. For large number of variables, specialized softwares and tools like Optimization toolbox in Matlab can be used where values are inserted and the required solution is obtained.
A real life scenario can be formulated with the given system constraints:
1) Bulb rating -60 W Philips bulb 2) Fans rating – 75 W Havells
3) Air conditioner – 3750 W (1.1 tonnes) Hitachi 4) Table Lamp – 50 W
Therefore the total power requirement is 60x+75y+3750z+50w
[image:6.595.317.559.359.513.2]Where x, y, z, w denote the number of such systems replicated.
Figure 9: Intersection of the two circles of different radii
[image:6.595.325.554.542.709.2]Table 2: Threshold decision value table
5.
Results and Conclusion
By the simulation it can be seen that the system can save a lot of power when it is used in areas such as offices. This system also optimizes the individual power requirements thereby optimizing the total power requirements. On an average it can save about 5% of the total power which would otherwise have been wasted. The system offers a scalable low cost zone level occupancy detection system which can optimize the power requirement of the individual thereby optimizing the system’s power requirements. It takes care of the individual as well as system’s power consumption and optimizes it. It is easily configurable and very easy to maintain since a Zigbee can support 65536 users it is low cost also.
6. REFERENCES
[1] "Gobetwino." <http://www.mikmo.dk/gobetwino.html>. a software written in python to log on the details from the serial port into a text file.
[2] “434 MHZ Receiver Module for receiving the data” ”<http://www.docstoc.com/docs/97095503/RXB1- SUPER-HETERODYNE-RECEIVER-MODULE---RoboKits>, 434 MHZ Receiver Module Pin Configuration.
[3] “Path Loss Exponent Values for different areas” <http://www.ntia.doc.gov/legacy/ntiahome/fccfilings/200
5/cogradio/ETDocket03-108APPENDIXB-E_02152005.htm> [4] MRF24J20 Datasheet
[5] “XCTU Terminal”, A test utility software to configure and use Zigbees
[6] Implementation of wireless sensor actuator network on a scaled sustainable HVAC system. Nirav Patel and Fisal Sayed, Cornell University.