Knowledge based Self Initializing FCM Algorithms
for Fast Segmentation of Brain Tissues in
Magnetic Resonance Images
T. Kalaiselvi
Assistant ProfessorDepartment of Computer Science and Applications Gandhigram Rural Institute – Deemed University
Dindigul District - 624302, Tamil Nadu, India
K. Somasundaram
ProfessorDepartment of Computer Science and Applications Gandhigram Rural Institute – Deemed University
Dindigul District - 624302, Tamil Nadu, India
ABSTRACT
This paper presents two robust FCM algorithms to segment the brain tissues from MRI volume. The core regions of human brain are white matter (WM), gray matter (GM), cerebrospinal fluid (CSF) and others known as background (BCK). Usually, to classify the given data, random initial seeds are selected and then the FCM procedure is iterated until the centroids of cluster converge. The first proposed FCM, named as FCM-EXPERT, make use of the expert knowledge about the brain tissue properties to select the initial seed points. Experimental results on brain portions extracted from large MRI database show that this method is faster by 1.3 to 1.7 times than that of the traditional FCM in segmenting brain tissues. FCM-EXPERT has been again modified by making use of the correlation existing between brain regions in adjacent slices of MRI for centroid initialization and named as FCM-EXPERT-E. Experimental results of the second method show that this is faster by 2 to 4 times than that of traditional FCM.
General Terms
Image Segmentation, Clustering, Self Initialization.
Keywords
FCM clustering; brain tissues segmentation; centroid initialization; brain continuity; slice correlation; MRI scans.
1.
INTRODUCTION
Segmentation plays an important role in biomedical image processing. It is often the starting point for other processes like analysis, visualization, quantization and modeling. This is a core technique to study about the anatomy and pathology of human organs. In brain diagnostic system, segmentation is essential to study any brain related disorders like seizures, stroke, multiple sclerosis, aneurisms, hemorrohages, brain tumors, brain cancers, brain atrophy, lesions, and sub structural changes. Three main regions of brain, white matter (WM), gray matter (GM) and cerebrospinal fluid (CSF) are the important subjects of study in brain diagnostic system. Manual segmentation of these three brain regions by an expert is time consuming, inconsistent and affected by operator bias as the volume of data involved in MRI studies is usually large. Hence an automatic segmentation of brain regions is essential for a physician to speed up their diagnostic process.
Segmentation techniques are broadly classified into two types: supervised and unsupervised [1]. Supervised methods require the user interaction and thus known as semi-automatic.
segment the regions in feature space with a high density. Fuzzy C-Means (FCM) is an unsupervised clustering method. It automatically segments the region of interest (ROI) by classifying a tissue into several classes at the same time but with different degrees [2] [3] [4]. A study [5] revealed that FCM never misses a region and it is the best method for segmenting anisotropic nature of brain volumes that are affected by partial volume effect (PVE).
FCM algorithm employs fuzzy partitioning such that a data point can belong to all clusters with different membership grades between 0 and 1. This method is frequently used in pattern recognition. The aim of FCM is to find cluster centers that minimize a dissimilarity (objective) function. By iteratively updating the cluster centers and the membership grade for each data point, FCM iteratively moves the cluster centers to the “right” location within a data set. But it does not ensure that it converges to an optimal solution in an optimal time, if the cluster centers (centroids) are initialized randomly. The performance of FCM depends on initial centroids of required clusters [6] [7]. Hence the selection of a centroid is important in FCM. For a robust approach there are two ways to select the centroids.
Run the FCM several times each starting with different initial centroids and select the best initial values for the centroids
Use application specific expert knowledge and select the initial centroids
The first approach becomes a supervised clustering technique and do not qualify to be a fully automatic method. Further it takes more time to identify the initial centroids. If the details about the data point density of the application are known prior then the second approach is preferable to generate the initial centroids.
This paper proposed two FCM methods that generate initial seeds by making use of the expert knowledge about the tissue properties appearing in the MRI of human head scans. FCM is a soft segmentation technique applicable for MRI brain tissues segmentation. The performance of FCM, to obtain an optimal solution depends on the selection of the initial positions of their centroids. In the existing FCM, the number of clusters is usually set by the users and their centroids are initialized randomly. This process generally takes time to reach the optimal solution. In order to accelerate the segmentation process, an application specific knowledge is used to initialize the centers of required clusters. To segment brain portion, the knowledge about the MRI intensity characteristics of brain regions is used to initialize the centroids. In the first method, FCM_EXPERT, the centroids are initialized using the intensity levels of the WM, GM, CSF and BCK. In the second method, FCM_EXPERT_E, the correlation existing between adjacent slices of an MRI volume is utilized. The final centroids obtained for the previous slice is used as initial centroid for the current slice. These methods are then applied on the brain portion extracted from MRI, and segmented the WM, GM and CSF.
The remaining part of this paper is organized as follows. In section 2, the existing FCM algorithm and the proposed methods used for brain tissue segmentation are given. In section 3, the materials used are given. The results and discussion are presented in section 4. The conclusion is given in section 5.
2.
METHOD
2.1
Fuzzy C-Means Method (FCM)
FCM based clustering was originally introduced by Jim Bezdek in 1981 [3] [4]. The FCM algorithm attempts to partition a finite collection of elements
x
x
x
n
X
1,
2,...,
into a collection of c fuzzy clusters with centers V = vi, i=1, 2,…c and a partition or membership
matrix, U = uij, i=1, 2,…n, j=1, 2,…c where uijis a numerical
value in [0, 1] that tells the degree to which the element xi
belongs to the jth cluster.
The goal of FCM algorithm is to minimize the following objective function: ij c j m ij n i
m
u
d
J
1 1
,
(1)
where,
j i
ij
x
v
d
(2)
1
,
m
is a scalar termed as weighting exponent. m controls the fuzziness of the resulting clusters andd
ij is theEuclidian distance from object
x
i to the clustercenter vj. Thecentroid of the jth cluster, vj is obtained as:
n i m ij n i i m ij ju
x
u
v
1 1,
(3)
where,
c k m ik ij ijd
d
u
1 1 21
(4)
The following is the conventional FCM algorithm [3].
Step 1: Select the number of clusters c (2 ≤ c ≤ n), exponential weight m, initial membership matrix U and the termination/stopping criterion.
Step 2: Compute the cluster centers
v
j,
j
1
,
2
,...,
c
, according to equation (3)Step 3: Compute Euclidian distance
c
j
n
i
d
ij,
1
,
2
,...,
;
1
,
2
,...,
based on equation (2)Step 4: Update the membership function
c
j
n
i
u
ij,
1
,
2
,...,
;
1
,
2
,...,
using the equation (4)Step 5: If not converged, go to step 2.
Step 6: Output uij and
v
j, the membership function and centroids of the data.The FCM algorithm starts by setting values for the number of clusters (c), weighing factor (m), initialization of U and termination criterion as given in step 1. The number of clusters is either supplied by the user during the process or automatically computed by the application. There is no fixed rule for choosing m, however, in many applications m=2 is a common choice. In case of crisp clustering „m‟ may be chosen as 1.
The membership function matrix uij, contains the grade of
membership of each object in each cluster. The values 0 and 1 indicate no membership and full membership respectively. Grades between 0 and 1 indicate that the object has partial membership in a cluster. Hence the summation of each row (total grades of an object) should be equal to unity. One more attribute of FCM is that it never leaves any region as blank [5]. These attributes are used to define the characteristics of fuzzy matrix uij and are defined as follows [6]:
0
,
1
ij
u
i
1
,
2
,...,
n
;
j
1
,
2
,...,
c
(5)
1
1
c j ijn
u
n
i ij
1
0
j
1
,
2
,...,
c
(7)
The FCM algorithm starts with the initialization of this membership function uij as given in step 1 of FCM algorithm.
In general, this is done by using random number generator and to satisfy the aforesaid three constraints of uij. Then the
matrix uij is used to generate the cluster centers (step 2 of
FCM algorithm).
Several stopping criteria can be used for convergence. The most generalized convergence criteria can be stated as follows:
i. Set the number of iterations as maximum as possible, or
ii. The objective function
J
m defined in equation(1) cannot be minimized any further significantly, oriii. The centroids no longer move in successive iterations.
Among these three criterions, the first two requires a user input in the form of number of iterations and value of error factor respectively. But the third one is a self generated one and does not require any external input. A comparative study [7] between these criteria showed that the third criterion yield results much faster than the other two. So the third is chosen as a stopping criterion for both the existing and proposed FCM methods.
2.2
Proposed Method (FCM-EXPERT)
As explained in the previous section, the performance of FCM algorithm depends on the selection of number of clusters c and their centroids v. The major ROI of human brain image is GM, WM, CSF and the surrounding background (BCK). Hence for brain tissue segmentation c is fixed as 4. The brain tissues are characterized by their intensity values in MRI scans. This expert knowledge is used to initialize the centroids. As the performance of the FCM depends on the initial position of the centroids, they can be initialized by selecting the intensity levels corresponding to the tissues instead of selecting them randomly. This will yield better results and quicken the process. This method is named as FCM-EXPERT.Imaging characteristics of MRI scans
The images produced by MRI scans are usually gray images with intensity in the range 0-255. The GM of the brain consists of the cortex that lines the external surface of the brain and the gray nuclei deep inside of the brain, including the thalami and basal ganglia. WM is comprised of the neuronal axons that interconnect different regions of the brain and serve as the interface between the brain and the rest of the body. The watery fluid, CSF acts as a cushion for physical shocks. The WM constitutes a connected region that is bordered by GM and CSF as shown in Fig.1. For the display purpose WM is shown in gray color, GM as white color and CSF as black color. In MRI of head scans, the picture of brain organ is usually surrounded by air particles, known as background, BCK in order to make a matrix representation. This BCK is another major ROI in MRI of head scans.
Jeny et al [14] analyzed the intensity characteristics of T1 MRI of head regions and generated a histogram of skull
peak corresponds to gray matter and the last peak corresponds to white matter. The three peaks are used in their semi-automatic tool, BrainAssiatTM to separate the brain region. In this paper, the values of these peaks are used to initialize the centroids for the FCM method.
[image:3.595.314.562.133.329.2]Fig. 1. Segmentation results in MRI of axial head scan
Fig. 2. Histogram of a skull stripped T1 weighted MRI
Initialization of centroids
In the intensity characteristics of MRI brain scans, the brain region lies in four major gray ranges, darkest, dark / dark gray, gray and bright representing BCK, CSF, GM, WM in T1 weighted images and BCK, WM, GM, CSF in T2 weighted images.
Hence the initial centroids for these four regions of gray scale image can be fixed as follow:
The lowest intensity 0 is considered as cluster center for darkest region, always background (BCK)
The highest intensity 255 is fixed as centroid for bright region
In between, an equal interval is assumed based on the peaks of Fig.2 and the values 85 and 170 are taken as centroids for dark gray and gray regions.
White Matter (WM)
Gray matter
(GM)
Cerebrospinal fluid (CSF)
[image:3.595.321.544.379.499.2]Hence the intensity values 0, 85, 170 and 255 are taken as initial centroids for the four regions to start the FCM algorithm in the proposed method, FCM-EXPERT.
The FCM-EXPERT algorithm is given below,
Step 1: Initialize the cluster centroids
v
j,
j
1
,
2
,
3
,
4
using the given values.Step 2: Compute Euclidian distance
4
,
3
,
2
,
1
;
,...,
2
,
1
,
i
n
j
d
ij usingequation (2)
Step 3: Compute the membership function
u
ij,4
,
3
,
2
,
1
;
,...,
2
,
1
n
j
i
using equation(4)
Step 4: Update the cluster centers
v
j,
j
1
,
2
,
3
,
4
, using equation (3)Step 5: If none of the centroids(
v
j,
j
1
,
2
,
3
,
4
) changes in step 4, stop; otherwise go to step 2Step 6: Output
u
ijandv
j, the membership function and centroids of the data.2.3
Extension of the proposed Method
(FCM-EXPERT-E)
In MRI of head scan, there is a continuity of the brain portion between two adjacent slices. Therefore there should be high correlation between the two adjacent brain areas. Brummer et al., [15] have suggested that this continuity property of brain in a volume could be exploited in neighboring slices to select the ROI. The brain extraction algorithms (BEA) [15] [16] [17] used this concept to extract the brain volume from the MRI volume. This property is used to quicken the proposed FCM-EXPERT method and named it as FCM-FCM-EXPERT-E. The flowchart for FCM-EXPERT-E is shown in Fig.3.
The algorithm for FCM-EXPERT-E is given below.
Step 1: Input the MRI of head scans (volume).
Step 2: Extract the brain volume from MRI volume using BEA.
Step 3: Find the middle slice (M) from the MRI brain volume.
Step 4: Divid the brain volume into two sub volumes: lower slices (LS) lying below the M and upper slices (US) lying above M.
Step 5: The LS range is M-1 to bottom-end (BE) of volume and US range is M+1 to top-end (TE) of volume
Step 6: Apply the FCM-EXPERT on the middle slice M by taking initial centroids as 0, 85, 170, 255 and compute the final centroids.
Step 7: Move one slice up in US volume (one slice down in LS volume) by taking the final centroids of the previous slice as initial centroids and apply FCM-EXPERT.
Step 8: Repeat step 7 until TE (BE) is reached.
3.
MATERIALS
Twenty datasets of T1 and T2 types obtained from different sources are used for the experiments. Ten T1 coronal volumes of normal subjects were obtained from the „Internet Brain Segmentation Repository‟ (IBSR) developed by Centre for Morphometric Analysis (CMA) at Massachusetts General Hospital [19]. Each IBSR dataset has approximately 60 slices per volume with slice thickness = contiguous 3.1 mm and slice matrix = 256
256. Another ten T2 axial datasets consisting of normal and abnormal volumes with brain tumor were taken from the website „The Whole Brain Atlas‟ (WBA) maintained by Department of Radiology and Neurology at Brigham and Women‟s Hospital, Harvard Medical School [20], and from KGS Advanced MR and CT Scans, India. WBA volume consists approximately 25 slices with slice size 256
256 and slice thickness 5mm. KGS has approximately 20 slices per volume with slice matrix = 448
512 and slice thickness 7mm along with inter slice gap. KGS scans are much affected by partial volume effect (PVE) artifact.4.
RESULTS/DISCUSSION
The experiments are carried out using the conventional FCM algorithm and the two proposed algorithms FCM-EXPERT and FCM-EXPERT-E on the images chosen from the material pool.
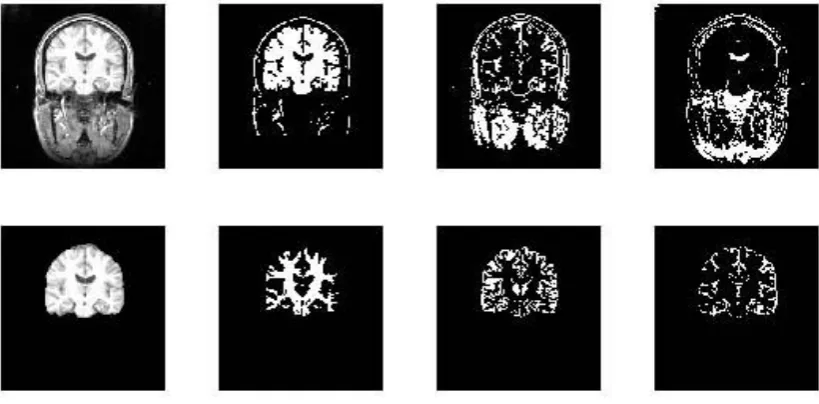
Initially a qualitative performance evaluation of these methods on original MR scan was done. The segmentation results obtained are shown in Fig.4. The first row shows the segmentation results obtained for original MRI of head scan and the second row for skull stripped brain portion of the same slice. For the original image given in row 1 of Fig.4, some of the surrounding non-brain regions like fat, skin, bone and neck portions are misclassified as the required ROIs. But when these methods were applied on brain portion extracted from the original image, the FCM algorithm gave more accurate classifications as given in row 2 of Fig.4. This type of testing was done on several volumes and found that the segmentation on extracted brain produced accurate results. Hence, for further validation, the methods were applied on the brain portion extracted from the MR scans using the brain extraction algorithms [15] [16].
Fig. 4. Segmentation results on raw and extracted brain image. Row 1 shows the segmentation of raw MRI scans and row2 shows the segmentation of the brain portion extracted from the original. Column 1 shows the original head scan and the extracted brain in row 1 and row2. The three ROIs, WM, GM and CSF of head and brain obtained by FCM are in column 2-4
respectively.
Table 1. The average number of iterations, cluster centers and segmentation time of MRI volumes
Data Source
Data set
FCM Method
FCM Conventional FCM-EXPERT FCM-EXPERT-E No.
iter
Final Centroids Proc. Time
No. iter
Final Centroids Proc. Time
No. iter
Final Centroids Proc. Time C1 C2 C3 C4 C1 C2 C3 C4 C1 C2 C3 C4
IBSR
vol 1 19 0 143 202 249 4.74 14 0 143 202 249 3.33 4 0 144 203 249 0.778
vol 2 19 0 126 172 217 3.29 10 0 126 172 217 2.11 8 0 127 173 217 1.447
vol 3 19 0 136 193 243 3.49 13 0 135 192 243 2.37 5 0 137 194 244 0.896
vol 4 19 0 140 194 248 3.70 13 0 138 193 248 2.40 6 0 140 194 248 1.034
vol 5 18 0 144 207 248 3.15 14 0 143 206 248 2.65 4 0 144 207 248 0.78
vol 6 19 0 138 196 246 3.34 13 0 137 195 246 2.24 4 0 139 196 247 0.76
vol 7 18 0 144 208 250 3.35 14 0 143 208 249 2.55 5 0 144 209 250 0.793
vol 8 18 0 140 203 249 3.26 13 0 140 203 249 2.47 4 0 141 204 249 0.75
vol 9 18 0 134 200 247 3.11 13 0 134 199 247 2.23 4 0 135 200 248 0.778
vol 10 18 0 136 204 249 3.07 13 0 135 203 249 2.26 4 0 136 204 250 0.757
Avg
19 0 138 198 245 3.45 13 0 137 197 245 2.46 5 0 139 198 245 0.877
WBA
vol 11 20 0 89 128 195 4.85 13 0 90 130 198 2.99 9 0 90 130 197 2.145
vol 12 21 0 75 114 208 5.10 16 0 76 116 210 3.10 7 0 76 115 210 1.172
vol 13 23 0 84 124 201 5.00 15 0 84 127 204 3.02 9 0 84 125 203 1.527
vol1 4 21 0 112 147 208 4.62 9 0 113 150 211 1.68 6 0 112 149 210 1.07
vol 15 21 0 79 121 187 5.64 15 0 80 124 188 3.84 6 0 80 122 187 1.492
Avg
21 0 88 127 200 5.04 14 0 89 129 202 2.93 7 0 88 128 201 1.481
KGS
vol 16 23 0 69 97 166 15.10 17 0 70 100 169 11.68 10 0 70 98 167 5.752
vol 17 21 0 69 97 153 12.89 19 0 70 99 157 11.44 9 0 70 98 156 5.225
vol 18 26 0 73 103 162 15.33 17 0 74 104 165 10.45 11 0 74 100 159 6.528
vol 19 23 0 71 100 163 14.26 17 0 72 103 167 10.86 10 0 74 104 164 5.661
vol 20 25 0 73 98 156 16.59 18 0 74 101 160 11.65 9 0 72 103 166 5.378
Avg
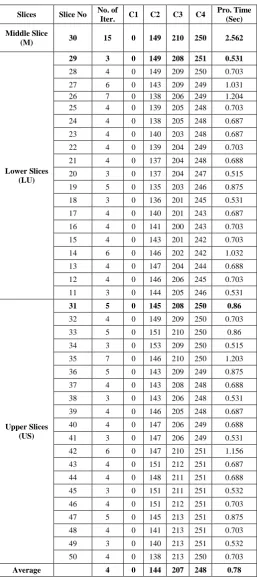
Table 2.Performance of FCM-EXPERT-E for vol 5 of IBSR
Slices Slice No No. of
Iter. C1 C2 C3 C4
Pro. Time (Sec) Middle Slice
(M) 30 15 0 149 210 250 2.562
Lower Slices (LU)
29 3 0 149 208 251 0.531
28 4 0 149 209 250 0.703
27 6 0 143 209 249 1.031
26 7 0 138 206 249 1.204
25 4 0 139 205 248 0.703
24 4 0 138 205 248 0.687
23 4 0 140 203 248 0.687
22 4 0 139 204 249 0.703
21 4 0 137 204 248 0.688
20 3 0 137 204 247 0.515
19 5 0 135 203 246 0.875
18 3 0 136 201 245 0.531
17 4 0 140 201 243 0.687
16 4 0 141 200 243 0.703
15 4 0 143 201 242 0.703
14 6 0 146 202 242 1.032
13 4 0 147 204 244 0.688
12 4 0 146 206 245 0.703
11 3 0 144 205 246 0.531
Upper Slices (US)
31 5 0 145 208 250 0.86
32 4 0 149 209 250 0.703
33 5 0 151 210 250 0.86
34 3 0 153 209 250 0.515
35 7 0 146 210 250 1.203
36 5 0 143 209 249 0.875
37 4 0 143 208 248 0.688
38 3 0 143 206 248 0.531
39 4 0 146 205 248 0.687
40 4 0 147 206 249 0.688
41 3 0 147 206 249 0.531
42 6 0 147 210 251 1.156
43 4 0 151 212 251 0.687
44 4 0 148 211 251 0.688
45 3 0 151 211 251 0.532
46 4 0 151 212 251 0.703
47 5 0 145 213 251 0.875
48 4 0 141 213 251 0.703
49 3 0 140 213 251 0.532
50 4 0 138 213 250 0.703
Average 4 0 144 207 248 0.78
Finally, the proposed FCM_EXPERT-E was applied on the selected MRI volumes. Table 2 shows the relative change of centroids and iterations for lower slices (LS), upper slices (US) and the middle slice (M) for vol 5 of IBSR. It is observed that only the slice M requires 15 iterations to reach the convergence. The final centroid produced for slice M is used to initialize the adjacent slices 29 and 31, lying above
is used to initialize their adjacent slice and executed the FCM-EXPERT-E algorithm.
1.481 seconds/slice for WBA and 5.709 seconds/slice for KGS. This method is 3.93 times faster than conventional FCM and 2.8 times faster than FCM-EXPERT of IBSR volumes. For WBA, it is observed that the proposed method FCM-EXPERT-E is 3.4 times faster than conventional FCM and 1.98 faster than FCM-EXPERT. For KGS datasets, it is found the same trend and the proposed method FCM-EXPERT-E is 2.6 and 1.97 times faster than conventional FCM and FCM-EXPERT. This shows that the proposed FCM-EXPERT-E based segmentation is 3 to 4 times faster for normal volumes, 2 to 3 times faster for abnormal volumes and 2 times faster for PVE volumes than the conventional FCM and FCM-EXPERT method.
The experiments were performed in a 1.73 GHz Intel Pentium dual-core processor, Windows XP with 1GB RAM, using Matlab 6.5.
5.
CONCLUSION
The performance of Fuzzy-C-Means (FCM) clustering algorithm depends on the initialization of the seed points. This paper proposed two novel seed initialization methods for the conventional FCM algorithm. The initialization is done based on the domain specific expert knowledge of the MRI of human head scans. In the first method, the seed initialization is done using the WM, GM and CSF properties in MRI. Application of this method on brain portion extracted from publically available T1 and T2 weighted MRI of human head scans show that the first proposed method FCM_EXPERT is faster by 1.32 to 1.72 times than that of the traditional FCM in segmenting WM, GM and CSF. In the second seed initialization method, FCM-EXPERT-E, the correlation existing between the adjacent slices of an MRI volume is exploited. This method is faster by 2 to 4 times than the conventional method in segmenting WM, GM and CSF. The experiments show that a domain specific knowledge can be effectively used to initialize the centroids of FCM method.
6.
ACKNOWLEDGMENTS
The authors wish to thank Dr. K.G. Srinivasan MD., RD., Consultant Radiologist, KGS Advanced MR & CT Scan, Madurai, Tamilnadu, India for providing the MR Head scans.
REFERENCES
[1] Jain, A. K., Murty, M. N. and Flynn, P. J. 1999. Data Clustering – A Review, ACM Computing Survey, 31(3), 265-322.
[2] Dunn, J. C. 1973. A Fuzzy Relative of the ISODATA Process and Its Use in Detecting Compact Well-Separated Clusters, Journal of Cybernetics, 3, 32-57.
[3] Bezdek, J. C. 1981. Pattern Recognition with Fuzzy Objective Function Algorithms, Plenum Press, New York.
[4] Pal, N.R. and Bezdek, J.C. 1995. On Cluster Validity for the Fuzzy C-Means Model, IEEE Transactions on Fuzzy Systems, 3(3), 370-379.
[5] Somasundaram, K. and Kalaiselvi, T. 2009. A Comparative Study of Segmentation Techniques Used for MR Brain Images, International Conference on Image Processing, Computer Vision, and Pattern Recognition, Las Vegas, Nevada, USA, (July 13-16), 597-603.
[6] Izakian, H. and Abraham, A. 2011. Fuzzy C-means and Fuzzy Swarm for Fuzzy Clustering Problem, Expert Systems with Applications, 38, 1835–1838.
[7] Kalaiselvi, T. and Somasundaram, K. 2010. Fuzzy C-Means Technique with Histogram Based Centroid Initialization for Brain Tissue Segmentation in MRI of Head Scans, IEEE sponsored 2011 International Symposium on Humanities, Science & Engineering Research – SHUSER2011, Kuala Lumpur, Malaysia, (June 5-7), 155-160
[8] Kannan, S.R., Ramathilagam, S., Devi, R. and Sathya, A. 2011. Robust kernel FCM in segmentation of breast medical images, Expert Systems with Application, 38, 4382–4389.
[9] Wang, J., Kong, J., Lu, Y., Qi, M. and Zhang, B. 2008. A modified FCM algorithm for MRI brain image segmentation using both local and non-local spatial constraints, Computerized Medical Imaging and Graphics, 32(8), 685-698.
[10] Chuang, K.S., Tzeng, H.L., Chen, S., Wu, J. and Chen, T.J. 2006. Fuzzy c-means clustering with spatial information for image segmentation, Computerized Medical Imaging and Graphics, 30, 9-15.
[11]Ji, Z.X., Sun, Q.S. and Xia, D.S. 2011. A modified possibilistic fuzzy c-means clustering algorithm for bias field estimation and segmentation of brain MR image, Computerized Medical Imaging and Graphics, 35(5), 383-397.
[12]Ahmed, M.N., Yamany, S.M., Mohamed, N., Farag, A.A. and Moriarty, T. 2002. A Modified Fuzzy C-Means Algorithm for Bias Field Estimation and Segmentation of MRI Data, IEEE Transactions on Medical Imaging, 21(3), 193-199.
[13]Moussaoui, A., Benmahammed, K., Ferahta, N. and Chen, V. 2005. A New MR Brain Image Segmentation Using an Optimal Semi-supervised Fuzzy C-Means and pdf Estimation, Electronic Letters on Computer Vision and Image Analysis, 5(4), 1-11.
[14]Jeny, R., Kannan, K., Thomas, F., Kesavadas, C. and Chandrasekhar, P. S. 2008. MR Brain volume Analysis Using BrainAssist, International Conference on Systematic, Cybernetics and Informatics – ICSCI2008, India, (January 2008).
[15]Somasundaram, K. and Kalaiselvi, T. 2010. Brain Extraction Method for T1 Magnetic Resonance Scans, IEEE International Conference on Signal Processing and Communication, Indian Institute of Sciences (IISc), Bangalore, India, (July 18-21), 1-5.
[16] Somasundaram, K. and Kalaiselvi, T. 2010. Fully Automatic Brain Extraction Algorithm for Axial T2-Weighted Magnetic Resonance Images, Computers in Biology and Medicine, 40(10), 811-822.
[17]Somasundaram, K. and Kalaiselvi, T. 2011. Automatic Brain Extraction Methods for T1 Magnetic Resonance Images using Region Labeling and Morphological Operations, Computers in Biology and Medicine, 41(8), 716-725.
[18]Brummer, M.E., Mersereau, R.M., Eisner, R.L. and Lewine, R.J. 1993. Automatic Detection of Brain Contours in MRI Datasets, IEEE Transactions on Medical Imaging, 12(2), 153-166.
[19]http://www.cma.mgh.harvard.edu/ibsr/index.html