Estimating Carbon Dioxide and Particulate Matter
Emissions from Ships using Automatic Identification
System Data
Arnélio Sérgio Mabunda
Laboratoire d’Informatique,Systèmes et Télécommunications Faculté des Sciences et Techniques - Université Abdelmalek Essaadi Ancienne Route de l’Aéroport, Km 10, Ziaten. BP: 416. Tanger
– Maroc
Abdelali Astito
Laboratoire d’Informatique,Systèmes et Télécommunications Faculté des Sciences et Techniques - Université Abdelmalek Essaadi Ancienne Route de l’Aéroport, Km 10, Ziaten. BP: 416. Tanger
- Maroc
Salaheddine Hamdoune
Laboratoire d’Informatique,Systèmes et Télécommunications Faculté des Sciences et Techniques - Université Abdelmalek Essaadi Ancienne Route de l’Aéroport, Km 10, Ziaten. BP: 416. Tanger
- Maroc
ABSTRACT
This paper proposes a method for estimating emissions of carbon dioxide (CO2) and particulate matter (PM) from ships
using Automatic Identification System (AIS) data. The method can be summarized in three steps : 1) capture of AIS data, 2) estimation of ships resistance, propulsion power, engine power and fuel consumption, 3) estimation of CO2 and
PM emissions based on fuel consumption.
The method has been developed to carry out a computer application for monitoring in real-time CO2 and PM emissions
from ships sailing in the Strait of Gibraltar. A system for receiving AIS data broadcasted by ships sailing in the Strait of Gibraltar has been installed.
Keywords
Maritime pollution, Strait of Gibraltar, AIS data, ships, real-time system
1.
INTRODUCTION
The Strait of Gibraltar is an important shipping route for merchant and passenger ships, this is one of the most used sea lanes in the world. It is difficult to have an exact number of maritime traffic in this region because there is no authority or observatory to this statistic [1], but some sources claim that about 100 000 ships cross the Strait each year.
Ships emit exhaust gases in the atmosphere and some of these gases are harmful to the environment in general. We believe that it's important to know and monitor the level of pollution caused by the maritime traffic in this region, especially that of carbon dioxide (CO2) and particulate matter (PM). CO2 and
PM are known respectively as greenhouse gas [2] and carcinogenic dust [3].
Some papers propose methods for estimating CO2 and PM
emissions from ships using Automatic Identification System (AIS) data in Baltic Sea [4] or in Madura Strait area [5], but there is no papers related to the strait of Gibraltar. Furthermore, these methods do not take into account real-time emissions. The purpose of the method presented in this paper is to use AIS data to establish a maritime monitoring system to estimate in real time CO2 and PM emissions from ships
sailing in the strait of Gibraltar.
This method is largely based on the mathematical formulas used in the naval architecture. This method does not take into account ships moored or berthed in ports. Furthermore, the method evaluates only the emissions produced by the main engine, excluding auxiliary engines and boilers.
2.
MATERIALS AND METHODS
2.1
AIS data
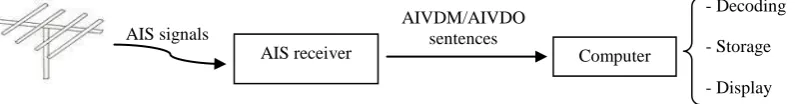
Automatic Identification System (AIS) is a telecommunication system used on ships and by vessel traffic services for exchanging data with other nearby ships and AIS base stations. Data transmission is done through electromagnetic waves VHF (Very High Frequency). The AIS sends static data such as Maritime Mobile Service Identity (MMSI), length overall, breadth, draught (height of the ship's submerged portion), ship type, ship name, etc. The system provide also dynamic data such as speed, geographical position, direction, destination, etc.. Dynamic data is sent every 2 to 10 seconds and static data is sent every 6 minutes. Since 2004, the International Convention for the Safety of Life at Sea (SOLAS) [6] requires that all vessels greater than 300 tons gross tonnage engaged on international voyages to be fitted with AIS.
VHF Antenna
AIS receiver
AIVDM/AIVDO sentences
Computer
[image:1.595.77.475.691.743.2]28 A system for receiving AIS data has been installed in LIST
laboratory (Laboratoire d'Informatique, Systèmes et des télécommunications). The system consists of an AIS receiver, a VHF antenna and a computer for data collection and display (Figure 1).
2.2
Overview of the installed AIS receiving
system
The AIS receiver is connected to computer through RS232 connector and data is transmitted to computer in AIVDM/AIVDO sentences [7]. In the computer, we developed a program that decodes, stores on database and displays data on a map (Figure 2). The decoding AIVDM/AIVDO sentences algorithm was based on the guidelines of the document [7].
[image:2.595.64.272.309.449.2]This system operates in real time and covers the western side of the Strait of Gibraltar and the northern side of the Moroccan Atlantic coast (Figure 2). The program graphical user interface (GUI) displays static and dynamic data related to ships detected (Figure 2).
Fig 2: Screenshot of the program GUI showing ships sailing in the Strait of Gibraltar. This screenshot was
taken on 10th January 2014
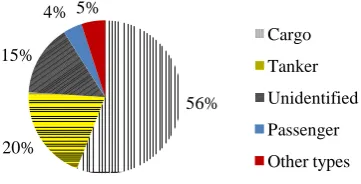
The system developed records the crossing of 140 ships per day average of which 56% are cargo ships, 20% tanker ships, 4% passenger ships, 5% other types of ships and 15% ships unidentified (Figure 3).
2.3
Proposed method for estimating CO
2and PM emissions
In order to evaluate the CO2 and PM emissions, four data have
to be estimated : ship resistance, propulsion power, main engine power and fuel consumption. Figure 4 summarizes the steps in the model to estimate CO2 and PM emissions using
AIS data.
2.3.1 Ship resistance (RT)
According to the International Towing Tank Conference (ITTC) [8], ship resistance is defined by :
V S
CT 2
2 1
RT (1)
Where: CT is the total resistance coefficient, S is the wetted
surface area of the hull, V is the ship navigation speed and ρ is the mass density of water.
To determine the wetted surface area (S), we used the Mumford's formula [9].
) 7 . 1 ( 025 .
1 L C B T
S b
(1.1) Where: Cb is the block coefficient, T and B are respectively
draught and breadth and L is the length on waterline.
The Cb value depends on the hull shape, for example, full
forms such as oil tankers have a high Cb, where fine shapes
such as sailboats have a low Cb [10]. L can be determined
according to the following formula [11]:
05 . 1
OA
L
L ; (LOA - length overall) (1.1.1)
The total resistance coefficient (CT) is determined by [8] :
AA A R F
T C C C C
C (1.2) Where: CF is the frictional resistance coefficient, CR is the
residual resistance coefficient, CA is the incremental resistance
coefficient, CAA is the air resistance coefficient.
The CA and CAA values depend on the size of the ship [11, 12,
13]. The CR coefficient includes wave resistance, the viscous
pressure resistance, and the additional resistance due to the form or curvature of the hull [12]. The frictional resistance coefficient (CF) is determined by [14] :
) 2 log10
( 2
075 . 0
Rn CF
(1.2.1)
Fig 3: Sample of daily average traffic recorded by the system between 10th and 24th December 2013
56% 20%
15% 4% 5%
Cargo Tanker Unidentified Passenger Other types LIST
[image:2.595.72.253.554.646.2]Fig 4: The Model diagram
Where: Rn is the Reynolds number [14] (ratio between the
inertial forces and viscous forces).
L
V
Rn ; (ν - kinematic viscosity) (1.2.1a)
Guldhammer and Harvald [13] developed an empirical method for residual resistance coefficient prediction. CR is
presented as function of the prismatic coefficient (CP) [10],
length-displacement ratio (M) and Froude number (FN). For
example, for M = 4.5, CP = 0.7, CR is given by :
10 ) 91 . 10 10948 . 339
65661 . 4016 28578
. 23700
12684 . 69372 95967
. 81963 (
3 2 3
4 5
N
N N
N N
R
F
F F
F F
C
(1.2.2) The CR is given without correction for hull form or bulbous
bow. Harvald gives additional correction for these parameters [12, 13].
The length-displacement ratio (M) is determined by [12] :
3
L
M
(1.2.2a)
b
C T B L
; (
- displacement) (1.2.2aa)The Froude number (FN) is determined by [14] :
L g
V FN
; (g - gravity constant) (1.2.2b)
2.3.2 Propulsion power (PP)
The propulsion power is the product of speed (V) and ship resistance (RT). The RT is initially determined without taking
into account the weather conditions at sea (sea state, wind and tidal currents), consequently to compensate the weather-related strengths, the parameter Service Allowance (SA) is added [12].
) 100 1
( SA
R V
Pp T
(2)
The Service Allowance (SA) is a parameter given in % and used to compensate the weather-related strengths at sea. Its value is set according to the navigation area. Harvald [13] proposes values on the following table :
Table 1. Service Allowance values according to Harvald
Navigation area
Service Allowance (SA) Summer winter North Atlanctic route,
westbound 25 % 35 %
North Atlantic,
eastbound 20 % 25 %
Europe - Australia 20 % 25 % Europe - Eastern Asia 20 % 25 % The Pacific routes 20 % 30 %
These figures are only rough figures, which can be used for guidance. In this paper, we used values assigned to the "North Atlantic, eastbound".
Specific Fuel Consumption
AIS Data
Ship type Length Breadth Draught Navigation speed
Engine power
Ship resistance Weather data
Fuel consumption
CO2 and PM emissions
Fuel type
30
2.3.3 Engine power (PE)
The power produced by the engine of a ship is never completely converted into propulsion power [9], there is in fact a power loss at the transmission system. The power of engine required to move a ship at speed V, is defined as the ratio between the propulsion power (PP) and performance of
the transmission system (η).
p
E P
P
(3)
According to Schneekluth [11], the transmission system performance in ships ranges between 0.4 and 0.7. The average value (η = 0.55) was used in this paper.
Note : Some ships use multiple engines for propulsion, the value of PE represents in this case the power produced by all
propulsion engines.
2.3.4 Fuel consumption
Fuel consumption (CON) is the product of the engine power (PE) and the specific fuel consumption (SFC).
SFC P
CON E (4)
[image:4.595.330.525.88.159.2]Specific fuel consumption (SFC) is the fuel consumption compared to the work done and is commonly expressed in g/kW·h [15]. The SFC depends on a range of parameters including engine size, age and the energy density of the fuel. The International Maritime Organization (IMO) [15] published data about SFC (table 2).
Table 2. Typical values of specific fuel consumption for engines built between years 2001 and 2007 according to
IMO
Engine type
Specific fuel consumption in
g/kWh
2 stroke low speed 165 - 175 4 stroke medium - high speed
(> 5000 kW) 175 - 185
4 stroke medium - high speed
(1000 - 5000 kW) 180 - 200
4 stroke medium - high speed
(< 1000 kW) 190 - 230
In [15], IMO gives a table linking ship type, main engine size and fuel type used by the engine.
2.3.5 Carbon dioxide and particulate matter
emissions
To determine the CO2 and PM emissions from the engine, we
used the following formula :
CON Factor Emission Emissions
Gas_ _
(5) The "Gas_Emissions" is the amount of CO2 or PM emitted by
the engine, "Emission_Factor" is the CO2 or PM emission
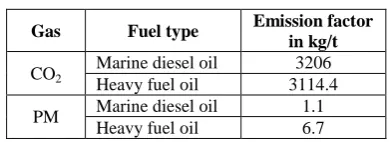
factor. The emission factor (Table 3) is given in kilograms per tonne of fuel (kg/t) [15, 16, 17].
Table 3. Emission factor according to IMO
Gas Fuel type Emission factor
in kg/t
CO2
Marine diesel oil 3206 Heavy fuel oil 3114.4 PM Marine diesel oil 1.1
Heavy fuel oil 6.7
3.
PRACTICAL EXAMPLE
To check the results given by the method, we applied it on a ship. The ship characteristics (Table 4) are the same used by Watson in [9]. This data (Table 4) is similar to that provided by a ship through the AIS system.
Tab 4. ship characteristics
Ship type Tanker
Length 156.65 m
Breadth 25.06 m
Draught 9.47 m
Navigation speed 15 knots
3.1
Main engine power
To check the values given by the method presented in this paper when calculating the propelling power, the results were compared with those of Watson (table 5).
Tab 5. Estimating main engine power
Parameter
Results Watson's
method Our method
Wetted surface area of
the hull (S) 5 528 m
2
5 602.8 m2 Total resistance
coefficient (CT) 10
5 . 2 3
10 998 . 2 3
Propulsion power excluding weather conditions
3 254 kW 3945.5 kW Propulsion power (PP)
taking into account weather conditions
- 4 833.2 kW Engine power (PE) - 8 787.6 kW
3.2 CO
2and PM emissions
The estimated engine power allows estimate the fuel consumption according to the relation (4). The CO2 and PM
[image:4.595.359.495.259.336.2]emissions are based on fuel type and fuel consumption and given in kilogram per minute (table 6).
Table 6. CO2 and PM emissions from the engine
Parameter Resultsin kg/min
Fuel consumption 27.1
CO2 emissions 84.4
[image:4.595.65.271.449.570.2]4.
DISCUSSION
Table 5 shows that the results given by both methods are similar. The method presented in this paper takes into account the weather conditions at sea (North Atlantic, eastbound) while that of Watson ignores them. The differences in the wetted surface area and the residual resistance coefficient results are mainly due to the fact that the method presented here uses respectively Mumford and Harvald's formulas [9, 12, 13] to determine these parameters, while Watson's method uses Taylor and ITTC's formulas [9]. The propulsion power results (excluding weather conditions) depend on these parameters.
5.
CONCLUSION
The method described in this work allows the estimation of CO2 and PM emissions from ships using AIS data. The results
depend on parameters such as the ship type, navigation speed and ship proportions. Another parameter taken into account is the influence of the weather conditions at sea on ships, that somehow affects fuel consumption and therefore CO2 and PM
emissions. This method integrated into a computer application and linked to the system receiving AIS data allows estimate the CO2 and PM emissions from ships in real time. Data can
be stored in a database and used for statistical analysis in order to monitor the rate of CO2 and PM emissions caused by
ships sailing in the Strait of Gibraltar.
6.
REFERENCES
[1] Nora MAREI, "Enjeux maritimes et portuaires du détroit de Gibraltar", Institut Supérieur d'Economie Maritime, ISSN : 1282-3910, Mai 2008.
[2] J. T. Kiehl et Kevin E. Trenberth, "Earth’s Annual Global Mean Energy Budget", Bulletin of the American Meteorological Society, vol. 78, no 2, p. 197-208, February 1997.
[3] World Health Organization, "Health risks of particulate matter from long-range transboundary air pollution", WHO Regional Office for Europe, Denmark, 2006,
available at:
http://www.euro.who.int/__data/assets/pdf_file/0006/786 57/E88189.pdf
[4] J.-P. Jalkanen et Al., "Extension of an assessment model of ship traffic exhaust emissions for particulate matter and carbon monoxide", Atmospheric Chemistry and Physics, doi:10.5194/acp-12-2641-2012, 12 March 2012. [5] Trika Pitana et Al., « Estimation of Exhaust Emissions of
Marine Traffic Using Automatic Identification System Data (Case Study: Madura Strait Area, Indonesia) », IEEE, 2010.
[6] SOLAS’1974, December 2000 amendments, available at: http://www.imo.org/KnowledgeCentre/ReferencesAndAr chives/HistoryofSOLAS/Documents/SOLAS%201974%
20-%20Brief%20History%20-%20List%20of%20amendments%20to%20date%20and %20how%20to%20find%20them.html#43
[7] Eric S. Raymond, "AIVDM/AIVDO protocol decoding", version 1.32, June 2011, available at: http://gpsd.berlios.de/AIVDM.txt
[8] International Towing Tank Conference (ITTC), "Performance, Propulsion 1978 ITTC Performance Prediction Method", ITTC – Recommended Procedures and Guidelines, Section 7.5 – 02 - 03 – 01.4, Revision 00, 1999.
[9] Watson D. G. M., "Practical Ship Design", Elsevier Ocean Engineering Book Series, volume 1, ISBN: 0-08-042999-8, Oxford, UK, 1998.
[10]Dominique Paulet et Dominique Presles, "Architecture navale, connaissance et pratique", Éditions de la Villette, ISBN : 2-903539-46-4, 1999.
[11]Schneekluth, H. and Bertram, "Ship Design for Efficiency and Economy", Butterworth-Heinemann, Second edition, ISBN 0 7506 4133 9, 1998.
[12]Hans Otto Kristensen & Marie Lützen, "Prediction of Resistance and Propulsion Power of Ships", Technical University of Denmark & University of Southern Denmark, Project no. 2010-56, Work Package 2, Report no. 04, October 2012.
[13]Harvald S. A., "Resistance and Propulsion of Ships", Wiley, ISBN 0-89464-754-7, 1983.
[14]International Towing Tank Conference (ITTC), "Testing and Extrapolation Methods Resistance, Resistance Test", ITTC – Recommended Procedures and Guidelines, Section 7.5-02-02-01, Revision 01, 2002.
[15]International Maritime Organization, "Second IMO GHG Study 2009", CPI Books Limited, Reading RG1 8EX, London, UK, April 2009, available at: http://www.imo.org/blast/blastDataHelper.asp?data_id=2 7795&filename=GHGStudyFINAL.pdf
[16]International Maritime Organization, "Interim Guidelines on the Method of Calculation of the Energy Efficiency Design Index for New Ships", Ref. T5/1.01, MEPC.1/Circ.681, London, 17 August 2009.