Interpretive Structural Modeling of Functional
Objectives (Criteria’s) of Assembly Line Balancing
Problem
Pallavi Sharma
Research ScholarS.G.S.I.T.S., Indore
G. Thakar
, Ph.D Associate Professor, IPE Department, S.G.S.I.T.S.,Indore
R.C. Gupta,
Ph.D Professor & Head,IPE Department. S.G.S.I.T.S.,
Indore
ABSTRACT
Use of interpretative structural modeling (ISM) is inspired by the versatility displayed by this method, as reported by researchers, across a wide spectrum of economic and competitive complexities affecting businesses. The aim of this paper is to develop and analyze the relationship among the identified various functional /technical objectives (criteria’s) of assembly line balancing problem using interpretative structural modeling (ISM) and classify these objectives (criteria’s) depending upon their driving and dependence power. A Criteria Survey Sheet of objectives (criteria’s) of assembly line balancing problem was prepared on the basis of literature review. A total of ten functional/technical objectives (criteria’s) of assembly line balancing problem were identified on the basis of industrial survey. And a structured structural- self interaction and reach ability matrices were formed and iterated to yield levels of hierarchical influence of each objectives (criteria’s). MICMAC analysis was also performed to determine dependency and driving power of these objectives (criteria’s). Finally, ISM model is constructed. The present study is a hitherto unexplored attempt, using interpretative structural modeling to determine the level of influence of these objectives (criteria’s) on the efficiency of assembly line of manufacturing industries.
Key words:
Objective (Criteria), Assembly LineBalancing problem (ALBP), Dependence Power, Driving Power, Interpretive Structural Modeling
1.
INTRODUCTION
Assembly line balancing has significant impact on performance and productivity of manufacturing systems and has been an active research area for last decades. An assembly line consists of a finite set of work elements or tasks, each member of the set having an operation processing time and a set of precedence relations which specify the permissible ordering of the tasks. The fundamental line balancing problem is to assign the tasks to an ordered sequence of stations, such that the precedence relations are satisfied and some measure of effectiveness is optimized (e.g. minimize the number of stations or minimize the idle time). This article proposed an ISM based approach to identify the functional/technical objectives (performance measures) of assembly line of manufacturing industries and to analyze the relationship among these identified functional/technical objectives (criteria’s) of assembly line balancing problem and classify these objectives (criteria’s) depending upon their driving and dependence power. And to determine their influence on the efficiency of assembly line of manufacturing industries. This paper is organized as follows. Section 2 discusses the assembly line balancing objectives (criteria’s). Section 3 addresses the objectives of the study
while section 4 presents the methodology. Section 5 presents the literature review of ISM. Section 6 ISM methodology. Section 7 development of ISM model. Section 8 MICMAC analysis section 9 limitations and section 10 conclusions and future directions.
2.
ASSEMBLY
LINE
BALANCING
OBJECTIVE CRITERIA
Table 1: Objective Criteria’s for the Analysis Assembly Line Balancing Problem [14]
3.
OBJECTIVES OF THE STUDY
The main objectives of this paper are:
1. To select and rank the Objectives (Criteria) of Assembly Line Balancing Problem (ALBP) in manufacturing industry where assembly work is performed.
2. To establish the relationship between these identified objectives (criteria) of Assembly Line Balancing problem (ALBP) using interpretive structural modeling.
3. To propose a structural model for objectives (criteria). 4. To classify the identified objectives (criteria) into
various categories and
5. To discuss the findings of this research and suggest directions for future research
4.
METHODOLOGY
The problem discussed here is concerned with Assembly Line Balancing Problem of manufacturing industries. The Industries want to take into account all the important objectives criteria’s (performance measures) which can affect the efficiency of assembly line.
Criteria Based Survey
The study found widespread respondents were working in different types of manufacturing industries (in this study automobile manufacturing and textile industry) were targeted industries. Respondents of the survey are assembly line balancing experts, who are actively involved in line balancing work of manufacturing industries. A group of fifteen (15) experts consisting of Assembly Line Balancing professionals are asked to identify those objectives (criteria’s), which directly
S.No (Objective) Criteria Optimization Definition Layout
Source/ Reference
No.
1. No of Workstations
(M)
Minimize Number of Stations
It is assumed that each task uses a specific resource so, the more tasks with the same resource are assigned to a single station, and the less resources would be needed.
ULBP/ TSALBP
[14],[27],[21], [23]
2. Line Efficiency
(LE)
Maximize Line Efficiency
Line Efficiency represents positive achievement in line utilization and is the key representation of economic performance. This index has no dimension and scale. Its amount is between 0 and 1, with 1 indicating the best outcome.
SALBP [11],[9],[14]
3. Balance Efficiency
(BE)
Maximize Balance Efficiency
It represents the distribution of Work with consequent personnel satisfaction combined with increased opportunities for greater output. This index has no dimension and scale. Its amount is between 0 and 1, with 1 indicating the best outcome.
SALBP/ ULBP
[9]
4. Balance Delay
(BD)
Minimize Balance Delay
Line inefficiency is represented by BD. BD represents negative achievement in line utilization and is the key representation of uneconomic performance.
SALBP
[11],[9] ,[27],[10],[13]
,[16]
5. Smoothness Index
(SI)
Minimize Smoothness
Index
Sum of distance between stations task time and cycle time is represented by SI. It represents tasks smoothness distribution in stations.
SALBP/ ULBP
[11],[9],[14],[ 10] [26],[25]
6. Production Rate
(PR)
Maximize Production Rate
Batch -ALB
[24]
7. Total Idle Time (IT)
Minimize Total Idle Time along
the Line
Is the difference between the cycle time and
the workstation load SALBP [27],[14]
8.
West Ratio
(WR) Maximize West
Ratio
Average number of tasks per station is
represented by WR. SALBP
[11],[9],[7],[8 ]
9. Task Time Intensity
(TTI)
Maximize Task Time Intensity
The relationship between average element task time and cycle time is represented by Task Time Intensity.
SALBP [11],[9],[32]
10.
Task Time Distribution
(TTD)
Minimize Task
Time Distribution The range of available element times is
affects the working of industry assembly line. For this purpose, a Criteria Survey Sheet as shown in APENDIX-A is provided to get the evaluations. There were 45 objectives (criteria’s) which were portrayed in APENDIX-A. A nominal question was asked from respondents (line balancing experts) in order to clarify whether they have utilized any/some of 40 objectives (criteria’s) to measure the efficiency of assembly line. Respondents were requested to tick mark the objectives (criteria’s) which are used in the industry to calculate the performance of assembly line.
5.
LITERATURE REVIEW OF ISM
Interpretive structural modeling (ISM), proposed by [34] is used to make a complex system into a visualized hierarchical structure. It is a method of analyzing and solving complex problems to manage decision-making. ISM can be used for identifying and summarizing relationships among specific variables, which define a problem or an issue [17]. It provides us a means by which order can be imposed on the complexity of such variables [2]. The management of a manufacturing system consists of a large number of factors associated with physical elements and/or decision-making. The presence of directly or indirectly related factors complicates the structure of the system, which may or may not be articulated in a clear manner. It becomes difficult to deal with such a system in which structure is not clearly defined. Hence, this necessitates the development of a methodology that aids in identifying an inter-relationship structure within a system [29]. ISM is an interactive process in which a set of related factors is structured into a comprehensive systematic model [31]. The overall structure is portrayed through a digraph model [22], [28], an approach that has been adopted for structuring details related to a problem or activity such as product design, complex technical problems, competitive analysis, and predicting purchasing performance [19], [30], [18], [15] use the ISM methodology to understand the interactions among the criteria that influence supplier selection. An effective ISM model is illustrated using a case study concerning a company in the southern part of India.
[4] Integrated the ISM and AHP methods into the supplier selection process to determine the Relationships of buyer– supplier and formation of selection criteria. [1] Employ ISM methodology to understand the variables of an agile supply chain, leading to fruitful results in terms of improved market share. [20] Use a set of criteria applied to ISM to construct an analytical hierarchy model (AHP) and apply a fuzzy analytic hierarchy process (FAHP) to improve worker productivity. [18]
use ISM to analyze the interactive relations among interface
elements to satisfy the different requirements of design and improve the design Efficiency.
6.
ISM METHODOLOGY
The methodology of ISM can act as a tool for imposing order and direction on the complexity of relationship among elements of a system [13]. Figure.1 clearly shows flow diagram for the methodology adopted for the ISM. The methodology of ISM is an interactive learning process. The ISM can be judiciously employed for getting better insights into the present case of strategic information modeling. The ISM methodology is interpretive from the fact that as the judgment of the group decides whether and how the variables are related. It is structural too, as on the basis of relationship; an overall structure is extracted from the complex set of variables. It is a modeling technique in which the specific relationships of the variables and the overall structure of the system under consideration are portrayed in a digraph model. ISM is primarily intended as a group learning process, but it can also be used individually. [14] Used ISM methodology for modeling of knowledge management in engineering industries. [29] and applied the ISM methodology for energy conservation in indian cement industry. They identified relationship amongst direct and indirect key variables. [6] Has employed ISM methodology to develop a hierarchy of actions required to achieve the future objective of waste management in India. Vendor selection criteria, interrelationship of criteria and their levels were analyzed by [29] by using the ISM methodology. These criteria have also been categorized depending on their driver power and dependence.
6.1
Characteristics of ISM
The important characteristics of ISM are as follows:
a) This methodology is interpretive as the judgment of the group decides whether and how the different elements are related.
b) It is structural on the basis of mutual relationship; an overall structure is extracted from the complex set of elements
c) It is a modeling technique, as the specific
relationships and overall structure are portrayed in a digraph model.
d) It helps to impose order and direction on the complexity of relationships among various elements of a system [31].
e) It is primarily intended as a group learning process, but can also be used by individuals.
6.2
Basic Concepts
There are two basic concepts essential to understand the ISM methodology. One is the concept of transitivity and the other is that of reach ability. Transitivity is a basic assumption in ISM and is always used in this modeling approach [12], [31], [32]. It also helps in maintaining the conceptual consistency. The modeler can reconsult an expert if a situation of conceptual inconsistency is detected. Because the ISM approach is primarily based on expert opinion about these complex relationships, the literature deals only with a qualitative method for detecting conceptual inconsistency. The reach ability concept is the building block of ISM methodology. Different identified elements are compared on a pair wise basis with respect to their interrelations. This information is represented in the form of binary matrix. If an element i reaches another element j, then the entry in the cell [i, j] of the reach ability matrix is 1 and if element i does not reach j, then entry in the cell [i, j] of the reach ability matrix is 0. The property of
transitivity also allows some of the cells of reach ability matrix to be completed by inference [31]. The reach ability matrix then consists of some entries from pair wise comparisons and some inferred entries. The ISM process becomes more efficient because the use of transitive inference reduces the number of the required relational queries by 50-80% [31].
6.3
Procedural Steps of ISM
The steps suggested by [13] for implementing ISM methodology is:
STEP 1: Variables affecting the system under consideration are listed, which can be objectives, actions and Individuals etc.
STEP 3: A Structural Self-Interaction Matrix (SSIM) is developed for variables, which indicates pair wise Relationships among variables of the system under consideration.
STEP 4: Reach ability matrix is developed from the SSIM and the matrix is checked for transitivity. The transitivity of the contextual relation is a basic assumption made in ISM. It states that if a variable A is related to B and B is related to C, and then A is necessarily related to C.
STEP 5: The reach ability matrix obtained in Step 4 is partitioned into different levels.
STEP 6: Based on the relationships given above in the reach ability matrix, a directed graph is drawn and the transitive links are removed.
STEP 7: The resultant digraph is converted into an ISM, by replacing variable nodes with statements.
STEP 8: The ISM model developed in Step 7 is reviewed to check for conceptual inconsistency and necessary Modifications are made.
Figure1: ISM Based Methodology
7.
DEVELOPMENT OF ISM MODEL
The various steps, which lead to the development of model, are illustrated below:
Step1.Establishing the contextual
relationship between line balancing
objectives
After identifying and enlisting the 10 objectives (criteria’s) shown in the Table 2. Through the literature review, and expert opinion on criteria survey sheet from manufacturing industries (manufacturing industries selected are automobile manufacturing two wheeler and four wheeler, etc.) where line balancing work is performed, the next step is to analyze the
objectives (criteria’s). For this purpose, a contextual relationship of ‘reaches to’ type is chosen. This means that one objective (criteria’s) reaches to another chosen objectives (criteria’s). Based on this principle, a contextual relationship is developed. Some experts, from various industries, were consulted to assist in developing the contextual relationships between the objectives (criteria’s). Keeping in mind the contextual relationship for each objective (criteria’s), the existence of a relation between any two objectives (i and j) and the associated direction of this relations decided to analyze the objectives (criteria’s) for the development of the SSIM, the following four symbols are used to denote the direction of the relationship between the objectives (criteria’s) (i and j). As
EXPERT OPENION
DEVELOP A RECHABILITY MATRIX
PARTION OF RECHABILITY MATRIX INTO DIFFERENT LEVELS
DEVELOP RECHABILITY MATRIX INTO CONICAL FORM
ESTABLISH CONTEXTUAL RELATIONSHIP BETWEEN VARIABLES
DEVELOP A STRUCTURAL SELF INTERACTION MATRIX (SSIM)
IDENTIFICATION OF FECTORS FOR OBJECTIVES (CRITERIA’S) OF ASSEMBLY LINE BALANCING
REPRESENT RELATIONSHIP INTO A MODEL-ISM MODEL
REMOVE TRANSITIVITY FROM DIAGRAPH
REPLACE VARIABLE NODES WITH RELATIONSHIP STATEMENTS
DEVELOP DIGRAPH
suggested by [31] four standard symbols are used to denote the direction of relationship between the variables.
V: Criterion i will assist to reach criterion j
A: Criterion j will assist to reach criterion i
X: Criterion i and j will assist to reach each other and
O: Criterion j and i are unrelated
Step 2. Development of a structural self-
interaction matrix (SSIM)
Based on the contextual relationship between the objectives (criteria’s), the SSIM was developed. To achieve consensus, the
[image:5.595.58.538.185.330.2]SSIM was discussed in a group of experts. Based on their responses, the SSIM was finalized and is presented in Table2.
Table. 2. Structural Self-Interaction Matrix (SSIM)
Step 3. Development of the reach ability
matrix
The SSIM was converted into a binary matrix, called the initial reach ability matrix as shown in Table 3 by substituting V, A, X and O with 1 and 0 as per the case. The substitution of 1s and 0s are as per the following rules:
1. If the [i, j] entry in the SSIM is V, the [i, j] entry in the reach ability matrix becomes 1 and the [j,i] entry becomes 0.
2. If the [i, j] entry in the SSIM is A, the [i, j] entry in the reach ability matrix becomes 0 and the [j,i] entry becomes1.
3. If the [i, j] entry in the SSIM is X, the [i, j] entry in the reach ability matrix becomes 1 and the [j,i] entry also becomes 1.
[image:5.595.51.525.486.630.2]4. If the [i, j] entry in the SSIM is O, the [i, j] entry in the reach ability matrix becomes 0 and the [j,i] entry Also becomes 0.
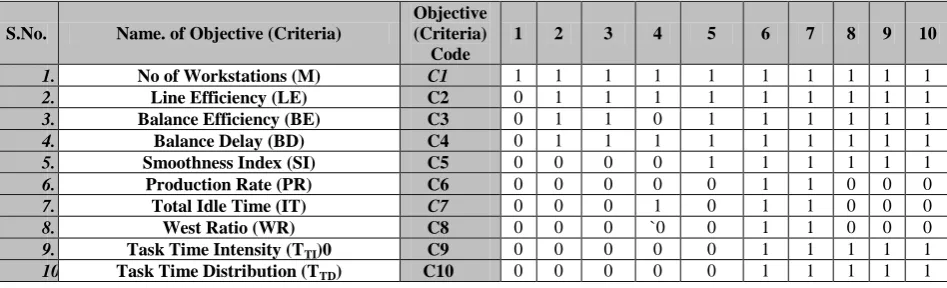
Table.3 Initial reach ability matrix
Step 4. Partitioning the reach ability matrix
Once the reach ability matrix has been created, it must be processed to extract the digraph (structural model). The reach ability matrix is partitioned on the basis of the reach ability and antecedent sets for each of the variables, and, through a series of iterations, these were grouped into various levels [35]presented a series of partitions induced by the reach ability matrix on the set and subset of different elements. From these partitions many properties of the structural model can be
identified [12] Based on the suggestions of [35] and [12] the reach ability set and antecedent set for each objectives (criteria’s) were extracted from the conical form of reach ability matrix shown in Table5. The reach ability set consists of the objectives (criteria’s), itself and the other objectives (criteria’s) which are reachable from those particular objectives (criteria’s). For every column which contains 1 in the row of the considered objectives (criteria’s).The objectives (criteria’s) that column represents is included in the reach ability set.
S.No. Name. of Objective (Criteria)
Objective (Criteria) Code
C10 C9 C8 C7 C6 C5 C4 C3 C2
1. No of Workstations (M) C1 V V V V V V V V V
2. Line Efficiency (LE) C2 V V V V V V X X
3. Balance Efficiency (BE) C3 V V V V V V A
4. Balance Delay (BD) C4 V V V X V V
5. Smoothness Index (SI) C5 V V V V V
6. Production Rate (PR) C6 A A A X
7. Total Idle Time (IT) C7 A A A
8. West Ratio (WR) C8 A A `
9. Task Time Intensity (TTI)0 C9 X
10. Task Time Distribution (TTD) C10 X
S.No. Name. of Objective (Criteria)
Objective (Criteria) Code
1 2 3 4 5 6 7 8 9 10
1. No of Workstations (M) C1 1 1 1 1 1 1 1 1 1 1
2. Line Efficiency (LE) C2 0 1 1 1 1 1 1 1 1 1
3. Balance Efficiency (BE) C3 0 1 1 0 1 1 1 1 1 1
4. Balance Delay (BD) C4 0 1 1 1 1 1 1 1 1 1
5. Smoothness Index (SI) C5 0 0 0 0 1 1 1 1 1 1
6. Production Rate (PR) C6 0 0 0 0 0 1 1 0 0 0
7. Total Idle Time (IT) C7 0 0 0 1 0 1 1 0 0 0
8. West Ratio (WR) C8 0 0 0 `0 0 1 1 0 0 0
9. Task Time Intensity (TTI)0 C9 0 0 0 0 0 1 1 1 1 1
Similarly, the antecedent set consists of the objectives (criteria’s) itself and the other objectives (criteria’s) which may reach the objectives (criteria’s). For every row which contains 1 in the column of considered objectives (criteria’s). The objectives (criteria’s) that row represents are included in the antecedent set. After finding the reach ability and antecedent sets for each objective (criteria), the intersection of these sets is
derived for all the objectives (criteria’s) and levels. This procedure is continued till all levels of the structure are identified. These identified levels help in the development of the digraph and the final model. In the present case the level identification process for the ten objectives (criteria’s) was completed in seven iterations and is shown in Table 4 (a) and Table 4 (b).
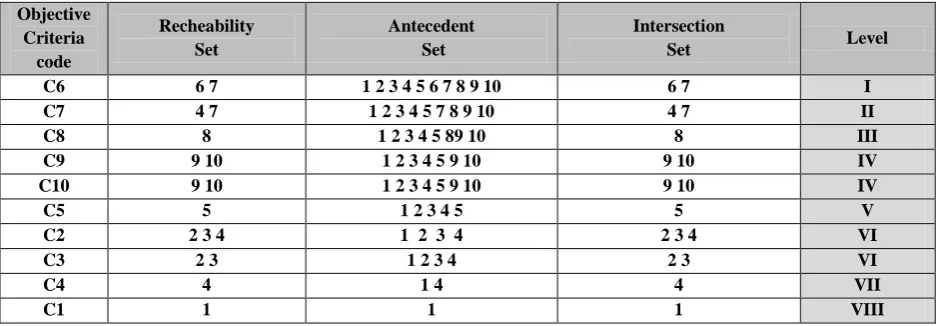
Table 4 (a). Level of Objective Criteria (partitioning the reach ability matrix based on 7 iterations) Objective
Criteria code
Recheability Set
Antecedent Set
Intersection
Set Level
C1 1 1 1 VIII
C2 2 3 4 1 2 3 4 2 3 4 VI
C3 2 3 1 2 3 4 2 3 VI
C4 4 1 4 4 VII
C5 5 1 2 3 4 5 5 V
C6 6 7 1 2 3 4 5 6 7 8 9 10 6 7 I
C7 4 7 1 2 3 4 5 7 8 9 10 4 7 II
C8 8 1 2 3 4 5 89 10 8 III
C9 9 10 1 2 3 4 5 9 10 9 10 IV
C10 9 10 1 2 3 4 5 9 10 9 10 IV
Table 4 (b). Level of Objective Criteria (partitioning the reach ability matrix based on 8 iterations) Objective
Criteria code
Recheability Set
Antecedent Set
Intersection
Set Level
C6 6 7 1 2 3 4 5 6 7 8 9 10 6 7 I
C7 4 7 1 2 3 4 5 7 8 9 10 4 7 II
C8 8 1 2 3 4 5 89 10 8 III
C9 9 10 1 2 3 4 5 9 10 9 10 IV
C10 9 10 1 2 3 4 5 9 10 9 10 IV
C5 5 1 2 3 4 5 5 V
C2 2 3 4 1 2 3 4 2 3 4 VI
C3 2 3 1 2 3 4 2 3 VI
C4 4 1 4 4 VII
C1 1 1 1 VIII
Step 5. Development of conical matrix
A conical matrix can be developed by clubbing together objectives (criteria’s) in the same level, across the rows and columns of the reach ability matrix, as shown in Table 5. The
driver power of a barrier is derived by summing the number of ones in the rows, and the dependence power is derived by summing up the number of ones in the columns.
Table 5. Conical form of Reach ability Matrix Objective
Criteria code
C6 C7 C8 C9 C10 C5 C2 C3 C4 C1 Driving
Power
C6 1 0 0 0 0 0 0 0 0 0 1
C7 1 1 0 0 0 0 0 0 1 0 3
C8 1 1 1 0 0 0 0 0 0 0 3
C9 1 1 1 1 1 0 0 0 0 0 5
C10 1 1 1 1 1 0 0 0 0 0 5
C5 1 1 1 1 1 1 0 0 0 0 6
C2 1 1 1 1 1 1 1 1 1 0 9
C3 1 1 1 1 1 1 1 1 0 0 8
C4 1 1 1 1 1 1 1 1 1 1 10
C1 1 1 1 1 1 1 1 1 1 1 10
Dependen
[image:6.595.51.526.175.335.2] [image:6.595.54.524.365.528.2]Step 6. Development of diagraph
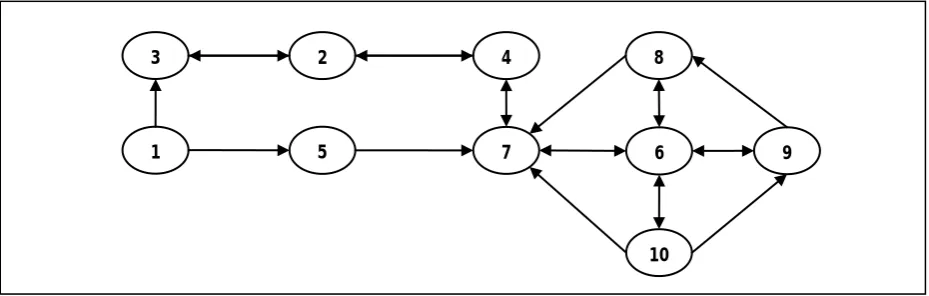
Based on the conical matrix an initial diagraph including transitivity links is developed. This is generated by the vertices or nodes and the lines of edges. After removing the indirect
[image:7.595.66.531.128.276.2]links, a final digraph is developed as shown in Figure 3 .If there is a relationship between the barriers j, and i this is shown by an arrow which points from i to j.
Figure 3: Digraph showing the levels of assembly line balancing objective criteria’s
Step7. Development of ISM model
[image:7.595.63.511.335.481.2]The digraph is converted into an ISM model by replacing the element nodes s with statements as shown in Figure 4
Figure 4: Interpretive structural model showing the levels of assembly line balancing objective criteria’s
Step8. Check for conceptual inconsistency
Conceptual inconsistency is checked by identifying and removing the intransitivity in the model.
8.
MICMAC ANALYSIS
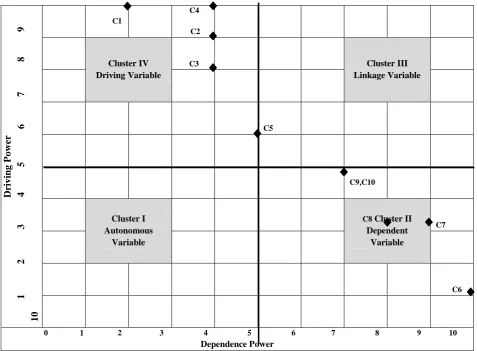
It is called the Matrice d’Impacts Croisés Multiplication Appliquée á un Classeement (cross-impact matrix multiplication applied to classification) is abbreviated as MICMAC. The MICMAC principle is based on the multiplication properties of matrices [33]. The purpose of a MICMAC analysis is to analyze the driver and dependence power of the objectives (criteria’s) of assembly line balancing problem. This is done to identify the key objective criteria’s that drive the system. Subsequently, the driver and dependence diagram is constructed which is shown in Figure.2.Based on their driver and dependence power, the objectives (criteria’s) in this case, have been classified into four categories as follows:
1. Autonomous objectives (criteria’s): These objective criteria’s have weak driver power and weak dependence. They
are relatively disconnected from the system, with which they have few strong links. In the present case, there are no autonomous objectives (criteria’s).
2. Linkage objectives (criteria’s): These have strong driver power as well as strong dependence power. They are also unstable. Any action on them has an effect on others and also a feedback effect on themselves. In this category, there are no linkage objectives (criteria’s).
3. Dependant objectives (criteria’s): This category includes those objective criteria’s which have weak driver power but strong dependence power. In the present case, objectives (criteria’s) C6, C7, C8, C9 and C10 are in the category of dependant objectives (criteria’s).
4. Driver objectives (criteria’s): These have strong driver power but weak dependence power. It is generally observed that an objective criteria’s with a very strong driver power, called a ‘key objective criteria’s’. In the present case, objectives (criteria’s) C1, C2, C3, C4 and C5, are in the category of driver objectives objectives (criteria’s).
No of Workstations
Line Efficiency
Balance Efficiency Balance Delay
Smoothness Index Total Idle Time Production Rate
West Ratio
Task Time Intensity
Task Time Distribution 1
2
3 4
5 7 6
8
9
Driv
ing
P
o
wer
1
2
3
4
5
6
7
8
9
10
C1
C4 C2
Cluster IV Driving Variable
C3 Cluster III
Linkage Variable
C5
C9,C10
Cluster I Autonomous
Variable
C8 Cluster II Dependent
Variable
C7
C6
[image:8.595.53.531.67.418.2]0 1 2 3 4 5 6 7 8 9 10 Dependence Power
Figure 2: The Cluster of Objectives (Criteria’s) of Assembly Line Balancing Problem (Driving and Dependence power diagram)
9.
LIMITATIONS
Budget constraints, time restriction, and transportation problem forced researcher to select a medium sample size. As the population framework was limited to the small sample size, the findings cannot be generalized across all manufacturing industries of geographical regions of Indore, Dewas and Pithumpur industrial area.
10.
CONCLUSIONS AND FUTURE
DIRECTIONS
ISM developed in this paper acts as a tool for manufacturing industries to identify the performance measures of assembly line. Though ISM is developed on the basis of perception of the experts of assembly line, the results are quite generic and helpful for the analysis of relationship among the objectives and their effect on overall efficiency assembly line.ISM developed in this paper is not specific to any sector and specific model for any other sector may differ slightly from the model. This survey specifically addressed the objectives (criteria’s) for measuring efficiency of assembly line balancing problems of manufacturing industries. Researchers can conduct a same survey with a larger sample size in order to increase precision in estimation of various aspects of the population. Furthermore, focused serious attention on various industries and geographical regions can provide better picture of line balancing problem.
11.
REFERENCES
[1] Agarwal, A., Shankar, R., and Tiwari, M.K., 2007. Modeling agility of supply chain. Industrial Marketing Management, 36 (4), 443–457.
[2] Anderson, J. and Narus, J. (1990). A model of distributor firm and manufacturer firm working partnerships. Journal of Marketing, 54(1):42–58.
[3] Cachon, G. and Lariviere, M. (2005). Supply chain coordination with revenue sharing Contracts: strengths and limitations. Management Science, 51(1):30–44.
[4] Chan, F.T.S., 2003. Interactive selection model for supplier selection process: an analytical hierarchy process approach. International Journal of Production Research, 41 (15), 3549–3579.
[5] Charan, P., Shankar, R., and Baisya, R. (2008). Analysis of interactions among the variables of supply chain performance measurement system implementation. Business Process Management Journal, 14(4):512–529.
[6] Chellappan, C. and Natarajan, M. (2010). Fuzzy rule based model for the perishable collection-production-inventory system. International Journal of Management Science and Engineering Management, 6(3):183–190,
[8] Dar-El, E.M., 1975, Solving large single model assembly line balancing problems-A comparative study. AIIE Transactions, 7(3).
[9] Driscoll, J., (1999), Users guide to the A Line software package. Unpublished working paper, University of Surrey.
[10] Driscoll, J., Thilakawardana, D., (2001), The definition of assembly line balancing difficulty and evaluation of balance solution quality. Robotics and Computer Integrated Manufacturing 17, S81–S86.
[11] F. Jolai ,M. Jahangoshai Rezaee , A. Vazifeh, (2009), Multi-criteria decision making for assembly line balancing, J Intell Manuf .20:113–121.
[12] Farris, D. and Sage, A. (1975). On the use of interpretive structural modelling for worth assessment. Computers & Electrical Engineering, 2, 149–174.
[13] Ghosh, S., Gagnon, R.J., (1989), A comprehensive literature review and analysis of the design, balancing and scheduling of assembly systems. International Journal of Production Research 27, 637–670.
[14]H.D. Sharma, A.D. Gupta, and S. Sushil, “The objectives of waste management in India: a futures inquiry”,Technological Forecasting and Social Change, Vol. 48, pp.285-309.1995.
[15] Hami Farkhondeh ,Reza Hassanzadeh, Iraj Mahdavi &Nezam Mahdavi-Amiri,(2012), A DEA approach for comparing solution efficiency in U-line balancing problem using goal programming Int J Adv Manuf Technol ,61:1161–1172
[16] Kannan, G. and Haq, A.N., 2007. Analysis of interactions of criteria and sub-criteria for the selection of supplier in the built-inorder supply chain environment. International Journal of Production Research, 45 (17), 3831–3852.
[17]Kilbridge, M. and Wester, L. (1961), The balance delay problem, Management Science, 8, 69-84.
[18]Kiran Banga Chhokar,(2010), “Higher education and curriculum innovation for sustainable development in India”, International Journal of Sustainability in Higher Education Vol. 11 No. 2, pp. 141-152.
[19]Lee, Y.-C., Chao, Y.H., and Lin, S.-B., 2010. Structural approach to design user interface. Computers in Industry, 61, 613–623.
[20]Li, W.L., et al., 2003. Predicting purchasing performance: the role of supplier development programs. Journal of Materials Processing Technology, 138 (1–3), 243–249.
[21]Liao, C.H. and Tseng, M.L., 2009. Using interpretive structural modeling and AHP to evaluate the worker productivity criteria in uncertainty. WSEAS Transaction on Business and Economics, 6 (8), 435–445.
[22] Malakooti,B.,A, 1994,assembly line balancing problem with buffers by multiple criteria optimization, International journal of production 32,(9),2159-2178.
[23] Mandal, A. and Deshmukh, S.G., 1994. Vendor selection using interpretive structural modeling. International Journal of Operations and Production Management, 14 (6), 52–59.
[24] Manuel Chica , Óscar Cordón ,Sergio Damas, (2011), An advanced multi objective genetic algorithm design for the time and space assembly line balancing problem. Computers & Industrial Engineering 61 (2011) 103–117.
[25] Md. Alamgir Kabir, Mario T. Tabucanon, (1995), Multi Attribute Decision Making Approach, Int. J. Production Economics 41, 193-201.
[26] Moodie, C. L. and Young, H. H., (1965), A heuristic method of assembly line balancing for assumptions of constant or variable work element times. Journal of Industrial Engineering, 16, 23-29.
[27] Nima Hamta, S.M.T. Fatemi Ghomi, F. Jolai, Unes Bahalke (2011), “Bi-criteria assembly line balancing by considering flexible operation times”. Applied Mathematical Modelling Vol.35, pp.5592–5608.
[28] Nuchsara Kriengkorakot, et. al. (2007), The Assembly Line Balancing Problem: Review articles, KKU Engineering Journal Vol. 34 No .2 ,133 – 140.
[29] Pandey, V.C., Suresh, G., and Ravi, S., 2005. An interpretive structural modeling of enabler variables for integration in supply chain management. Productivity, 46 (1), 93–108.
[30] Raj, T., Shankar, R., and Suhaib, M., 2008. An ISM approach for modelling the enablers of flexible manufacturing system: the case for India. International Journal of Production Research, 46 (24), 6883–69.
[31]Rajesh, K.S., Suresh, K.G., and Deshmukh, S.G., 2007. Interpretive structural modeling of factors for improving competitiveness of SMEs. International Journal of Productivity and Quality Management, 2 (4), 423–440
[32]Sage, A. (1977). Interpretive Structural Modelling: Methodology for Large-scale Systems. McGraw-Hill, New York, NY.
[33]Scholl, A., 1999. Balancing and sequencing assembly lines, 2nd ed. Physica, Heidelberg.
[34]Sharma, H., Gupta, A., and Sushil. (1995). The objectives of waste management in India: a future inquiry. Techology Forecast & Social Change, 48, 285–309.
[35]Warfield, J. (1974). Developing interconnected matrices in structural modelling. IEEE Transcript on Systems, Men and Cybernetics, 4(1):51–81.
[36]Warfield, J.N., 1974. Toward interpretation of complex structural modeling. IEEE Transactions on Systems, Man, and Cybernetics, 4 (5), 405–417.
![Table 1: Objective Criteria’s for the Analysis Assembly Line Balancing Problem [14]](https://thumb-us.123doks.com/thumbv2/123dok_us/8059780.776126/2.595.58.527.89.565/table-objective-criteria-analysis-assembly-line-balancing-problem.webp)