Contributions of gluconeogenesis to glucose
production in the fasted state.
B R Landau, … , K Ekberg, S C Kalhan
J Clin Invest.
1996;
98(2)
:378-385.
https://doi.org/10.1172/JCI118803
.
Healthy subjects ingested 2H2O and after 14, 22, and 42 h of fasting the enrichments of
deuterium in the hydrogens bound to carbons 2, 5, and 6 of blood glucose and in body
water were determined. The hydrogens bound to the carbons were isolated in formaldehyde
which was converted to hexamethylenetetramine for assay. Enrichment of the deuterium
bound to carbon 5 of glucose to that in water or to carbon 2 directly equals the fraction of
glucose formed by gluconeogenesis. The contribution of gluconeogenesis to glucose
production was 47 +/- 49% after 14 h, 67 +/- 41% after 22 h, and 93 +/- 2% after 42 h of
fasting. Glycerol's conversion to glucose is included in estimates using the enrichment at
carbon 5, but not carbon 6. Equilibrations with water of the hydrogens bound to carbon 3 of
pyruvate that become those bound to carbon 6 of glucose and of the hydrogen at carbon 2
of glucose produced via glycogenolysis are estimated from the enrichments to be
approximately 80% complete. Thus, rates of gluconeogenesis can be determined without
corrections required in other tracer methodologies. After an overnight fast gluconeogenesis
accounts for approximately 50% and after 42 h of fasting for almost all of glucose production
in healthy subjects.
Research Article
Find the latest version:
J. Clin. Invest.
© The American Society for Clinical Investigation, Inc. 0021-9738/96/07/0378/08 $2.00
Volume 98, Number 2, July 1996, 378–385
Contributions of Gluconeogenesis to Glucose Production in the Fasted State
Bernard R. Landau,*‡ John Wahren,iVisvanathan Chandramouli,* William C. Schumann,* Karin Ekberg,i
and Satish C. Kalhan§
Departments of *Medicine, ‡Biochemistry and §Pediatrics, Case Western Reserve University School of Medicine, Cleveland, Ohio 44106; and iDepartment of Clinical Physiology, Karolinska Hospital, S 171 76 Stockholm, Sweden
Abstract
Healthy subjects ingested 2H
2O and after 14, 22, and 42 h of
fasting the enrichments of deuterium in the hydrogens bound to carbons 2, 5, and 6 of blood glucose and in body water were determined. The hydrogens bound to the car-bons were isolated in formaldehyde which was converted to hexamethylenetetramine for assay. Enrichment of the deu-terium bound to carbon 5 of glucose to that in water or to carbon 2 directly equals the fraction of glucose formed by gluconeogenesis. The contribution of gluconeogenesis to glucose production was 4764% after 14 h, 6764% after 22 h, and 9362% after 42 h of fasting. Glycerol’s conversion to glucose is included in estimates using the enrichment at car-bon 5, but not carcar-bon 6. Equilibrations with water of the hy-drogens bound to carbon 3 of pyruvate that become those bound to carbon 6 of glucose and of the hydrogen at carbon 2 of glucose produced via glycogenolysis are estimated from the enrichments to be z 80% complete. Thus, rates of
gluco-neogenesis can be determined without corrections required in other tracer methodologies. After an overnight fast gluco-neogenesis accounts for z 50% and after 42 h of fasting for
almost all of glucose production in healthy subjects. (J. Clin.
Invest. 1996. 98:378–385.) Key words: fasting • deuterium
oxide • glucose • glycogen • gluconeogenesis
Introduction
We recently introduced a method for estimating contributions of gluconeogenesis to glucose production (1). Estimates de-pended upon the extent of enrichment of deuterium in the hy-drogen bound to carbon 6 of glucose after ingestion of 2H
2O.
In the conversion of pyruvate to glucose the hydrogens bound to carbon 3 of pyruvate exchange with hydrogen in water and it is that carbon, with two bound hydrogens, that becomes car-bon 6 of glucose. Oxidation of the glucose with periodic acid yields formaldehyde containing carbon 6 and the hydrogens. A strength of the method is in the use of hexamethylenetetra-mine (HMT),1 C
6H12N4, a condensation product of six
mole-cules of formaldehyde and four molemole-cules of NH3, to assay the
enrichment of the hydrogens. All 12 hydrogens of HMT are from the formaldehyde. That magnification allows for an accu-rate measurement of enrichment, while giving a safe, well-tol-erated dose of 2H
2O.
Enrichment of the hydrogens bound to carbon 6 of blood glucose should equal that in body water, if all glucose forma-tion is via gluconeogenesis from pyruvate, the exchange is complete, and the enrichment has reached steady state. Since in the conversion of glycogen to glucose the hydrogens bound to carbon 6 do not exchange with hydrogen in water, the frac-tion of blood glucose formed by gluconeogenesis is then the ratio of the enrichment of deuterium in a hydrogen bound to carbon 6 of glucose to that in body water (1). Since in gluco-neogenesis, fructose-6-P ⇔ glucose-6-P → glucose, the enrich-ment of the hydrogen bound to carbon 2 of blood glucose formed by gluconeogenesis should also be about that in body water. The hydrogen bound to carbon 2 of glucose formed by glycogenolysis should also have about the same enrichment as in body water, since as glycogen → glucose-6-P → glucose, there is extensive isomerization of glucose-6-P with fructose-6-P (2). Thus, after 2H
2O ingestion, the enrichment of a hydrogen
bound to carbon 6 to that bound to carbon 2 of blood glucose also measures the fraction of the glucose formed by gluconeo-genesis.
However, reliance on enrichment of the hydrogen bound to carbon 6 results in underestimates. The exchange of the hy-drogens bound to carbon 3 of pyruvate with those in water is extensive, but incomplete (1). Also, gluconeogenesis from glycerol is not measured, since the hydrogens bound to carbon 3 of glycerol that become the hydrogens bound to carbon 6 of glucose do not exchange with hydrogen in body water. We now apply an approach which removes those limitations.
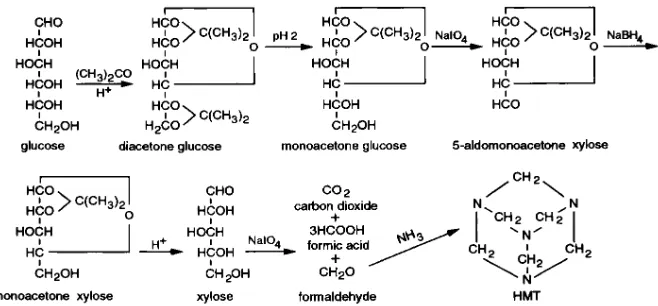
The approach rests on the fact that hydrogen bound to car-bon 5 of glucose formed via gluconeogenesis, in the conversion of phosphoenolpyruvate to 2-phosphoglyceric acid, has water as its source. Furthermore, when glycerol is converted to glu-cose, carbon 5 of the glucose is from carbon 2 of glyceralde-hyde-3-P (Fig. 1). Hydrogen from water is transferred to that carbon in the isomerization of dihydroxyacetone-3-P from the glycerol with glyceraldehyde-3-P, and that isomerization is ex-tensive (3). In glycogenolysis there is no exchange with water of the hydrogen bound to carbon 5 of the glucose formed. Thus, the ratio of enrichment at carbon 5 of glucose to that at carbon 2, or in water at steady state, is a direct measure of the fraction of glucose formed by gluconeogenesis.
We chemically converted glucose to xylose by the removal of carbon 6. Oxidation of the xylose with periodic acid then yields formaldehyde containing carbon 5 of glucose with its bound hydrogen. Determination of the enrichment at carbon 2 of glucose using a lactate derivative (1), while adequate, does not have the advantage provided by using HMT. Therefore, we also developed a procedure that yields formaldehyde with
Address correspondence to Bernard R. Landau, Ph.D., M.D., De-partment of Medicine, Case Western Reserve University School of Medicine, 10900 Euclid Ave., Cleveland, OH 44106-4951. Phone: 216-368-4958; FAX: 216-368-4927.
Received for publication 5 February 1996 and accepted in revised form 8 May 1996.
the hydrogen bound to carbon 2 of glucose and hence a HMT containing that hydrogen.
There has been uncertainty with regard to the contribution of gluconeogenesis during fasting. Healthy subjects were given
2H
2O and fasted for 42 h. At timed intervals during the fast the
enrichments at carbons 2, 5, and 6 of glucose using the HMT derivative were determined. Enrichment in urinary water was the measure of the enrichment in body water. From the ratios of enrichments estimates were made of the fraction of glucose produced by gluconeogenesis. The ratios also give a measure of the extent of exchange of the hydrogens of pyruvate that re-sults in the enrichment at carbon 6 and the extent of isomeriza-tion of the hexose-6-phosphates that results in the enrichment at carbon 2 in the process of glycogenolysis.
Methods
Subjects.Eight healthy subjects, six women and two men, ages 24 to 39 yr (31.361.9) were studied. Their weights ranged from 63 to 86 kg (body mass index 23.460.5 kg/m2). As recorded in dietary diaries,
they ingested at least 200 grams of carbohydrate daily for the 4 d be-fore study. They reported no change in diet and weight during the prior months.
Experimental protocol. The protocol was that used previously (1). At 5 p.m. on the day of the study the subjects ingested during 1 h a meal of 12–14 kcal per kg of body weight and composed of 48% car-bohydrate, 19% protein, and 33% fat. They then fasted for 42 h ex-cept for water ingestion. 5 h after beginning the fast they drank 2.5 grams of 2H
2O (99.9% 2H, ISOTEC, Miamisburg, OH) per kg of
body water and 4 h later another 2.5 grams of the 2H
2O per kg body
water. Body water was calculated to be 50% of body weight in women and 60% in men. Water they ingested ad libitum throughout the fast was enriched to 0.5% with 2H
2O to maintain isotopic steady
state. Peripheral vein blood was drawn at 14, 22, and 42 h into the fast. Urine was collected in most of the subjects at 14–18 and 38–42 h. Analytical procedures. Glucose concentration in plasma was de-termined using glucose oxidase (Beckman Instruments, Inc., Fuller-ton, CA) and beta-hydroxybutyrate in blood using beta-hydroxybu-tyrate dehydrogenase (4). Enrichment in urine was determined by Dr. David Wagner (Metabolic Solutions, Inc., Merrimack, NH) using an isotope ratio mass spectrometer with urines of known enrichments from 0.25 to 0.75% providing a standard curve. Along with urines from the subjects, samples of known enrichment were sent to that laboratory as controls and the enrichment reported for those samples were within 1% of the actual enrichments. Urines were distilled and the distillates gave the same enrichment as the urines, providing fur-ther confidence in the reliability of the assays.
Glucose conversion to xylose. Glucose was isolated by HPLC of a deionized solution from Ba(OH)2 and ZnSO4 deproteinized blood, as
previously detailed (1). The procedure for converting glucose to xy-lose (Fig. 2) was a small scale modification of that used to synthesize (1-14C)xylose from (1-14C)glucose (5). 5 mg of glucose in 1 ml of
ace-tone containing 0.04 ml of concentrated H2SO4 was stirred at room
temperature for 4 h. The mixture was made just alkaline by the addi-tion of 10 N NaOH and filtered. The Na2SO4 cake was washed with
acetone and the combined filtrates evaporated to dryness. 1 ml of 0.01 N HCl was added to the residue, giving a pH near 2, and the so-lution was stirred at 408C for 5 h. The solution was adjusted to pH 8 by the addition of 0.1 N NaOH and extracted with 3 ml 3 3 of ethyl acetate to remove unchanged diacetone glucose. A drop of methyl red indicator, 0.04% in 60% ethanol, and 10 mg of sodium periodate were added to the aqueous solution and the pH was adjusted to about 5 by the addition of 0.01 N NaOH. After 1 h at room temperature the solution was evaporated in vacuo to dryness and 20 mg of anhydrous sodium sulfate was added to the residue to complete drying.
The aldomonoacetone xylose in the residue was extracted into 3 3 2 ml of chloroform. The chloroform was filtered through a plug of anhydrous sodium sulfate and evaporated to dryness. The residue was dissolved in 1 ml of water and 20 mg of NaBH4 was added. After
[image:3.612.59.296.56.250.2]30 min at room temperature excess borohydride was destroyed by the drop-wise addition of 1 N HCl. The solution was evaporated to dry-ness and 5 ml of methanol was added and evaporated to remove bo-rate as methyl bobo-rate. Addition of 5 ml of methanol and its evapora-tion was repeated twice more. The residue after the addievapora-tion of 1 ml Figure 1. Glycerol conversion to glucose and the site of labeling at
carbons 2 and 5 of the glucose by deuterium (bold hydrogen) from deuterated water.
[image:3.612.62.391.589.742.2]of 0.1 N H2SO4 was placed in a boiling water bath for 1 h to hydrolyze
the monoacetone xylose to xylose. The hydrolysate was passed through a column of 1.5 grams AG 50W-X8 in the hydrogen form over 1.5 grams AG 1-X8 in the formate form (Bio-Rad Labs, Her-cules, CA). The column was washed with water and the effluent evap-orated to dryness.
The xylose was purified by HPLC using a Bio-Rad HPX-87P col-umn with water as solvent at 808C and a flow rate of 0.5 ml/min. Xy-lose eluted at 16–18 min. The amount of xyXy-lose in the eluate was determined by the Dische method (6). The yield from glucose was 40–45% of theoretical. A similar yield was obtained beginning with 2 mg of glucose. An adequate yield of xylose for preparation of HMT has been obtained beginning with only 0.7 mg of glucose. In accord with the removal of carbon 6, when (6-3H, 1-14C)glucose was
con-verted to xylose, 99% of the 3H was lost relative to 14C, and when an HMT
was prepared from xylose from (6-3H, 5-14C)glucose . 99% of the 3H
was lost relative to 14C and from (5-3H, 6-14C)glucose 98% of the 14C was
lost relative to 3H. The 3H/14C ratio in the HMT from (5-3 H,5-14C)glucose was the same as in the glucose, indicating no loss of the
hydrogen and no isotope effect. The (1-14C)glucose, (6-14C)glucose,
(5-3H)glucose, and (6-3H)glucose were purchased commercially and
the (5-14C)glucose was synthesized (7).
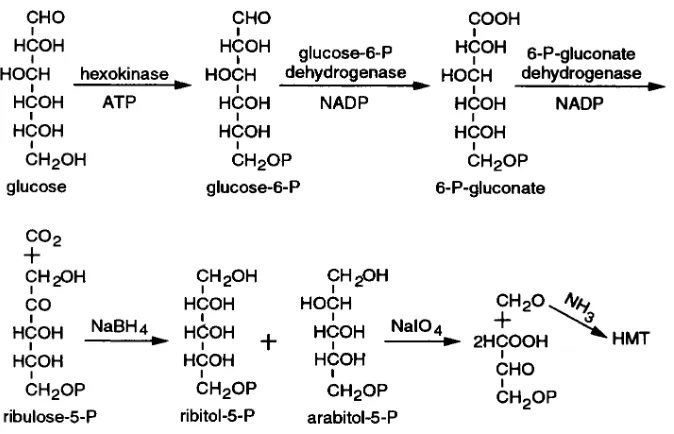
Glucose conversion to ribitol-5-P and arabitol-5-P (Fig. 3).The con-version of glucose to ribulose-5-P was essentially as described (8, 9). The reactions were taken to completion by coupling them to the con-version of a-ketoglutarate to glutamate. The reduction of the ribu-lose-5-P to the polyol phosphates was done by a microscale modifica-tion of the method described in references 10 and 11 (Fig. 3). 2 mg of glucose was incubated for 1 h at 308C in 1 ml of 0.1 M triethanolamine buffer, pH 7.6, with 10 mM MgCl2, 8 mg of ATP, and 4 U of
hexoki-nase. Conversion of the glucose to glucose-6-P was virtually complete as evidenced by retention on an anion exchange column of all the 14C
when an incubate in which the glucose had been labeled with (1-14C)
glucose was passed through the column. After 1 h, 5 mg of a -keto-glutarate, 2 mg of NH4Cl, 6 mg of NADP, 1 U of glucose-6-P
dehy-drogenase, 1 U of 6 phosphogluconate dehydehy-drogenase, and 1.5 U of glutamate dehydrogenase were added, giving a total volume of incu-bate of 1.2 ml (all enzymes and nucleotides were purchased from Sigma Chemical Co., St. Louis, MO). The pH was adjusted to 7.7, re-quiring a small amount, z 0.1 ml, of 1 N NaOH and the incubation
continued for an additional 3 h at 308C.
To stop the reaction 0.1 ml of 50% trichloroacetic acid was added and then a pinch of activated charcoal to absorb the nucleotides (12). The mixture was centrifuged, another pinch of the charcoal added to the supernatant, and the resulting mixture again centrifuged. The
re-moval of the nucleotides from solution was followed by the disap-pearance of absorption at 260 mu. The supernatant was extracted with ether (2 ml 3 3) to remove trichloroacetic acid. It was then passed through the AG 1-X8 ion exchange column in the formate form. The column was washed with water, and then the ribulose-5-P was eluted with 1 N formic acid. That fraction was evaporated to dry-ness.
When (2-3H, 1-14C)glucose was carried through to this stage of the
procedure z 60% of the 3H in the glucose was recovered in the 1 N
formic acid fraction. The amount of ketopentose in the fraction, de-termined using the Dische colorimetric assay (6), was also z 60% of
theoretical. After treatment with phosphatase, on HPLC using the HPX-87P column, there was a single radioactive peak with the mobil-ity of ribulose, giving the color described for a ketopentose (6). While the amount of ribose-5-P isomerase in the enzyme preparation used was reported to be , 0.03%, we were concerned about ribose-5-P as a contaminant. However, there was no evidence of contamination on HPLC, the hydrogen lost in the isomerization of ribulose-5-P to ri-bose-5-P is not the hydrogen bound to carbon 2 of the glucose, and reduction of ribose-5-P also yields ribitol-5-P.
The ribulose-5-P was dissolved in 0.3 ml of water, the solution taken to pH 7 with NaOH, and 2 mg of NaBH4 was added. After 12 h
at room temperature 0.08 ml of 2 N acetic acid followed by 0.05 ml of 7 M NH4OH was added, giving a pH of 8–9. The solution was diluted
to 2 ml with water and passed through a 1 ml column of the AG 1-X8 resin in the acetate form. The column was washed with water and then the polyol phosphates eluted in about 2 ml of 1 N ammonium ac-etate. Cations were removed from the eluate by adding 2–3 grams of AG-50W in the H1 form. The supernatant combined with water washings of the resin was evaporated at room temperature with addi-tions of water to remove acetic acid, and then evaporated to dryness. Traces of borate were removed by addition and evaporation of meth-anol (2 ml 3 3).
The yield of polyol phosphates from the glucose was z 30% of
theoretical. That yield is based on recovery of 3H beginning with
(2-3H)glucose. After phosphatase treatment, two peaks with about
equal radioactivity were found on HPLC using the HPX-87P column, one with the mobility of ribitol and the other with that of arabitol. An HMT prepared from the polyol phosphates obtained on incubation of (2-3H, 2-14C)glucose had the same 3H/14C ratio as the glucose. When
(2-3H, 1-14C)glucose was incubated, HMTs had , 2% of the 14C
rela-tive to 3H in the glucose, in accord with the removal of carbon 1. An
HMT, when (2-3H, 6-14C)glucose was incubated, had , 0.5% of 14C
relative 3H in the glucose, in accord with no formaldehyde being
[image:4.612.59.396.56.273.2]phosphorylated. The failure to form an HMT and hence formalde-hyde on periodic acid oxidation of glucose-6-P was also confirmed.
Preparation and assay of the HMT. The procedure for preparing HMT from xylose and the polyol phosphates was the same as previ-ously detailed for glucose, except we now use for periodate oxidation the conditions of Reeves (13). The oxidation is then completed in 1 h rather than overnight. To the sugar or sugar phosphates in 0.1 ml of water, 0.2 ml of 0.3 M periodic acid and 0.2 ml of 1 N sodium bicar-bonate were added. After 1 h at room temperature, 0.3 ml of 1 N HCl and 0.2 ml of 1.2 N sodium arsenite were added to destroy excess pe-riodate. After the iodine color disappeared the solution was made ba-sic to phenol red by the addition of 0.03 ml of 10 N NaOH and dis-tilled. 1.5 ml of 7 M NH4OH was added to the distillate. The solution
after remaining at room temperature overnight was evaporated to dryness. The HMT in the residue was then assayed for deuterium en-richment by mass spectrometry as previously detailed (1, 14).
Usually 0.4–0.7 mg of glucose, xylose, or the polyol phosphates was oxidized. However, 0.2 mg of glucose or xylose gives sufficient HMT for several repeat assays of 2H enrichment (14). The yields of
HMT from xylose and glucose were z 40% of theoretical, but from
the polyol phosphates only z 30%. Ribulose-5-P, prepared from (2-3H,
2-14C)glucose, gave an HMT on periodic acid oxidation with the same
ratio of label as periodic acid oxidation of polyol phosphates formed from the glucose. However, yields from ribulose-5-P were less, 10– 15%, probably because a hydroxyketo group rather than a dihydroxy group was cleaved (15).
Enrichment in HMTs from carbons 2, 5, and 6 of a blood glucose, prepared in singleton, were determined by mass spectrometry at the same sitting. No HMTs of known 2H enrichment had to be assayed in
order to determine absolute enrichment, since the ratio of the peaks of m 11 (mass 141) of the HMTs from carbons 2, 5, and 6 above background were equivalent to the ratios of their absolute enrich-ments. However, at each sitting HMTs from formaldehyde of 0.125, 0.25, 0.5, and 1.0% 2H enrichment, prepared from (1-2H
1)sorbitol as
previously detailed (1, 14), were also assayed. That allowed the abso-lute enrichments of the hydrogens bound to the carbons to be com-pared with the enrichment in urinary water. Background was mea-sured on HMTs prepared from blood glucose from subjects before ingesting 2H
2O.
As further support for the procedures, HMTs from formalde-hydes from polyol phosphates formed from (2-2H)glucose of 0.25,
0.50, and 1.0% enrichments and from xylose prepared from (2H 7
)glu-cose of 0.25, 0.50, and 1.0% enrichments gave the same readings as the corresponding HMTs form (1-2H
1)sorbitol. The readings of the
sorbitol standards varied very little from sitting to sitting. The (1-2
H)glu-cose used to prepare the (1-2H
1)sorbitol, the (2-2H)glucose, and
(2H
7)glucose were purchased from Cambridge Isotope Laboratories
(Andover, MA).
Calculations. The enrichment in the HMT from carbon 6 of glu-cose was divided by two because there are two hydrogens bound to carbon 6 that are enriched. The enrichments in the HMTs from form-aldehyde from xylose and the polyol phosphates were those in the hy-drogens bound, respectively, to carbons 5 and 2 of the glucose. That is because the source of one of the two hydrogens bound to the formal-dehyde carbon 5 was NaBH4 and the source of one of the two
hydro-gens bound to formaldehyde carbon 2 was a H1 in the incubation me-dium. The fraction of blood glucose produced due to gluconeogenesis was calculated by dividing the enrichment at carbon 5 at 14, 22, and 42 h by that at carbon 2 at 42 h of fasting. The assumption that at 42 h the enrichment at carbon 2 was essentially that in body water was tested by the ratios of those enrichments. The ratio of enrichments at carbon 2 at 14 and 22 h to that at carbon 2 at 42 h was calculated to provide an estimate of the extent of equilibration of glucose-6-P with fructose-6-P during glycogenolysis. The enrichment at carbon 6 to carbon 2 was calculated to give an estimate of the fraction of glucose production via gluconeogenesis from pyruvate (1). The difference be-tween that fraction and the fraction calculated from the carbon 5 to carbon 2 ratio provided a measure of the contribution of glycerol to
gluconeogenesis and the equilibration of the hydrogens in pyruvate with those of body water during the course of gluconeogenesis. Means6standard errors of the means were calculated.
Results
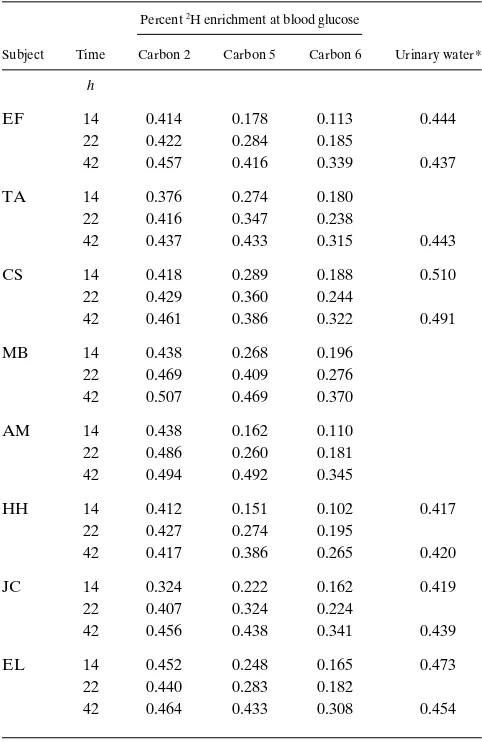
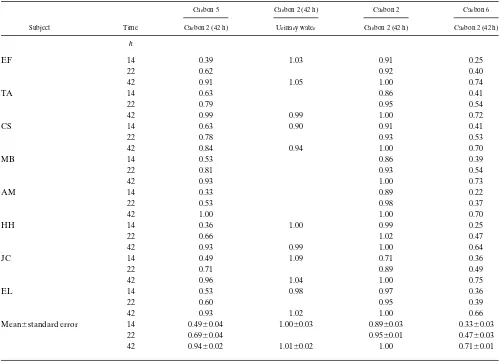
Plasma glucose concentration was 5.260.1 mM after 14 h and 4.360.1 mM after 42 h of fasting. Blood beta-hydroxybutyrate concentration was 76625 mM at 14 h and 11276153 mM at 42 h. The enrichments of the hydrogens at carbons 2, 5, and 6 of blood glucose and in urinary water from the eight subjects are recorded in Table I and the ratios of those enrichments in Ta-ble II. The ratio of enrichment at carbon 5 at 14 h to that at carbon 2 at 42 h was 0.4960.04 (Table II), meaning the per-centage of glucose production due to gluconeogenesis after 14 h varied, but was z 50%. The ratio of the enrichment at carbon
5 at 22 h to that at carbon 2 at 42 h gives an estimated gluco-neogenesis contribution at 22 h of 6964%. The corresponding ratio at 42 h indicates a contribution of 9462%.
In glycogenolysis z 10% of the glucose released arises
[image:5.612.314.555.82.453.2]from the hydrolysis of the branch points in the glycogen, i.e., without glucose-6-P as an intermediate. That glucose would
Table I. Enrichment in Deuterium in Hydrogens at Carbons 2, 5, and 6 of Blood Glucose and in Urinary Water
Percent 2H enrichment at blood glucose
Subject Time Carbon 2 Carbon 5 Carbon 6 Urinary water*
h
EF 14 0.414 0.178 0.113 0.444
22 0.422 0.284 0.185
42 0.457 0.416 0.339 0.437
TA 14 0.376 0.274 0.180
22 0.416 0.347 0.238
42 0.437 0.433 0.315 0.443
CS 14 0.418 0.289 0.188 0.510
22 0.429 0.360 0.244
42 0.461 0.386 0.322 0.491
MB 14 0.438 0.268 0.196
22 0.469 0.409 0.276
42 0.507 0.469 0.370
AM 14 0.438 0.162 0.110
22 0.486 0.260 0.181
42 0.494 0.492 0.345
HH 14 0.412 0.151 0.102 0.417
22 0.427 0.274 0.195
42 0.417 0.386 0.265 0.420
JC 14 0.324 0.222 0.162 0.419
22 0.407 0.324 0.224
42 0.456 0.438 0.341 0.439
EL 14 0.452 0.248 0.165 0.473
22 0.440 0.283 0.182
42 0.464 0.433 0.308 0.454
then bear no 2H at carbons 2, thus resulting in an
underestima-tion of the contribuunderestima-tion of glycogenolysis. Correcting for that glucose increases the contribution of glycogenolysis at 14 h from 51% to [(51 1 5)/105]100 5 53% with the contribution of gluconeogenesis reduced to 4764%. The corrected contribu-tions of gluconeogenesis are then 6764% at 22 h and 9362% at 42 h.
The enrichment in urinary water collected at 14–18 h was the same, z 0.5%, as at 38–42 h, as expected from the amounts
and times of 2H
2O administrations. That agrees with our
previ-ous experience under the same conditions. Thus, a constant enrichment in urinary water was achieved by 14 h and presum-ably for several hours before, since the last dose of 2H
2O was
ingested 9 h into the fast.
In the conversion of fructose-6-P to glucose-6-P during glu-coneogenesis, there is labeling at carbon 2 of the glucose-6-P through an exchange with water. Exchange resulting in labeling at carbon 2 of glucose-6-P formed by glycogenolysis depends upon the extent the glucose-6-P is converted to fructose-6-P before its conversion to glucose. When (2-3H, 2-14C)galactose
was infused into subjects fasted overnight, the 3H/14C ratio in
blood glucose was z 20% of that in the galactose, suggesting
that in gluconeogenesis z 80% of the hydrogen at carbon 2
equilibrates with water (2). In addition to exchange with water, interconversion of glucose-6-P with fructose-6-P occurs with hydrogen transfer, the intramolecular movement of hydrogen
between carbons 1 and 2 of the hexose-6-phosphates (16). In-tramolecular movement of the hydrogen bound to carbon 2 of glucose-6-P formed in glycogenolysis began with a hydrogen unenriched in deuterium. However, movement of the hydro-gen bound to carbon 1 of fructose-6-P formed by gluconeohydro-gen- gluconeogen-esis began with a hydrogen already enriched to the extent of the hydrogens bound to carbon 6. That is because the four hy-drogens bound to carbons 1 and 6 of the fructose-6-P derive from the hydrogens bound to carbon 3 of the triose phos-phates. That the hydrogen bound to carbon 2 of glucose-6-P formed from fructose-6-P by gluconeogenesis reached the en-richment in body water is evidenced by the absence of a dis-cernible difference between the enrichment at carbon 2 at 42 h and the enrichment in urinary water.
The lower ratio of enrichment at carbon 2 at 14 and 22 h to that at 42 h then provides a measure of the extent of the equil-ibration of the hydrogen at carbon 2 of glucose-6-P with that in water during glycogenolysis. Since the mean ratio at 14–42 h was 0.89 when there was 53% glycogenolysis, the extent of equilibration was [(89 2 47)/53]100 5 79%. At 22 h it was [(95 2
67)/33]100 5 85%. We do not know why we did not find lower enrichments at carbon 2 at 14 h than at 42 h in our previous study (1), when assaying enrichment by transferring the hydro-gen at carbon 2 to lactate.
[image:6.612.56.557.71.433.2]The proportions of gluconeogenesis calculated from the ra-tios at carbon 6 to carbon 2 at 42 h were 3363% at 14 h,
Table II. Ratios of Enrichments in Table I
Carbon 5 Carbon 2 (42 h) Carbon 2 Carbon 6
Subject Time Carbon 2 (42 h) Urinary water Carbon 2 (42 h) Carbon 2 (42 h)
h
EF 14 0.39 1.03 0.91 0.25
22 0.62 0.92 0.40
42 0.91 1.05 1.00 0.74
TA 14 0.63 0.86 0.41
22 0.79 0.95 0.54
42 0.99 0.99 1.00 0.72
CS 14 0.63 0.90 0.91 0.41
22 0.78 0.93 0.53
42 0.84 0.94 1.00 0.70
MB 14 0.53 0.86 0.39
22 0.81 0.93 0.54
42 0.93 1.00 0.73
AM 14 0.33 0.89 0.22
22 0.53 0.98 0.37
42 1.00 1.00 0.70
HH 14 0.36 1.00 0.99 0.25
22 0.66 1.02 0.47
42 0.93 0.99 1.00 0.64
JC 14 0.49 1.09 0.71 0.36
22 0.71 0.89 0.49
42 0.96 1.04 1.00 0.75
EL 14 0.53 0.98 0.97 0.36
22 0.60 0.95 0.39
42 0.93 1.02 1.00 0.66
Mean6standard error 14 0.4960.04 1.0060.03 0.8960.03 0.3360.03
22 0.6960.04 0.9560.01 0.4760.03
4763% at 22 h, and 7161% at 42 h. These percentages are in agreement with those previously reported under the same con-ditions (1), except then the percentages at 14 and 22 h, 3562% and 3862%, were not significantly different. The differences in the rate of gluconeogenesis calculated from the 6/2 ratio to that from the 5/2 ratio is 16% at 14 h, 22% at 22 h, and 23% at 42 h. Those differences are due to the sum of incomplete equil-ibration of the hydrogens that become those bound to carbon 6 of the glucose in the process of gluconeogenesis and the con-tribution of glycerol to gluconeogenesis. Equilibration with body water after an overnight fast has been estimated to be
z 80% from the finding that on infusing (3-3H,3-14C)lactate
the 3H/14C ratio in glucose was
z 0.2 of that in the lactate (1,
2). The contribution of glycerol to glucose production has been estimated to be z 3% after an overnight fast (17) and 10%
af-ter 60 h of fasting (18). At 42 h then 94 2 10 5 84% would have been the rate estimated from the 6/2 ratio if equilibration had been complete. Therefore (71/84)100 5 85% was the ex-tent of that equilibration. At 14 h the equilibration calculates to [33/(49 2 3)]100 5 72%.
Discussion
Almost all of glucose production after 42 h of fasting would be expected to be via gluconeogenesis. The estimate of 93% ful-fills that expectation. Consistent with a 7% contribution of gly-cogenolysis is the rate of glygly-cogenolysis suggested to occur in individuals at 40 h of fasting, from estimates of declines in he-patic glycogen content (19, 20). The 7% difference between the enrichment at carbon 5 and that in water at 42 h could be due in part or completely to an isotope effect. If so, the contri-butions of gluconeogenesis would be underestimated at the most by 3% at 14 h. Evidence for the absence of an isotope ef-fect is found on incubation of hepatocytes with lactate in the presence of 3H
2O and measurement of 3H at carbon 2 and
car-bons 3, 4, and 5 of the glucose formed (21), measurement of 3H
at carbon 2 of glucose on giving fasted rats 3H
2O (22), and
measurement of enrichment at carbon 5 of glucose on giving rats 2H
2O (23). The similar enrichment at carbon 2 and water
at 42 h is also good evidence for a lack of discrimination in la-beling at carbon 2.
We have considered trivial the extent glucose released from the branch points experiences glucose cycling, i.e., forma-tion of glucose-6-P from the glucose and concomitant hydroly-sis to glucose, during which 2H would be bound to the
hydro-gen at carbon 2. Cycling has been reported to be 11–20% of glucose production after an overnight fast (24–28).2 That
would reduce the glucose formed from glycogen, without ex-periencing glucose-6-P formation, from perhaps 10 to 8%. At 8% the corrected values would remain essentially unchanged, e.g., at 14 h [(51 1 4)/104]100 5 53%. No significant cycling between glucose-6-P and triose-P after an overnight fast was found in one study (24), but was estimated to be 13% of glu-cose-6-P conversion to glucose in another study (31). Glucosyl units of glycogen converted to glucose-6-P in the process of glycogenolysis and experiencing that cycling, as well as fruc-tose-6-P formed from glycogen and subjected to the transaldo-lase exchange reaction (7), would be included in the fraction of
glucose formed by gluconeogenesis. Thus, if cycling were 13%, an estimate of 50% gluconeogenesis would reduce to 43.5%. We have assumed there was sufficient turnover of glucose, af-ter the enrichment in waaf-ter reached steady state, so that the lower enrichment at carbon 2 at 14 than 42 h was due to in-complete isotopic equilibration at the hexose-6-P level. Alter-natively, there was insufficient turnover of glucose. Then as a maximum, assuming complete equilibration, percent gluco-neogenesis at 14 h from ratio of enrichment at carbon 5 to that carbon 2 at 14 h, would be 56% rather than 47%. Similarly at 22 h, percent gluconeogenesis would be 73%. If equilibration of dihydroxyacetone-3-P with glyceraldehyde-3-P was 90% complete (3, 32), by assuming it was complete, with glycerol’s contribution to gluconeogenesis 10%, the contribution of glu-coneogenesis would be underestimated by 1%. These consid-erations in total should affect the estimates very little.
Determinations of the contribution of gluconeogenesis to glucose production in healthy subjects after an overnight fast have ranged from 25 to 70% (19, 33–41). That spread may be attributed in part to dietary preparation, but even with the same preparation, there has been marked variation in glyco-gen stores at the beginning of fasting (34). Several of the esti-mates required a number of uncertain assumptions or the method has been shown to be invalid (42–44). Measurements of net splanchnic exchange of glucose and precursor substrates give contributions after an overnight fast from 25–35% (39–41) and after 60 h of fasting 85–90% (39, 45, 46). While these esti-mates are somewhat lower than present estiesti-mates, splanchnic net balance calculations do not account for hepatic uptake of substrates formed within the splanchnic bed, e.g., gut release of lactate or amino acids (47), nor do they allow for splanchnic extrahepatic glucose utilization and the contribution by kidney to glucose production (48). Estimates from incorporation of la-bel from a lbeled gluconeogenic substrate, e.g., lactate or ala-nine, are uncertain because of dilution of label in the Krebs cy-cle and the need to estimate the enrichment or specific activity of pyruvate in liver (43). Our method eliminated those uncer-tainties, since 2H is incorporated for each molecule of
gluco-neogenic substrate converted to glucose and the enrichment of the 2H is that in body water.
Shulman and associates (19, 34) estimated gluconeogenic rates by determining the rate of glycogenolysis, using NMR to measure hepatic glycogen content and MRI to measure liver volume. They then subtracted the rate of glycogenolysis from the rate of glucose production, measured from glucose kinetics using (6-3H)glucose. Gluconeogenesis was calculated to
ac-count for z 65% of glucose production during the first 22 h of
fasting, 82% during the next 24 h of fasting, and 96% from 46– 64 h of fasting, in good agreement with our estimates. How-ever, they found the rate of gluconeogenesis to be linear over the first 22 h of fasting. Recently, they estimated gluconeogen-esis contributes z 50% to glucose production during the first
12 h of fasting (49). If the concentration of hepatic glycogen regulates its rate of breakdown (50), a greater amount of gly-cogenolysis might be expected in the earlier hours of fasting. Their method measures glucose production from liver and to the extent it occurs from kidney (48), while measuring glyco-genolysis from liver. The contribution of gluconeogenesis is not measured directly, but rather depends on an estimate of the difference in hepatic glycogen content (51) at some dis-tance in time and the accuracy of the glucose production mea-surement. The 2H
2O method measures the contribution of
coneogenesis whether from liver or kidney, since each glucose produced, if formed via gluconeogenesis, bears label at car-bons 2 and 5 and via glycogenolysis at carbon 2.
Infusing 13C-labeled lactate, Lee et al. (37), using mass
iso-topomer distribution analysis, reported gluconeogenic contri-butions of 39–50% in three subjects after an overnight fast and of 71% in one subject after a 24-h fast. Infusing 13C-labeled
glycerol, Hellerstein et al. (38) estimated gluconeogenic contri-butions after an overnight fast of 30–40%. Estimates using mass isotopomer distribution analysis require the assumption of a single pool of triose-P from which the glucose is formed or multiple pools with similar enrichments of 13C (3). Infusing
rel-atively small quantities of [U-13C]glycerol, after many hours of
fasting, the assumption apparently was not fulfilled (3). With higher quantities it apparently was, at least in the rat (32, 52), although infusing those quantities could alter gluconeogenic rates and under different conditions the requirement of a sin-gle enriched pool or its equivalent might not be achieved. With the 2H
2O method all pools presumably experience the
enrich-ment of body water.
An assumption in the 2H
2O method is that glycogen
cy-cling, i.e., simultaneous glycogen synthesis and breakdown, does not compromise the estimates. The extent of cycling, if any, in liver in the fasting state has not been measured. We es-timated glycogen cycling to be minimal after giving a glucose load (53). After giving a larger load, cycling was estimated to be much higher in particular in subjects who ingested a high carbohydrate diet (50). Only if the glucose-6-P synthesized by gluconeogenesis was deposited, and if in its place an unlabeled glucosyl unit was released as glucose, and in the process label-ing occurred at carbon 2, would glycogenolysis be concluded in the face of no change in glycogen content. This would not oc-cur as long as last deposited is first removed (54, 55). If labeled glucose formed at an early time during fasting was deposited in glycogen and impacted on the labeling of blood glucose re-leased from glycogen at a later time during the fast, previous results (1) would have been expected to be different. The car-bon 6 to carcar-bon 2 ratio we found in blood glucose drawn 14 h into a fast and 4 h after giving D2O, while the subjects were
few in number, should have been different than the ratio in blood glucose drawn 14 h into a fast and 9 h after giving D2O.
Our estimates of gluconeogenesis in agreement with those re-ported using NMR also suggest glycogen cycling were not a factor. If glucose-6-P synthesized by gluconeogenesis is con-verted to glycogen and then released, it is calculated as glucose produced by gluconeogenesis.
In conclusion, rates of gluconeogenesis can be measured safely by the 2H
2O method using enrichments at carbons 2 and
5 of blood glucose and in urinary water. At steady state the ra-tio of enrichment at carbon 5 to urinary water is directly the fraction of glucose formed via gluconeogenesis. Not at steady state, the fraction is the ratio of enrichment at carbon 5 to car-bon 2 with correction to the enrichment at carcar-bon 2 for reac-tions within the course of glycogenolysis. After an overnight fast gluconeogenesis accounts for z 50% of glucose
produc-tion, increases by 22 h, and by 42 h of fasting accounts for al-most all of glucose production in healthy subjects.
Acknowledgments
We gratefully acknowledge the excellent technical assistance of Lourdes Gruca.
This study was supported by National Institutes of Health grants DK-14507 and P50 HD-11089 and grant 89-0418 from the Bank of Sweden Tercentenary Foundation.
References
1. Landau, B.R., J. Wahren, V. Chandramouli, W.C. Schumann, K. Ekberg, and S.C. Kalhan. 1995. Use of 2H
2O for estimating rates of gluconeogenesis. J. Clin. Invest. 95:172–178.
2. Wajngot, A., V. Chandramouli, W.C. Schumann, K. Kumaran, S. Efen-dic, and B.R. Landau. 1989. Testing of the assumptions made in estimating the extent of futile cycling. Am. J. Physiol. 256:E668–E675.
3. Landau, B.R., C.A. Fernandez, S.F. Previs, K. Ekberg, V. Chandramouli, J. Wahren, S.C. Kalhan, and H. Brunengraber. 1995. A limitation in the use of mass isotopomer distributions to measure gluconeogenesis in fasting humans. Am. J. Physiol. 269:E18–E26.
4. Williamson, D.H., and J. Mellanby. 1974. d-(-)-3-Hydroxybutyrate. In
Methods of Enzymatic Analysis. H.U. Bergmeyer, editor. Verlag Chemie Inter-national, Deerfield Beach, FL. 1836–1839.
5. Sowden, J.C. 1951. Preparation of 1-C14
-d-xylose from 1-C14-d-glucose. J.
Am. Chem. Soc. 73:5496–5497.
6. Dische, Z., and E. Borenfreund. 1957. A new color reaction for the deter-mination of aldopentose in the presence of other saccharides. Biochim. Bio-phys. Acta. 23:639–642.
7. Ljungdahl, L., H.G. Wood, E. Racker, and D. Couri. 1961. Formation of unequally labeled fructose-6-phosphate by an exchange reaction catalyzed by transaldolase. J. Biol. Chem. 236:1622–1625.
8. Kalhan, S.C., S.M. Savin, and P.A.J. Adam. 1977. Estimation of glucose turnover with stable tracer glucose-1-13C. J. Lab. Clin. Med. 89:285–294.
9. Schäffer, L., and B. Tronier. 1989. Enzymatic determination of 1-14 C-glu-cose in pig plasma. Diabetologia. 32:660–662.
10. Baddiley, J., J.G. Buchanan, B. Carss, and A.P. Mathias. 1956. Cytidine diphosphate ribitol from Lacobacillus arabinosus. J. Chem. Soc. 4583–4588.
11. Stetten, M.R., and J.J. Kehoe. 1971. Synthesis of d-ribitol-5-phosphate
by an inorganic pyrophosphate-ribitol phosphotransferase activity of microso-mal glucose-6-phosphatase. Biochim. Biophys. Acta. 250:501–513.
12. Crane, R.K., and F. Lipmann. 1953. The effect of arsenate on aerobic phosphorylation. J. Biol. Chem. 201:235–253.
13. Reeves, R.E. 1941. The estimation of primary carbinol groups in carbo-hydrates. J. Am. Chem. Soc. 63:1476–1477.
14. Kalhan, S.C., R. Trivedi, S. Singh, V. Chandramouli, W.C. Schumann, and B.R. Landau. 1995. A micromethod for measurement of deuterium bound to carbon 6 of glucose to quantify gluconeogenesis in-vivo. J. Mass. Spec. 30: 1588–1592.
15. Jackson, E.L. 1944. Periodic acid oxidation. Org. React. 2:341–375. 16. Rose, I.A., and E.L. O’Connell. 1961. Intramolecular hydrogen transfer in the phosphoglucose isomerase reaction. J. Biol. Chem. 236:3086–3092.
17. Nurjhan, N., A. Consoli, and J. Gerich. 1992. Increased lipolysis and its consequences on gluconeogenesis in non–insulin-dependent diabetes mellitus. J. Clin. Invest. 89:169–175.
18. Wahren, J., S. Efendic, R. Luft, L. Hagenfeldt, O. Bjorkman, and P. Fe-lig. 1977. Influence of somatostatin on splanchnic glucose metabolism in post-absorptive and 60-h fasted humans. J. Clin. Invest. 59:299–307.
19. Rothman, D.L., I Magnusson, R.G. Shulman, and G.I. Shulman. 1991. Quantitation of hepatic glycogenolysis and gluconeogenesis in fasting humans
with 13C NMR. Science (Wash. DC). 254:573–576.
20. Nilsson, L.H., and E. Hultman. 1973. Liver glycogen in man: the effect of total starvation or a carbohydrate poor diet followed by carbohydrate re-feeding. Scand. J. Clin. Lab. Invest. 32:325–330.
21. Rognstad, R., D.G. Clark, and J. Katz. 1974. Glucose synthesis in triti-ated water. Eur. J. Biochem. 47:383–388.
22. Kuwajima, M., S. Golden, J. Katz, R.H. Unger, D.W. Foster, and J.D. McGarry. 1986. Active hepatic glycogen synthesis from gluconeogenic precur-sors despite high tissue levels of fructose 2, 6-bisphosphate. J. Biol. Chem. 261: 2632–2637.
23. Guo, Z.K., W.-N.P. Lee, J. Katz, and A.E. Bergner. 1992. Quantitation of positional isomers of deuterium-labeled glucose by gas chromotography/ mass spectrometry. Anal. Biochem. 204:273–282.
24. Karlander, S., A. Roovete, M. Vranic, and S. Efendic. 1986. Glucose and fructose-6-P cycle in humans. Am. J. Physiol. 251:E530–536.
25. Karlander, S., A. Khan, A. Wajngot, O. Torring, M. Vranic, and S. Efendic. 1989. Glucose turnover in hyperthyroid patients with normal toler-ance. J. Clin. Endocrinol. & Metab. 68:780–786.
26. Buttler, P., and R. Rizza. 1991. Contributions to postprandial hypergly-cemia and effect on splanchnic glucose clearance of hepatic glucose cycling in glucose intolerant or NIDDM patients. Diabetes. 40:73–81.
27. Calles-Escandon, J. 1994. Insulin dissociates hepatic glucose cycling and glucagon-induced thermogenesis in man. Metab. Clin. Exp. 43:1000–1005.
Metab. 77:1180–1183.
29. Shulman, G.I., P.W. Ladenson, M.H. Wolfe, E.C. Ridgeway, and R.R. Wolfe. 1985. Substrate cycling between gluconeogenesis and glycolysis in eu-thyroid, hypothyroid and hyperthyroid man. J. Clin. Invest. 76:757–764.
30. Miyoshi, H., G.I. Shulman, E.J. Peters, M.H. Wolfe, D. Elahi, and R.R. Wolfe. 1988. Hormonal control of substrate cycling in humans. J. Clin. Invest. 81:1545–1555.
31. Magnusson, I., A. Wennlund, V. Chandramouli, W.C. Schumann, K. Kumaran, J. Wahren, and B.R. Landau. 1990. Fructose-6-phosphate cycling and the pentose cycle in hyperthyroidism. J. Clin. Endocrinol. & Metab. 70:461– 466.
32. Neese, R.A., J.-M. Schwarz, D. Faix, S. Turner, A. Letscher, D. Vu, and M.K. Hellerstein. 1995. Gluconeogenesis and intrahepatic triose phosphate flux in response to fasting or substrate loads. J. Biol. Chem. 270:14452–14463.
33. Consoli, A., F.P. Kennedy, J. Miles, and J.E. Gerich. 1987. Determina-tion of Krebs cycle metabolic carbon exchange in vivo and its use to estimate in-dividual contributions of gluconeogenesis and glycogenolysis to overall output in man. J. Clin. Invest. 80:1303–1310.
34. Magnusson, I., D.L. Rothman, L.D. Katz, R.G. Shulman, and G.I. Shul-man. 1992. Increased rate of gluconeogenesis in type II diabetes mellitus. J. Clin. Invest. 90:1323–1327.
35. Pimenta, W., N. Nurjhan, P.A. Jansson, M. Stumvoll, J. Gerich, and M. Korytkowski. 1994. Glycogen: its mode of formation and contribution to he-patic glucose output in postabsorptive humans. Diabetologia. 37:697–709.
36. Gay, L.J., Ph. Schneiter, Y. Schutz, E. Di Vetta, E. Jequier, and L. Tappy. 1994. A non-invasive assessment of hepatic glycogen kinetics and post-absorptive gluconeogenesis in man. Diabetologia. 37:517–523.
37. Lee, W.P., S. Bassilian, E.A. Bergner, P. Wals, and J. Katz. 1994. Mass isotopomer study of gluconeogenesis with 13C labeled lactate in man. Clin. Res. 42:28A.
38. Hellerstein, M., R. Neese, P. Linfoot, M. Christiansen, and S. Turner. 1995. Contribution from gluconeogenesis (GNG) to fasting blood glucose mea-sured by mass isotopomer distribution analysis (MIDA) in normal humans. Di-abetes. 44:153A.
39. Bratusch-Marrain, P., O. Björkman, L. Hagenfeldt, W. Waldhäusl, and J. Wahren. 1979. Influence of arginine on splanchnic glucose metabolism in man. Diabetes. 28:126–131.
40. Björkman, O., R. Gunnarsson, E. Hagström, P. Felig, and J. Wahren. 1989. Splanchnic and renal exchange of infused fructose in insulin-deficient type I diabetic patients and healthy controls. J. Clin. Invest. 83:52–59.
41. Wahren, J., A. Wennlund, L.H. Nilsson, and P. Felig. 1981. Influence of hyperthyroidism on splanchnic exchange of glucose and gluconeogenic
precur-sors. J. Clin. Invest. 67:1056–1063.
42. Chiasson, J.L., L. Lijenquist, W.W. Lacy, A. Jennings, and A.D. Cher-rington. 1977. Gluconeogenesis. Methodologic approaches in vivo. Fed. Proc. 36:229–235.
43. Landau, B.R. 1993. Estimating gluconeogenic rates in NIDDM. Adv. Exp. Med. Biol. 334:209–220.
44. Schumann, W.C., I. Magnusson, V. Chandramouli, K. Kumaran, J. Wahren, and B.R. Landau. 1991. Metabolism of (2-14C)acetate and its use in as-sessing hepatic Krebs cycle activity and gluconeogenesis. J. Biol. Chem. 266: 6985–6990.
45. Björkman, O., P. Felig, and J. Wahren. 1986. The role of basal glucagon levels in the regulation of splanchnic glucose output and ketogenesis in insulin-deficient humans after an overnight and 60 hr fast. Clin. Physiol. 4:227–241.
46. Björkman, O., P. Felig, and J. Wahren. 1980. The contrasting responses of splanchnic and renal glucose output to gluconeogenic substrate administra-tion and hypoglucagonemia in 60-h-fasted humans. Diabetes. 29:610–616.
47. Björkman, O., L.S. Eriksson, B. Nyberg, and J. Wahren. 1990. Gut ex-change of glucose and lactate in basal state and after oral glucose ingestion in postoperative patients. Diabetes. 39:747–751.
48. Stumvoll, M., U. Chintalapudi, G. Perriello, S. Welle, O. Gutierez, and J. Gerich. 1995. Uptake and release of glucose by human kidney. J. Clin. Invest. 96:2528–2533.
49. Petersen, K.F., T. Price, G.W. Cline, D.L. Rothman, and G.I. Shulman. 1996. Contribution of net hepatic glycogenolysis to glucose production during the early postprandial period. Am. J. Physiol. 270:E186–E191.
50. Magnusson, I., D.L. Rothman, B. Jucker, G.W. Cline, R.G. Thulman, and G.I. Shulman. 1994. Liver glycogen turnover in fed and fasted humans. Am. J. Physiol. 266:E796–E803.
51. Gruetter, R., I. Magnusson, D.L. Rothman, M.J. Avison, R.G. Shulman,
and G.I. Shulman. 1994. Validation of 13C NMR measurements of liver
glyco-gen in vivo. Magn. Reson. Med. 31:583–588.
52. Peroni, O., V. Large, and M. Beylot. 1995. Measuring gluconeogenesis with (2-13C) glycerol and mass isotopomer distribution analysis of glucose. Am. J. Physiol. 269:E516–E523.
53. Wajngot, A., V. Chandramouli, W.C. Shumann, S. Efendic, and B.R. Landau. 1991. Quantitation of glycogen/glucose-1-P cycling in liver. Metab. Clin. Invest. 40:877–881.
54. Landau, B.R., J.R. Leonards, and F.M. Barry. 1960. A quantitative study of glucagon-induced hepatic glycogenolysis. Am. J. Physiol. 199:231–234.