0095-1137/96/$04.0010
Copyrightq1996, American Society for Microbiology
Comparison of Spiral Gradient Endpoint and Agar Dilution
Methods for Susceptibility Testing of Anaerobic Bacteria:
a Multilaboratory Collaborative Evaluation
HANNAH M. WEXLER,1,2* ERIC MOLITORIS,2PATRICK R. MURRAY,3JOHN WASHINGTON,4
RONALD J. ZABRANSKY,5PAUL H. EDELSTEIN,6ANDSYDNEY M. FINEGOLD1,2,7,8
Medical7and Research1Services, Veterans Affairs Medical Center West Los Angeles, and Departments of
Medicine2and Microbiology and Immunology,8School of Medicine, University of California, Los Angeles,
Los Angeles, California; Department of Pathology, Washington University School of Medicine,
St. Louis, Missouri3; Department of Clinical Pathology, The Cleveland Clinic Foundation,
Cleveland, Ohio4; Department of Clinical Microbiology and Immunology, University of Texas
Medical Branch, Galveston, Texas5; and Department of Pathology and Laboratory
Medicine and Department of Medicine, University of Pennsylvania School
of Medicine, Philadelphia, Pennsylvania6
Received 12 December 1994/Returned for modification 14 December 1994/Accepted 2 October 1995
A multilaboratory collaborative study was carried out to assess the utility of the spiral gradient endpoint (SGE) method for the determination of the antimicrobial susceptibilities of anaerobes and to evaluate the equivalence of the MICs obtained by the SGE method with those obtained by the reference agar dilution method of the National Committee for Clinical Laboratory Standards. The standard deviation of the MIC obtained by the SGE method for the five participating laboratories was60.26 of a twofold dilution, whereas it was61 twofold dilution by the reference method. The interlaboratory reproducibility of the results for two control strains tested with imipenem, chloramphenicol, and metronidazole indicated that 96% of the measure-ments fell within61 twofold dilution of the mode. The equivalence of the SGE method with the agar dilution method was assessed with a wide variety of anaerobic organisms. The MICs by both methods were within 1 doubling dilution in 93% of the measurements (n 5 1,074). Discrepancies generally occurred with those organism-drug combinations that resulted in tailing endpoints (Fusobacterium nucleatum, 86% agreement) or in cases of light growth (Peptostreptococcusspp., 86% agreement).
The necessity of performing susceptibility tests on anaerobic isolates has been reviewed (3, 13), and revised recommenda-tions have recently been published by the National Committee for Clinical Laboratory Standards (NCCLS) (6). The recom-mendations outline the circumstances (i.e., patient status, type of infection, and method of treatment) which warrant suscep-tibility testing. Because commonly isolated pathogenic anaer-obes may have unpredictable susceptibility patterns, the resis-tance patterns of sufficient numbers of anaerobes should be periodically monitored to detect trends in the development of resistance. While laboratories may use the NCCLS reference agar dilution method, this method is time- and labor-intensive, and the inherent61 dilution error results in ambiguous results for a large proportion of the isolates normally tested.
The spiral plater (Spiral Biotech, Bethesda, Md.) has been used for bacterial enumeration for almost two decades (2), and the use of the spiral gradient endpoint (SGE) method for determining MICs was introduced in 1990 (4, 7). The antibiotic concentration gradient on one plate typically spans 8 twofold dilutions, thus considerably minimizing the time and materials needed to perform the test (compared with those required by the NCCLS reference agar dilution method).
The purpose of the multilaboratory collaborative study de-scribed here was to assess the utility of the SGE method for the determination of the antimicrobial susceptibilities of
anaer-obes, evaluate the equivalence of the MICs obtained by the SGE method (SGE MICs) with those obtained by the refer-ence agar dilution method, and assess the causes for the dif-ferences between them. Phase 1 of the analysis measured the intralaboratory repeatability and the interlaboratory reproduc-ibility of the method, and phase 2 assessed the equivalence of the SGE and agar dilution methods.
MATERIALS AND METHODS
Organisms used. (i) Phase 1.Control strains (Bacteroides fragilis ATCC 25285 and Bacteroides thetaiotaomicron ATCC 29741) were purchased and sent to each laboratory to eliminate any possibility that the laboratories’ own quality control strains had developed variations. Five laboratories (laboratories A to E) partic-ipated in the study.
(ii) Phase 2.Laboratory C was not able to participate in the study; four laboratories (laboratories A, B, D, and E) participated, and laboratory A tested the isolates originally designated for laboratory C. Each laboratory tested 40 clinical isolates. In some cases, strains were sent from the Wadsworth Anaerobe Laboratories (Veterans Affairs Medical Center, West Los Angeles) to the testing laboratory (if that laboratory did not have sufficient strains of the particular species). Bacteria were identified by established procedures (9).
Preparation of inocula. (i) Phase 1.The inoculum was prepared in accordance with NCCLS approved standard M11-A2 (6) by using overnight incubation of colonies transferred from blood agar plates (the direct suspension method was not used to avoid differences that may be due to the selection of colonies of different sizes by the different laboratories).
(ii) Phase 2.The inoculum for each isolate was prepared by either of the alternatives of NCCLS approved standard M11-A2 (6); the density was adjusted to match that of a 0.5 McFarland barium sulfate standard and was used for both SGE and agar dilution plates.
Media. (i) Phase 1: repeatability (within the same laboratory), reproducibility (between laboratories), and presence of systematic errors (bias) in SGE end-point measurements.Plates (diameter, 150 mm) prepared from the same lot of medium (brucella laked-blood agar [9]) by Anaerobe Systems (San Jose, Calif.) were provided to all participating laboratories.
* Corresponding author. Mailing address: Microbial Diseases Re-search Laboratory, Bldg. 304, Room E3-224, VA Wadsworth Medical Center 691/151J, Los Angeles, CA 90073. Phone: (310) 268-3404. Fax: (310) 268-4646.
170
on May 15, 2020 by guest
http://jcm.asm.org/
(ii) Phase 2: equivalence of the SGE and agar dilution methods.Plates were prepared by the participating laboratories as specified in NCCLS publication M11-A2 (6). Either the reference (Wilkins Chalgren medium to which blood was added) or the Wadsworth (brucella base laked blood) agars could be used. Each laboratory used the same lot of medium for the two methods.
Antimicrobial agents and antimicrobial stock preparation. Antimicrobial agents were obtained as powders from their respective manufacturers, as follows: cefoxitin and imipenem, Merck Sharp & Dohme (Rahway, N.J.); metronidazole, Searle Laboratories (Chicago, Ill.); clindamycin, Upjohn (Kalamazoo, Mich.); ampicillin-sulbactam, Pfizer Laboratories (New York, N.Y.); ceftizoxime, Fuji-sawa (Philadelphia, Pa.); and piperacillin and ticarcillin-clavulanic acid, Ameri-can Cyanamid (Pearl River, N.Y.). Powders were divided into aliquots at the Wadsworth Anaerobe Laboratories and were sent to the participating laborato-ries. Identical lots were used by all participating laboratolaborato-ries.
(i) Phase 1.Two different stock concentrations for the same antibiotic-control strain combination were used for the SGE plates to locate the minimum activity concentration (MAC) at radii of approximately 30 and 50 mm. Imipenem, met-ronidazole, and clindamycin were tested. Each laboratory was told the stock concentrations that were necessary and the expected endpoint locations. Each control strain was inoculated into locations 1 through 7 and 9 through 15; these ‘‘paired streaks’’ (1 and 9, 2 and 10, etc.) provided seven pairs of diametrically opposite measurements on each plate. Duplicate plates were made, resulting in 840 determinations from paired streaks (5 laboratories37 radii324 plates [2 control strains32 plates each32 concentrations33 antimicrobial agents]). If single radii, as opposed to paired streaks, were measured, 1,680 measurements were made. Level plates, i.e., those with uniform agar depths, were defined as those plates on which duplicate streaks (on opposite sides of the plate) had endpoint radii within 3 mm of each other.
(ii) Phase 2.Ticarcillin-clavulanate, imipenem, metronidazole, cefoxitin, clin-damycin, ceftizoxime, piperacillin, and ampicillin-sulbactam (2:1) were tested. Separate stock solutions were prepared for the agar dilution and SGE proce-dures. Two SGE plates were required to test the same range of concentrations tested by the agar dilution procedure. The lower-concentration stock solution was made by diluting the higher-concentration stock solution. To minimize errors, dilutions did not exceed 100:1, and the minimum volume transferred was at least 10% of the total pipette volume.
Determination of MICs.The conventional incremental agar dilution technique was performed as described previously (6). The spiral plater (model DU), radial replicator, templates for measurement, and computer software were provided by Spiral Biotech (Bethesda, Md.) and were used according to the manufacturer’s instructions. The plates were incubated in GasPak jars (BBL Microbiology Sys-tems, Cockeysville, Md.) or in anaerobic chambers (Anaerobe Systems or Coy Manufacturing, Ann Arbor, Mich.) for 48 h at 378C. Anaerobic and aerobic antibiotic-free control plates were inoculated at the start and end of the inocu-lation sequence. In phase 2, parallel SGE and standard agar dilution tests were conducted.
Determination of endpoints.The instructions sent to participating laboratories included a copy of the NCCLS criterion for endpoint reading that recommends reading the endpoint at that concentration at which there is a ‘‘marked change’’ in the appearance of growth compared with the growth on the control plate. The marked change might be a change to no growth or lighter growth, a haze, multiple tiny colonies, or one to several normal-size colonies. For certain organ-ism-antimicrobial agent combinations at least, this point is correlated with the viability of the organisms (5, 10).
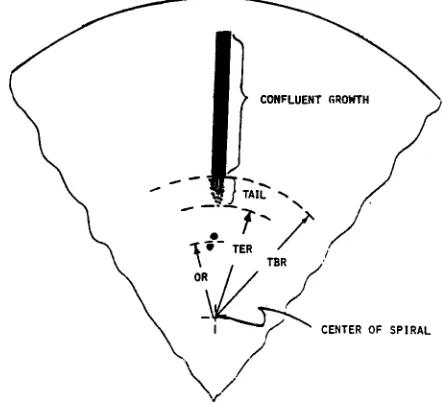
SGEs were measured as the radius from the center of the plate to the endpoint of growth. The radius at which growth ends is termed a ‘‘tail ending radius’’ (Fig. 1). The point at which a heavy, confluent line of growth became much less dense (i.e., a ‘‘marked’’ change from the control growth) was called a ‘‘tail beginning radius’’. The radial measurements were entered into a software program pro-vided by the manufacturer; the program uses the molecular weight and diffusion characteristics of the antimicrobial agent to calculate the corresponding concen-tration. The concentration corresponding to the tail beginning radius is referred to as MAC. The MIC was the next highest twofold dilution greater than or equal to the MAC. If both the tail ending radius and the tail beginning radius were entered into the database, the tail beginning radius was used to calculate the MIC.
RESULTS
Phase 1. (i) Intralaboratory repeatability.The antimicrobial agents were chosen to span the range of molecular weights of most commonly tested agents: metronidazole (molecular weight, 171), imipenem (molecular weight, 317), and clinda-mycin (molecular weight, 461). Intralaboratory repeatability was measured by determining the percentage of MICs equal to the modal MIC (Table 1). We found that two factors could increase the repeatability of the SGE MIC: use of the average of duplicate paired streaks and use of level plates. The pro-portion of MICs equal to the modal MICs ranged from 67 to
82% for single streaks and from 71 to 88% if the average of the paired streaks was measured (which should compensate to some degree for nonlevel plates). Level plates, i.e., those with uniform agar depths, were defined as those plates on which duplicate streaks (on opposite sides of the plate) had endpoint radii within 3 mm of each other. The standard deviations of MICs for the control strain in laboratories B and E (0.36 [58%] and 0.25 [63%] level plates, respectively) were higher than those in laboratory A (0.19, 75% level plates), laboratory C (0.20, 75% level plates), and laboratory D (0.20, 77% level plates). The average standard deviation of MAC was60.26 (of a twofold dilution); the inherent error in the agar dilution technique is61 twofold dilution.
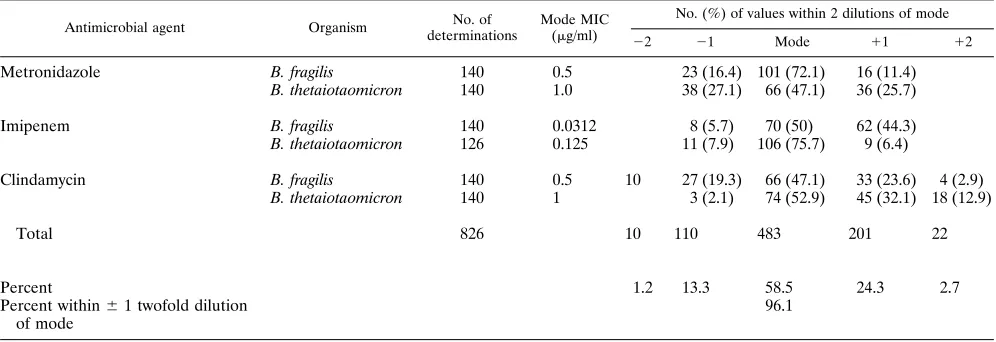
(ii) Interlaboratory reproducibility. For the two control strains, MICs were equal to the modal value for 58% of the values measured, and 96% of the values fell within61 twofold dilution of the mode (Table 2).
Phase 2: equivalence of the SGE and the agar dilution tech-niques.Tables 3 and 4 list the concordance values of the four participating laboratories for each antimicrobial agent. Off-scale data (i.e., when the agar dilution or SGE method yielded MICs outside the range of concentrations tested) were
[image:2.612.321.543.75.277.2]elimi-FIG. 1. Representation of SGE endpoint measurements. TBR, tail beginning radius; TER, tail ending radius; OR, outlier colony radius.
TABLE 1. Intralaboratory repeatability of data for control strains
Laboratory % Level platesa
% MICs equal to modal
MICs % MICs (SD of MACb
) within61 twofold dilution of mode MIC Single
streak
Duplicate streak (avg)c
A 75 79 88 100 (0.19)
B 58 63 65 100 (0.36)
C 75 82 86 100 (0.20)
D 77 68 77 100 (0.20)
E 63 67 71 95 (0.25)
All 69 72 77 99 (0.26)
a
Percentage of plates on which the duplicate streaks had a tail beginning radius difference of,3 mm.
b
Standard deviation of MAC in ln2(twofold dilution) units. c
On the basis of duplicate streak analyses.
on May 15, 2020 by guest
http://jcm.asm.org/
[image:2.612.317.554.579.693.2]nated from the analysis, since a comparison of the two methods was not possible. Data are organized by antimicrobial agent and participating laboratory in Table 3 and by organism group in Table 4. The MICs were within 1 doubling dilution in 93% of the comparisons (n51,074). For laboratory B, concordance values for clindamycin and metronidazole were extremely low; repeat testing of certain strains confirmed that technical errors were the cause (a dilution error in the case of metronidazole and a reading error [referred to below] in the case of clinda-mycin). This laboratory’s data (marked as NI in Table 3) for these two agents was deleted from the analysis since technical errors (i.e., not the method itself) were responsible for the low concordance.
Concordance was poorer than expected for laboratory E (see footnote a of Table 3). Upon review of the data, it became clear that the criteria for reading the SGE and agar dilution plates were not equivalent. Fortunately, the agar dilution data were recorded in a manner that allowed one of us (H.M.W.) to essentially reread the plates by reading the data sheets (with-out any knowledge of the SGE data for those strains) and using the endpoint criterion of ‘‘a marked change from the control growth.’’ The data in Table 3 reflect those for both the original and the reread plates.
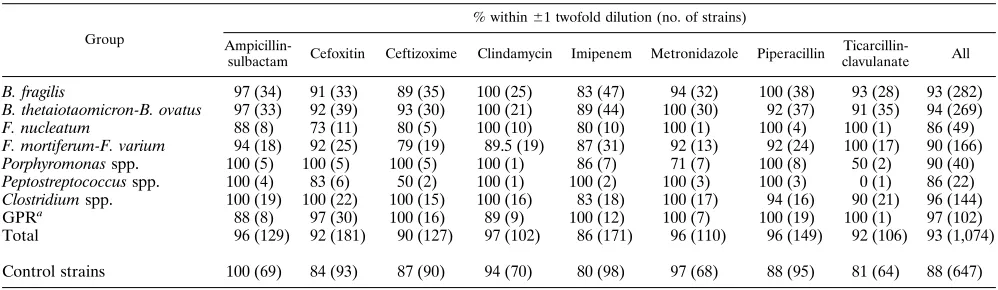
The data in Table 4 support our earlier comments (5, 11, 12) about the difficulty of determining endpoints with certain an-timicrobial agent-organism combinations and the observation that discrepancies generally occurred with those organism-drug combinations that resulted in tailing endpoints
(Fusobac-terium nucleatum, 86% agreement) or in cases of light growth
(Peptostreptococcus spp., 86% agreement). As in earlier stud-ies, the b-lactam agents (particularly ceftizoxime) were the most likely to result in tailing endpoints (12).
DISCUSSION
The approved techniques of NCCLS for susceptibility test-ing of anaerobes include tests by the agar dilution, broth mi-crodilution, and broth macrodilution methods (6). The broth macrodilution method is quite cumbersome and is used infre-quently. While practical, the broth microdilution technique will not support the growth of some fastidious anaerobes. The agar dilution test will support the growth of most clinically relevant anaerobes, but it is labor-intensive and the inherent error of the test results in a high degree of ambiguous results. For many anaerobes, particularly the B. fragilis group, MICs of many
antibiotics cluster near the breakpoint. Thus, the inherent two-fold dilution error may result in the same organism being called variably susceptible or resistant when it is tested on different occasions. This clustering is a characteristic of the organism-drug interaction and is present to some degree in every technique. However, the greater precision of the SGE test in determining MICs (in our study, the standard deviation was 60.26 of a twofold dilution) reduces the percentage of strains within this population.
Recent studies found the overall agreement between the two techniques (within 1 doubling dilution) to be .90% (4, 15), which is also confirmed by the present collaborative study. Data from those earlier studies were used to develop a diffu-sion correction protocol to be used in determining the concen-trations of antimicrobial agents along the gradient. In the present study, we confirmed the validity of this correction by testing two different stock concentrations of the antimicrobial agents used in phase 1 (which span the range of molecular weights of most antimicrobial agents) intended to result in radii of 30 and 50 mm, respectively. The two concentrations gave equivalent results, confirming the validity of the correc-tion in the SGE analysis (unpublished data).
Some sources of error that occur in traditional susceptibility testing were highlighted by the present study. In phase 1, the MICs for control strains tended to be on the low end of the approved quality control range and, in one case, were below the acceptable range. The inoculum for phase 1 was prepared from an overnight broth culture; the culture was at an earlier stage of growth than the inoculum normally used in agar dilu-tion testing. These same strains were well within the NCCLS quality control range during phase 2 (which used the normal inoculum). We confirmed that MICs for log-phase inocula were typically lower (unpublished data).
Other errors included a 10-fold dilution error, ‘‘skipped’’ inoculum spots on the agar dilution plates (i.e., growth at 0.25 mg/ml, no growth from 0.5 to 4mg/ml, growth at 8mg/ml, and the MIC was recorded as 0.5mg/ml), and inconsistent appli-cation of the criterion for reading endpoints. As mentioned above, when the reread plates from laboratory E were com-pared with the SGE MICs, the concordance improved dramat-ically (from 73.8 to 92.9%), giving credence to the general sense among many microbiologists that interpretative criteria are highly subjective.
[image:3.612.58.556.84.255.2]Laboratory D had the highest level of concordance between the two methods. All plates in laboratory D were read against
TABLE 2. Interlaboratory reproducibility of MICs for control strains
Antimicrobial agent Organism No. of determinations
Mode MIC (mg/ml)
No. (%) of values within 2 dilutions of mode
22 21 Mode 11 12
Metronidazole B. fragilis 140 0.5 23 (16.4) 101 (72.1) 16 (11.4)
B. thetaiotaomicron 140 1.0 38 (27.1) 66 (47.1) 36 (25.7)
Imipenem B. fragilis 140 0.0312 8 (5.7) 70 (50) 62 (44.3)
B. thetaiotaomicron 126 0.125 11 (7.9) 106 (75.7) 9 (6.4)
Clindamycin B. fragilis 140 0.5 10 27 (19.3) 66 (47.1) 33 (23.6) 4 (2.9)
B. thetaiotaomicron 140 1 3 (2.1) 74 (52.9) 45 (32.1) 18 (12.9)
Total 826 10 110 483 201 22
Percent 1.2 13.3 58.5 24.3 2.7
Percent within61 twofold dilution of mode
96.1
on May 15, 2020 by guest
http://jcm.asm.org/
a dark background, which minimizes the appearance of tailing, and few tail entries were recorded in the data set. Concordance levels were high even for the difficult organisms (e.g., 95% for
Fusobacterium mortiferum-Fusobacterium varium versus 79, 80,
and 91% for the other laboratories). Partly on the basis of these results, the NCCLS protocol now recommends that agar dilution plates be read against a dark background (6).
The problems that occurred with the SGE method included a mechanical error (the stylus on the SGE plater in one labo-ratory was bent and deposited the antimicrobial solution in an off-center spiral; this will be avoided with the newer model of the plater). Our data also underscored the importance of using level plates for the SGE method. In other words, it is important that the agar depth be even throughout the plate (agar depth is one of the variables entered into the SGE software and is used to calculate the concentration at any point in the gradi-ent). For the present study, level plates were defined as those in which the duplicate streaks (at opposite ends of the plate) have a tail beginning radius difference of,3 mm. In an un-published study from the Wadsworth Anaerobe Laboratories, the MICs of five antimicrobial agents were obtained by the SGE method for the NCCLS controls strains by using (i) plates poured in the laboratory (97% level) and (ii) commercially available plates (45% level). The percentage of MICs equal to the modal MIC (a measure of repeatability) was significantly greater (85%) for the laboratory-poured plates than for the commercially obtained plates (59%).
New methods are generally evaluated in terms of error rates
[image:4.612.60.558.84.210.2]vis-a`-vis the standard method. This may be inappropriate in the case of the reference agar dilution method for anaerobes, which is not sufficiently accurate or reproducible to be used in such comparisons. We have written extensively about the prob-lems involved in interpreting the results obtained by the stan-dard method (11, 12). A significant percentage of strain-anti-microbial agent combinations yield endpoints which are difficult to pinpoint. Most troubling is that the inherent error in the reference method (61 twofold dilution [14]) combined with the clustering of many MICs about the breakpoint results in a very significant percentage of isolates whose categorical placement (i.e., susceptible or resistant) is subject to day-to-day variability. The lower inherent error in the SGE method (60.26 of a twofold dilution) necessarily means that the per-centage of isolates with questionable categorical placements is reduced. It would be ideal if the MICs obtained by all methods could be compared with an MIC defined only by the organism-antimicrobial agent interaction (i.e., not method dependent). If an absolute MIC standard could be described (perhaps by using kill curves [8] with a low initial inoculum concentration to obtain a more homogeneous cell population), the MICs ob-tained by all other methods could then be evaluated relative to this MIC standard. Such a comparison would be markedly superior to one based on a standard (i.e., the agar dilution reference method) which has such a high degree of inherent error. In any case, the MICs obtained by the SGE and agar dilution methods were within 1 doubling dilution (i.e., essential agreement) in 93% of comparisons (the U.S. Food and Drug
TABLE 3. Gradient to incremental (agar dilution) MIC comparison
Antimicrobial agent Percent within61 twofold dilution (no. of strains tested)
Laboratory A Laboratory B Laboratory D Laboratory E Laboratory Ea All laboratories
Ampicillin-sulbactam 97.6 (41) 91.3 (23) 95.0 (40) 100 (23) 100 (25) 96 (124/129)
Cefoxitin 95.5 (66) 80.0 (40) 97.6 (42) 57.9 (38) 94.0 (33) 92 (167/181)
Ceftizoxime 91.2 (34) 85.2 (27) 97.3 (37) 75.8 (29) 89.3 (28) 91 (115/126)
Clindamycin 97.2 (36) NIb 100 (38) 59.4 (32) 92.9 (28) 97 (99/102)
Imipenem 87.0 (46) 80.8 (52) 90.0 (40) 78.4 (37) 91.0 (33) 87 (148/171)
Metronidazole 100 (52) NI 100.0 (30) 74.1 (31) 82.1 (28) 96 (105/110)
Piperacillin 92.5 (53) 96.8 (31) 97.0 (33) 80.7 (31) 100 (32) 96 (143/149)
Ticarcillin-clavulanic acid 87.9 (33) 89.5 (19) 94.4 (36) 72.2 (18) 94.4 (18) 91.5 (97/106)
Percent within 1 twofold dilution 93.9 (339/361) 85.9 (165/192) 96.3 (285/296) 73.8 (177/239) 92.9 (209/225) 93 (998/1074)
aValues are the ‘‘corrected’’ values when the plates were reevaluated by rereading the actual agar dilution data sheets (without any knowledge of the SGE data for
those strains) by using the current NCCLS endpoint criterion (see Discussion). Totals are calculated by using the corrected values.
bNI, not included in the data analysis because of technical errors in the laboratory.
TABLE 4. Comparison of gradient with incremental agar dilution MICs for different groups of anaerobic organisms
Group
% within61 twofold dilution (no. of strains)
Ampicillin-sulbactam Cefoxitin Ceftizoxime Clindamycin Imipenem Metronidazole Piperacillin
Ticarcillin-clavulanate All
B. fragilis 97 (34) 91 (33) 89 (35) 100 (25) 83 (47) 94 (32) 100 (38) 93 (28) 93 (282)
B. thetaiotaomicron-B. ovatus 97 (33) 92 (39) 93 (30) 100 (21) 89 (44) 100 (30) 92 (37) 91 (35) 94 (269)
F. nucleatum 88 (8) 73 (11) 80 (5) 100 (10) 80 (10) 100 (1) 100 (4) 100 (1) 86 (49)
F. mortiferum-F. varium 94 (18) 92 (25) 79 (19) 89.5 (19) 87 (31) 92 (13) 92 (24) 100 (17) 90 (166)
Porphyromonas spp. 100 (5) 100 (5) 100 (5) 100 (1) 86 (7) 71 (7) 100 (8) 50 (2) 90 (40)
Peptostreptococcus spp. 100 (4) 83 (6) 50 (2) 100 (1) 100 (2) 100 (3) 100 (3) 0 (1) 86 (22)
Clostridium spp. 100 (19) 100 (22) 100 (15) 100 (16) 83 (18) 100 (17) 94 (16) 90 (21) 96 (144)
GPRa 88 (8) 97 (30) 100 (16) 89 (9) 100 (12) 100 (7) 100 (19) 100 (1) 97 (102)
Total 96 (129) 92 (181) 90 (127) 97 (102) 86 (171) 96 (110) 96 (149) 92 (106) 93 (1,074)
Control strains 100 (69) 84 (93) 87 (90) 94 (70) 80 (98) 97 (68) 88 (95) 81 (64) 88 (647)
a
GPR, gram-positive rods; includes Propionibacterium, Eubacterium, and Actinomyces species.
on May 15, 2020 by guest
http://jcm.asm.org/
[image:4.612.57.556.573.718.2]Administration generally requires.90% essential agreement with a standard method).
The initial expense for the equipment needed for the SGE method is high, but this method is not designed for testing small numbers of isolates in a clinical laboratory. The Etest, another gradient method, also has the advantage of using agar and would be a more appropriate alternative in this setting (1). The SGE method is a more economical and more precise alternative (in terms of reduced inherent error) to the refer-ence agar dilution technique for both research purposes and batch testing (in a reference laboratory). Also, more informa-tion may be gained about the transiinforma-tion from growth to no growth. Another setting in which the SGE method may prove to be quite useful is in calibrating disk diffusion measurements since both techniques are based on continuous diffusion (8).
ACKNOWLEDGMENTS
The technical assistance of Martha A. C. Edelstein, Mei Yu, Cindy Knapp, Ann Niles, and Lourdes Bayola-Mueller is gratefully acknowl-edged.
This work was supported in part by Veterans Affairs Medical Re-search Funds and in part by Pfizer Pharmaceuticals (New York, N.Y.), Spiral Biotech (Bethesda, Md.), and SmithKline Beecham (Philadel-phia, Pa.).
REFERENCES
1. Citron, D. M., M. I. Ostavari, A. Karlsson, and E. J. C. Goldstein. 1991. Evaluation of the epsilometer (E-test) for susceptibility testing of anaerobic bacteria. J. Clin. Microbiol. 29:2197–2203.
2. Donnelly, C. B., J. E. Gilchrist, J. T. Peeler, and J. E. Campbell. 1976. Spiral plate count method for the examination of raw and pasteurized milk. Appl. Environ. Microbiol. 32:21–27.
3. Finegold, S. M. 1988. Susceptibility testing of anaerobic bacteria. J. Clin. Microbiol. 26:1253–1256.
4. Hill, G. B., and S. Schalkowsky. 1990. Development and evaluation of the spiral gradient endpoint method for susceptibility testing of anaerobic gram-negative bacilli. Rev. Infect. Dis. 12(Suppl. 2):S200–S209.
5. Johnson, C. C., H. M. Wexler, S. Becker, M. Garcia, and S. M. Finegold. 1989. Cell-wall-defective variants of Fusobacterium. Antimicrob. Agents Chemother. 33:369–372.
6. National Committee for Clinical Laboratory Standards. 1993. Methods for antimicrobial susceptibility testing of anaerobic bacteria, 3rd ed. Approved standard M11-A2. National Committee for Clinical Laboratory Standards, Villanova, Pa.
7. Paton, J. H., H. A. Holt, and M. J. Bywater. 1990. Measurement of MICs of antibacterial agents by spiral gradient endpoint compared with conventional dilution method. Int. J. Exp. Clin. Chemother. 3:31–38.
8. Schalkowsky, S. 1994. Measures of susceptibility from a spiral gradient of drug concentrations, p. 107–120. In J. A. Poupard et al. (ed.), Antimicrobial susceptibility testing. Plenum Press, New York.
9. Summanen, P., E. J. Baron, D. Citron, C. Strong, H. M. Wexler, and S. M. Finegold.1993. Wadsworth anaerobic bacteriology manual, 5th ed. Star Publishing Company, Belmont, Calif.
10. Summanen, P., H. M. Wexler, and S. M. Finegold. 1992. Antimicrobial susceptibility testing of Bilophila wadsworthia by using triphenyltetrazolium chloride to facilitate endpoint determination. Antimicrob. Agents Che-mother. 36:1658–1664.
11. Wexler, H. M. 1991. Susceptibility testing of anaerobic bacteria: myth, magic, or method? Clin. Microbiol. Rev. 4:470–484.
12. Wexler, H. M. 1993. Susceptibility testing of anaerobic bacteria: the state of the art. Clin. Infect. Dis. 16(Suppl. 4):S328–S333.
13. Wexler, H. M., and S. M. Finegold. 1987. Antimicrobial resistance in Bac-teroides. J. Antimicrob. Chemother. 19:143–146.
14. Wexler, H. M., P. T. Lavin, E. Molitoris, and S. M. Finegold. 1990. Statistical analysis of the effects of trial, reader, and replicates on MIC determination for cefoxitin. Antimicrob. Agents Chemother. 34:2246–2249.
15. Wexler, H. M., E. Molitoris, F. Jashnian, and S. M. Finegold. 1991. Com-parison of spiral gradient with conventional agar dilution for susceptibility testing of anaerobic bacteria. Antimicrob. Agents Chemother. 35:1196–1202.