© 2016, IRJET | Impact Factor value: 4.45 | ISO 9001:2008 Certified Journal
| Page 1468
Optimization of Process Parameters of Global Sequence Alignment
Based Dynamic Program - an Approach to Enhance the Sensitivity
of Alignment
Dr.D.Chandrakala
1, Dr.T.Sathish Kumar
2, S.Preethi
3, D.Sowmya
41
Professor, Computer Science, Kumaraguru College of technology, Coimbatore, India
2
Assistant Professor III, Biotechnology, Kumaraguru College of technology, Coimbatore, India
3
Student, Computer Science, Kumaraguru College of technology, Coimbatore, India
4
Student, Computer Science, Kumaraguru College of technology, Coimbatore, India
---***---Abstract - Protein / peptide and polynucleotide sequence
alignment is widely used in the area of Bioinformatics for the analysis of identity and similarity. Any sequence of Deoxyribonucleic acid (DNA) / Ribonucleic acid (RNA) and protein can be aligned by using different algorithms, but the sensitivity and specificity of the alignment, computational time, cost, configuration of the hardware etc., play a pivotal role. This paper optimizes Needleman algorithm which is based on dynamic programming for the enhancement of the sensitivity of the alignment. Dynamic programming is a method for solving complex problems by breaking them down into simpler sub problems. This idea is very insightful for solving bioinformatics problems. Aligning distantly related protein sequences is a long-standing problem in bioinformatics and a key for successful protein structure prediction. Currently in few tools that adopt the dot matrix and dynamic program algorithm allow the users for random selection of the substitution matrix that provides an approximate sensitivity of an alignment, and moreover, there is no tool that displays both the sequence alignment and its related graphical output. So, in the proposed study, various match and gap penalty values were investigated for finding the optimal condition that may reveal the better sensitivity of the alignment. Moreover, the results were coupled with the graphical display that reveals the percent identity or similarity or dissimilarity of an alignment.
Key Words: Bio-informatics, Dynamic Programming, Sensitivity, Similarity.
1.Introduction
In bioinformatics, a sequence alignment is a way of arranging the sequences of DNA, RNA, or protein to identify regions of similarity that may be a consequence of functional,
structural, or evolutionary relationships between the sequences. Sequence Comparison is to find the common pattern present in both sequences and to assess whether it is likely that two sequences evolved from the same sequence. Here the task is to align the sequences to get maximum similarity percentage.
There are two ways for sequence comparison:
dotplot -visual, qualitative
sequence alignment- exact and quantitative which involves the following,
Construction of the best alignment between the sequences.
Assessment of the similarity from the alignment.
Themutation is defined as a protein or a nucleotide at a certain location is replaced by another protein (e.g.: ATA → AGA). At a certain location one new protein is inserted in between two existing proteins (e.g.: A_A → AGA) and at a certain location one existing protein is deleted (e.g.: ACTG → AC_G). Combination of these two is called as indel. Acceptable mismatches are the mismatched characters between two sequences which can be added to the identity which will give the similarity. There are two types of alignment,
(i)Local Alignment
The two input user sequences A and B are aligned in such a way that searching for a local substring match in a large sequences.
© 2016, IRJET | Impact Factor value: 4.45 | ISO 9001:2008 Certified Journal
| Page 1469
(ii)Global AlignmentThe two input user sequences A and B are aligned in such a way that searching for end to end string match between the sequences.
Eg: A: ACTGCTA B: AC___CTA
The resulting alignment yields an edit transcript of mismatches and indels, i.e., insertions and deletions, where mismatches can be interpreted as point mutations and gaps as indels. Needleman algorithm concentrates on global alignment whereas Smith-Waterman algorithm concentrates on local alignment. This paper concentrates on global alignment by taking Needleman's algorithm and optimizing it.
2. Literature Review
As the sizes of biological sequence databases grow exponentially, the need for fast and efficient sequence alignment algorithms is ever-increasing. Most of the research work has been intended on primarily providing new algorithms with the main requisite of the meeting the demands of efficient sequence alignment. Researchers have used all the latest techniques with the aim of providing fast and efficient alignment algorithms. Needleman and Wunsch proposed a dynamic programming algorithm for performing a global alignment of two sequences[1]. Smith and Waterman proposed an algorithm to find a pair of segments one from each of two long sequences such that there is no other pair of segments with greater similarity (homology)[2].Zhi-min Zhou and Zhong-wen Chenintroduce algorithms that given a certain evaluation function, will calculate the optimal alignment by dynamic programming for local, global and Progressive alignment in "Dynamic Programming for Protein Sequence Alignment"[3]. Shivani Sharma and mardeep singh uses Smith Waterman for local alignment and Needleman Wunsch for global alignment have been used in the paper "DNA Sequence Alignment Based on Bio-informatics"[4].
In all this work, the main objective of the researchers had been to apply different techniques in order to provide efficient alignment algorithms.
3. Existing System
Sequence Alignment will find the similarity between two biological sequences (both protein and nucleotide) i.e. way of arranging the DNA, RNA and Protein to find the region of similarity. Random selection of the substitution matrix is done by the system. For the given input sequences, sequence alignment along with identity and similarity
percentage will be produced. Similarity is calculated using identity and blosum62 matrix for proteins whereas PAM matrix for nucleotide. Finally a single alignment will be produced for the pair of input sequences and moreover, there is no existing tool that displays both the sequence alignment and the related graphical output.
4. Problem Definition
Currently in few existing tools that adopt the dot matrix and dynamic program algorithm allow the users for random selection of the substitution matrix that provides an approximate sensitivity of an alignment.Existing system will use some default value and does not allow the user to choose the Match, Mismatch and Indel Values so that user cannot be able to compare their manual results with the outputs. It helps to analyse how the protein or nucleotide sequence alignment varies for each input match, mismatch and indel values. Systematic analysis of that match, mismatch and indel values with output sequence alignment helps to gain better knowledge.
Those tools provide one sequence as output, so that may or may not be the best sequence. Visual representation along with sequences for global alignment is not present. There is no dynamic tool for the global alignment.
5. Proposed System
In order to overcome the above problems the new system has been designed. This system produces three possible best sequences (3 sequences) along with the best one for the two given input sequences. This tool provides Visual Representation (Graph) for the requested sequence alignment and allows the user to select the Match, Mismatch and Indel (Insertion, Deletion) values which helps the user to have a clear idea about their results. Also in the proposed study, various match and gap penalty values were investigated for finding the optimal condition that may reveal the better sensitivity of the alignment. Moreover, the results were coupled with the graphical display that reveals the percent identity or similarity or dissimilarity of an alignment. This proposed tool implements dynamic algorithm and improves the similarity scores compared to the existing system. Results will be saved in a file for future reference.
6. Needleman-Wunsch algorithm
© 2016, IRJET | Impact Factor value: 4.45 | ISO 9001:2008 Certified Journal
| Page 1470
Backtrack from bottom right corner to generate the outputsequence, based on insertion, deletion and match occurs.
Needleman - Wunsch Algorithm for i=0 to length(A)
F(i,0) d*i for j=0 to length(B) F(j,0) d*j for i=1 to length(A) for j=1 to length(B) {
Match F(i-1, j-1) + S(Ai , Bj) Delete F(i-1, j) + d
Insert F(i, j-1) + d
F(i, j) Max(Match, Insert, Delete) }
7. Implementation
The proposed system is implemented in java using swings, awt and graphics package. Choose either protein or nucleotide as in Fig 7.1
Fig7.1 Choose protein or nucleotide
7.1 Reading Inputs
Read two input sequences from the user either choosing a file or entering characters. The system will validate and filter the inputs.
Input Format:
There are two input sequences read from the user, these can either in FASTA format or contain only alphabets.
The inputs are either protein or nucleotide sequences.
Special characters are not accepted as valid input.
Match, Mismatch, Insertion and Deletion values The match, mismatch, insertion and deletion values are read from the user. These values have huge impact in matrix cell calculation. Each cell on the matrix depends on these 4
values. The values with higher value will take a place in the corresponding matrix cell.
These inputs are the numbers read from the user.
It is provided in dropdown box in which the user has to select.
Refer Fig 7.2 where Sequence 1 is AATGC and Sequence 2 is AGGC and match, mismatch, insertion and deletion values are selected.
Fig 7.2 Entering protein or nucleotide sequences as input
7.2 Finding of Match/Mismatch/
Insertion/Deletion values
Each cell of the matrix depends on the calculation of the following three values.
Insertion
It is calculated by the sum of immediate left cell and user input insertion value.
Deletion
It is calculated by the sum of immediate top cell and user input deletion value.
Match/Mismatch
If the characters are equal in the corresponding row and column, then the value is calculated by the sum of immediate diagonal cell and the user input match value.
If the characters are not equal in the corresponding row and column, then the value is calculated by the sum of immediate diagonal cell and the user input mismatch value.
7.3 Matrix Generation
© 2016, IRJET | Impact Factor value: 4.45 | ISO 9001:2008 Certified Journal
| Page 1471
(Insertion or deletion) values which is the greatest of allvalues. The size of the matrix depends on the two input sequences. There are two phases in matrix generation,
Initialization of matrix.
Induction or filling of matrix.
Initialization of matrix
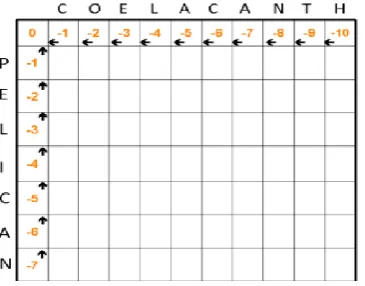
[image:4.595.308.518.218.376.2]The matrix should be initialized according to the two input sequences to start the process. First cell of the matrix is initialized to 0 as in figure 7.3. Then the consecutive cells are decremented by 1 towards right andalso towards bottom. So the modulus of the top right cell number will be the length of the firstsequence and the modulus of the lower left cell number will be the length of the second sequence. Hence from the figure 7.3, the size of the matrix is (Length of the first sequence + 1) x (Length of the second sequence + 1). The additional 1 is for the initialization row and column.
Fig 7.3 Initialization of matrix
Induction or Filling of matrix
Filling of the matrix is an important computational part in the sequence generation. From the initialized first row and first column of the matrix, the filling starts from top left empty cell of the matrix. From the match/ mismatch, insertion and deletion values, the maximum of the above three values are inserted in the each cell of the matrix as -1 in figure 7.4.
Fig 7.4 Induction or Filling of matrix
7.4 Sequence Generation
Generate the sequence by tracing from the bottom right corner of the matrix. Trace until, to reach a position of (0, 0). For insertion move one cell left. For deletion move one cell up.For match/mismatch move diagonally one cell. Fig 7.5 provides the
[image:4.595.40.223.313.456.2]aligned sequences for the pair of sequences along with similarity scores incorporating substitution matrices.
Fig 7.5 Global alignment for the pair of sequences
7.5 Calculation of Identity and Similarity Scores
Identity and Similarity scores are used to calculate the identity and similarity percentage. It is important to identify the similarity between two protein or nucleotide sequences.
Identity is calculated based on number of identical bases or amino acids matched between two sequences. If the two sequences contain the same characters then the identity score will be incremented by one.
Identity Percentage = Total Identity Score
Length of the output sequence
Similarity is calculated based on identity and acceptable mismatches. Similarity score will be incremented by one if the two sequences contains same characters and also if the characters are acceptable mismatches.
Similarity Percentage = Total Similarity Score
Length of the output sequence
[image:4.595.43.231.596.758.2]© 2016, IRJET | Impact Factor value: 4.45 | ISO 9001:2008 Certified Journal
| Page 1472
values helps to improve the sensitivity of the amino acidsand help to attain the maximum similarity scores.
Acceptable Mismatch Matrix for Proteins and Nucleotides
Protein
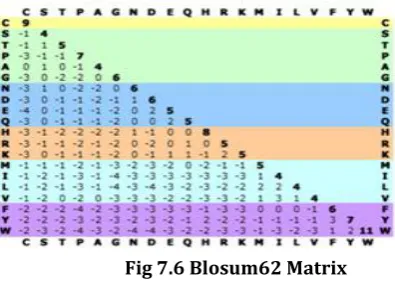
[image:5.595.306.542.65.230.2]Fig 7.6 provides the matrix values which are used to calculate the similarity scores for the aligned protein sequences. This matrix helps to improve the sensitivity of the amino acids and to attain the maximum similarity scores in the aligned sequences.
Fig 7.6 Blosum62 Matrix
Nucleotide
Fig 7.7 provides the matrix values which are used to calculate the similarity scores for the nucleotide sequences and helps to improve the sensitivity of the amino acids in the aligned sequences.
[image:5.595.43.241.240.383.2]
Fig 7.7 PAM Matrix
7.6 Generating Graph
Fig 7.8 provides the Graphical representation for the pair of sequences .Generate the graph for the sequence with maximum similarity values. It is a graph against the two input sequences. This graph helps to understand the sequence alignment better.
Fig 7.8 Dot-plot graph for the Global Sequence Alignment
The above procedure is followed for both protein and nucleotide sequence alignment.
8. Performance Analysis
TABLE-1 : Comparison of Identity and Similarity Scores of existing and the proposed tool
Interpretation
The proposed tool is approximately 3.36% times better in terms of similarity scores as in TABLE-1. The importance of the sequence alignment in bio-informatics is to align the sequences in such a way to attain maximum similarity and
Sequence 1 Sequence 2
Identity Score Similarity Score
Existing Tool
in(%)
Proposed Tool
in(%)
Existing Tool
in(%)
Proposed Tool
in(%)
Cat Dog 84.5 84.8 88.2 91.1
Cat Elephant 42.7 42.7 43.6 44.5
Dog Elephant 43.6 43.6 44.5 45.4
Dog Horse 64.5 64.5 65.5 69.1
Homosepian s
Elephant 44.5 44.5 45.5 46.4
Homosepian s
Dog 88.2 88.2 89.1 94.5
Homosepian s
[image:5.595.311.566.425.658.2] [image:5.595.53.200.479.569.2]© 2016, IRJET | Impact Factor value: 4.45 | ISO 9001:2008 Certified Journal
| Page 1473
it has been done in the proposed system with dynamicprogramming.
9. Conclusion
The main objective of Sequence Alignment is to align the sequences in such a way to attain maximum similarity score .The Proposed System has attained better similarity when compared to the existing one. Additionally, in the proposed system multiple results (maximum of 3) with the graph for the requested alignment is produced which is not in the existing one. Choosing of Match, Mismatch, Insertion and Deletion values by the user makes the tool more dynamical. Also in the proposed study, various match and gap penalty values were investigated for finding the optimal condition that may reveal the better sensitivity of the alignment. Moreover, the results were coupled with the graphical display that reveals the percent identity or similarity or dissimilarity of an alignment.
References
[1] Shivani Sharma, Amardeep singh "DNA Sequence Alignment based on
Bioinformatics",IJCSET |July 2012| Vol 2, Issue 7, 1305-1309.
[2] Parshant Manohar and Shailendra Singh "Protein Sequence Alignment: A Review",
World Applied Programming, Vol (2), No (3), March 2012. 141-145ISSN: 2222-2510
©2011 WAP journal.
[3] Zhi-min Zhou and Zhong-wen Chen
"Dynamic Programming for Protein Sequence Alignment", International Journal of Bio- Science and Bio-Technology Vol. 5, No. 2, April, 2013.