Farnesoid X receptor is essential for normal
glucose homeostasis
Ke Ma, … , Lawrence Chan, David D. Moore
J Clin Invest. 2006;
116(4)
:1102-1109.
https://doi.org/10.1172/JCI25604
.
The bile acid receptor farnesoid X receptor (FXR; NR1H4) is a central regulator of bile acid
and lipid metabolism. We show here that FXR plays a key regulatory role in glucose
homeostasis. FXR-null mice developed severe fatty liver and elevated circulating FFAs,
which was associated with elevated serum glucose and impaired glucose and insulin
tolerance. Their insulin resistance was confirmed by the hyperinsulinemic euglycemic
clamp, which showed attenuated inhibition of hepatic glucose production by insulin and
reduced peripheral glucose disposal. In FXR
–/–skeletal muscle and liver, multiple steps in
the insulin signaling pathway were markedly blunted. In skeletal muscle, which does not
express FXR, triglyceride and FFA levels were increased, and we propose that their
inhibitory effects account for insulin resistance in that tissue. In contrast to the results in
FXR
–/–mice, bile acid activation of FXR in WT mice repressed expression of
gluconeogenic genes and decreased serum glucose. The absence of this repression in
both FXR
–/–and small heterodimer partner–null (SHP
–/–) mice demonstrated that the
previously described FXR-SHP nuclear receptor cascade also targets glucose metabolism.
Taken together, our results identify a link between lipid and glucose metabolism mediated
by the FXR-SHP cascade.
Research Article
Endocrinology
Find the latest version:
Farnesoid X receptor is essential
for normal glucose homeostasis
Ke Ma,1 Pradip K. Saha,2 Lawrence Chan,2 and David D. Moore1
1Department of Molecular and Cellular Biology and 2Section of Endocrinology and Metabolism,
Departments of Molecular and Cellular Biology and Medicine, Baylor College of Medicine, Houston, Texas, USA.
The bile acid receptor farnesoid X receptor (FXR; NR1H4) is a central regulator of bile acid and lipid
metabo-lism. We show here that FXR plays a key regulatory role in glucose homeostasis. FXR-null mice developed severe
fatty liver and elevated circulating FFAs, which was associated with elevated serum glucose and impaired glucose
and insulin tolerance. Their insulin resistance was confirmed by the hyperinsulinemic euglycemic clamp, which
showed attenuated inhibition of hepatic glucose production by insulin and reduced peripheral glucose disposal.
In
FXR
–/–skeletal muscle and liver, multiple steps in the insulin signaling pathway were markedly blunted. In
skeletal muscle, which does not express FXR, triglyceride and FFA levels were increased, and we propose that
their inhibitory effects account for insulin resistance in that tissue. In contrast to the results in
FXR
–/–mice, bile
acid activation of FXR in WT mice repressed expression of gluconeogenic genes and decreased serum glucose.
The absence of this repression in both
FXR
–/–and small heterodimer partner–null (
SHP
–/–) mice demonstrated
that the previously described FXR-SHP nuclear receptor cascade also targets glucose metabolism. Taken
togeth-er, our results identify a link between lipid and glucose metabolism mediated by the FXR-SHP cascade.
Introduction
The farnesoid X receptor (FXR; NR1H4) is a member of the nuclear receptor superfamily that is primarily expressed in liver, kidney, and intestine. It forms a heterodimer with retinoid X receptor and binds inverted repeats of 2 AGGTCA half sites separated by 1 nucleotide, insulin receptor 1 (IR-1), to regulate target gene transcription. Bile acids are its endogenous ligands (1–3), and FXR plays an essential role in the feedback regulation of bile acid biosynthesis through
repression of the key enzyme cholesterol-7α hydroxylase (CYP7A1)
(4). FXR activation induces expression of the orphan nuclear receptor small heterodimer partner (SHP; NR0B2), which inhibits CYP7A1 gene expression by blocking the activity of another orphan receptor, the liver receptor homolog (LRH-1; NR5A2). Studies
with SHP–/– mice confirmed the importance of this nuclear
recep-tor pathway for negative regulation of bile acid synthesis and also revealed SHP-independent pathways (5–7).
FXR also plays an important role in lipoprotein metabolism. This was suggested by the identification of genes encoding phos-pholipid transfer protein (8), apoC-II, apoC-III, and apoA-I (9, 10) as FXR targets and confirmed by the demonstration of altered
lipid metabolism in FXR–/– mice, which exhibit elevated plasma
cholesterol and triglyceride levels and excessive accumulation of fat in the liver (11, 12). Fatty liver disease, or hepatic steatosis, is one of the most common liver diseases in humans (13) and is asso-ciated with defects in insulin action that are independent of overall body weight. Thus, type 2 diabetes patients with fatty liver are sub-stantially more insulin resistant and have higher levels of plasma FFAs than those without it (14). However, the precise mechanisms linking fatty liver to diabetes are poorly understood.
Recent reports (15–19) have suggested potential involvement of FXR in glucose homeostasis. Several studies (15, 17, 18) indicate that bile acids alter expression of genes involved in gluconeogen-esis, including phosphoenoylpyruvate kinase (PEPCK), glucose-6-phosphatase (G-6-Pase), and fructose-1,6-biglucose-6-phosphatase, although the mechanisms that mediate these responses remain unclear.
To explore the role of FXR in glucose homeostasis, we compared
glucose metabolism in WT and FXR–/– mice. FXR–/– mice showed
impaired glucose tolerance, decreased insulin sensitivity, and sig-nificantly blunted insulin responsiveness in both skeletal muscle and liver. On the other hand, activation of FXR by dietary cholic acid (CA) suppressed expression of multiple genes involved in glu-coneogenesis and lowered glucose level. Both of these responses were lost in FXR–/– and SHP–/– mice. These results reveal that FXR
is required for the maintenance of normal glucose metabolism and provide a specific molecular link between fatty liver and insulin
resistance. FXR–/– mice provide what we believe to be a unique
ani-mal model for the role of fatty liver in the metabolic syndrome.
Results
Abnormal glucose metabolism in FXR–/– mice. Mice deficient in FXR
dis-play elevated plasma cholesterol and triglyceride levels due to the loss of FXR regulation of hepatic bile acid and lipid metabolism (12). In accord with previous results, we observed increased plasma
cholesterol and triglyceride levels in FXR–/– mice (Figure 1, A and
B). The FXR–/– mice also exhibited increased hepatic triglyceride
accumulation (Figure 1D) accompanied by marked induction of several genes involved in lipogenesis, such as SREBP-1c, stearoyl-CoA desmutase, and fatty acid synthase (Figure 1E). In addition, the level of circulating FFAs was approximately 2-fold higher in the
FXR–/– mice (Figure 1C). These elevated FFA levels were comparable
to those of WT mice fed a high-fat diet for 3 months and were not further increased by feeding the FXR–/– mice a high-fat diet.
Due to the well-established role of high FFA levels in the patho-genesis of insulin resistance, we investigated glucose
homeosta-sis in the FXR–/– mice. The serum glucose levels of random-fed
Nonstandard abbreviations used: CA, cholic acid; CYP7A1, cholesterol-7α hydroxy-lase; FXR, farnesoid X receptor; G-6-Pase, glucose-6-phosphatase; GTT, glucose toler-ance test; IR, insulin receptor; IRS, insulin receptor substrate; ITT, insulin tolertoler-ance test; L-FABP, liver type FFA–binding protein; PEPCK, phosphoenoylpyruvate kinase; PGC-1α, PPARg coactivator-1α; SHP, small heterodimer partner.
Conflict of interest: The authors have declared that no conflict of interest exists.
research article
The Journal of Clinical Investigation http://www.jci.org Volume 116 Number 4 April 2006 1103
FXR–/– mice were approximately 30% higher than those of the WT
mice, whereas fasting glucose levels showed an age-dependent increase, with significantly higher levels in 12-week-old mice (Figure 1F). In the glucose tolerance test (GTT), glucose levels
were elevated at all time points after loading in the FXR–/– mice,
reaching almost twice the WT levels at 2 hours (Figure 2A). The
failure of the FXR–/– glucose levels to return to baseline suggests
markedly impaired peripheral glucose uptake. Insulin levels dur-ing the GTT also deviated from the normal response in WT mice.
The insulin response to glucose in FXR–/– mice was diminished,
with levels persistently elevated at 2 hours when those of the WT had returned to baseline (Figure 2B). The insulin tolerance test
(ITT) confirmed the impaired insulin sensitivity in FXR–/– mice
(Figure 2C). Fifteen minutes after i.p. insulin challenge, WT
glu-cose levels dropped to about 50% of baseline, while the FXR–/–
lev-els decreased by only 23%. The FXR–/– mice also showed faster
recovery to about 55% of baseline at 90 minutes, compared with 33% in the WT mice.
To examine the possible contribution of nonhepatic insulin sensitizing factors to the dysregulation of glucose metabolism
in the FXR–/– mice, serum leptin and adiponectin were measured.
The levels of these 2 major adipokines were comparable between
FXR–/– and WT mice (data not shown).
The hyperinsulinemic euglycemic clamp was used to character-ize glucose metabolic abnormalities in the absence of FXR in more detail. The contribution of liver glucose output to overall glucose metabolism was examined under both basal and low-dose
insu-lin clamp conditions. FXR–/– and WT mice exhibited similar basal
glucose production (Figure 3A) in the absence of insulin infusion. However, under the low-dose insulin clamp (3 U/kg/min), glucose output from the liver was completely suppressed in WT but not
FXR–/– mice (Figure 3B). Note that the negative value of glucose
production rate shown for WT mice was a result of the calcula-tion used when the radioactive tracer was enriched instead of being diluted in plasma. In addition, the markedly lower rates for both glucose infusion and glucose disposal under low- and high-dose clamp conditions demonstrate a substantial defect in peripheral insulin sensitivity (Figure 3, C and D). Taken together, these data show that both failure of suppression of glucose production by the liver and attenuated peripheral dis-posal led to overall glucose intolerance in FXR–/– mice.
Impaired insulin signaling in FXR–/– skeletal muscle and liver. A
major consequence of elevated circulating FFA is interference with the insulin signaling cascade, which could account for the peripheral insulin resistance. Thus we investigated insulin
action in skeletal muscle of WT and FXR–/– mice. After insulin
administration, IR tyrosine phosphorylation was attenuated in
the FXR–/– muscle (Figure 4A), and the level of insulin
recep-tor substrate–1 (IRS-1) associated with PI3K was also markedly decreased (Figure 4B). Insulin-stimulated PI3K activity, measured in anti-phosphotyrosine antibody IPs from muscle homogenates
of FXR–/– mice, was decreased to approximately 50% that of WT
mice (Figure 4C). Similarly, insulin failed to stimulate serine
phosphorylation of the Akt kinase in FXR–/– mice, though it led
[image:3.585.42.294.80.375.2]to a robust response in WT mice (Figure 4D). The higher basal activation of Akt in the absence of FXR could be the result of the
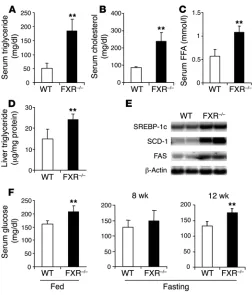
Figure 1
Lipid abnormalities in FXR–/– mice. Elevated plasma triglyceride (A),
cholesterol (B), and FFA levels (C) were observed in FXR–/– mice
compared with WT mice (n = 8–11 per group) after overnight fast-ing. (D) Elevated liver triglyceride content was seen in FXR–/– mice.
(E) Induction of genes involved in lipogenesis in the liver in FXR–/–
[image:3.585.303.541.501.687.2]mice at random-fed state. RNA samples were pooled from 5 mice in each group and loaded in duplicates. FAS, fatty acid synthase; SCD-1, stearoyl-CoA desmutase 1. (F) Plasma glucose levels in random-fed and fasting states. **P < 0.01 versus WT.
Figure 2
Impaired insulin sensitivity in FXR–/– mice. Glucose (A) and insulin (B)
elevated level of serum bile acid in these mice, which is known to activate both the JNK and MAPK pathways (20–22).
The effect on insulin signaling cannot be due to any direct con-sequences of loss of FXR function in skeletal muscle, since sensi-tive RT-PCR did not detect expression in that tissue (Figure 4E). Due to the well-documented inverse correlation between insulin sensitivity and the amount of intramuscular fat in skeletal muscle, we analyzed intramuscular triglyceride and FFA content, which
were both markedly elevated in the FXR–/– tissue (Figure 4, F and
G). Consistent with this, we observed an increased level of IRS-1 serine 307 phosphorylation (Figure 4H), which has previously been linked to triglyceride-induced insu-lin resistance (23). Interestingly, expression of several
PPARα target genes involved in fatty acid metabolism,
including the FFA transporter CD36 and the mitochon-drial and peroxisomal oxidation enzymes acyl-CoA oxidase and long-chain fatty acid dehydrogenase, was
induced in FXR–/– muscle (Figure 4I), suggesting that lipid
accu-mulation and substantial defects in insulin signaling occur despite augmented FFA transport and oxidation.
The major effect of insulin in liver is suppression of gluconeo-genesis. Since FXR deficiency led to defective insulin inhibition of hepatic glucose output (Figure 3B), the insulin response was
exam-ined in FXR–/– livers. Insulin-dependent IR phosphorylation
[image:4.585.42.315.84.260.2](Fig-ure 5A) and IRS-2 association with PI3K (Fig(Fig-ure 5B) were mark-edly blunted, suggesting substantial insulin resistance. The basis
Figure 3
Low-dose and high-dose hyperinsulinemic-euglycemic clamp in 8- to 10-week-old WT and FXR–/– mice (n = 6 per
[image:4.585.233.543.404.738.2]group). (A and B) Glucose production rate under basal (before insulin infusion; A) and low-dose clamp (3 mU/kg/ min; B) conditions. (C) Glucose infusion rate during low- (3 mU/kg/min) and high-dose clamp (10 mU/kg/min) condi-tions. (D) Glucose disposal rate during low- and high-dose clamp conditions. *P < 0.05, **P < 0.01 versus WT.
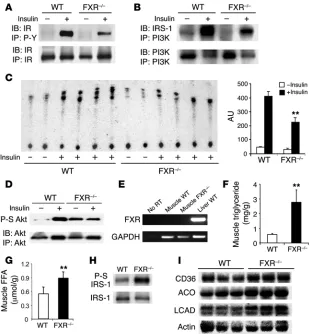
Figure 4
Impaired insulin signaling and upregulation of genes involved in fatty acid metabolism in muscle of FXR–/– mice. Muscle tissue homogenate from 4–5
mice per group were pooled together and subjected to IP and IB using antibodies as indicated. North-ern blot analysis was performed on individual mice. Results are representative of at least 3 indepen-dent experiments. (A) Phosphorylation of IR after insulin stimulation (1 U/kg). Muscle homogenates were subjected to IP by anti-phosphotyrosine (P-Y) antibody 4G10 and IB by IR antibody. Total IR level was analyzed by IP followed by IB using the IR antibody. Quantitation was derived from 3 independent experiments. (B) Level of PI3K-asso-ciated IR after insulin stimulation as analyzed by IP using PI3K antibody followed by IRS-1 IB. (C) PI3K activity assay using immunopricipitates by anti-phosphotyrosine antibody. Muscle homogenates from individual mice were subjected to IP by anti-phosphotyrosine antibody followed by PI3K assay. Quantitation was derived from individual mice. (D) Phosphorylation of Akt (serine 473; P-S Akt) after insulin stimulation. (E) FXR expression by RT-PCR. (F and G) Analysis of intramuscular triglyceride and FFA content (n = 8 per group). (H) Serine 307 phosphorylation (P-S) of IRS-1 in the muscle after IP using IRS-1 antibody. (I) Expression of genes involved in fatty acid transport and oxidation in WT and FXR–/– muscle. ACO, acyl-CoA oxidase; LCAD,
research article
The Journal of Clinical Investigation http://www.jci.org Volume 116 Number 4 April 2006 1105
for the increased basal expression of IRS-2 and association with
PI3K in untreated FXR–/– mice is unclear, but it could be secondary
to elevated hepatic bile acid levels. Furthermore, insulin-induced
PI3K activity in the FXR–/– livers was only approximately 30% that
of WT mice in anti-phosphotyrosine antibody IPs (Figure 5C). As
in the muscle, increased expression of PPARα target genes,
includ-ing liver type FFA–bindinclud-ing protein, CD36, and acyl-CoA oxidase (Figure 5D), suggested increased FFA load. Interestingly — and in accord with a recent report (19) — the fasting response of key
glu-coneogenic factors, including PPARg coactivator-1α (PGC-1α) and
PEPCK, was diminished in the FXR–/– mice (Figure 5E). This defect
could be due to either elevated lipid storage or elevated bile acids. FXR regulation of gluconeogenesis. To explore the possibility of direct regulation of gluconeogenesis by FXR, we tested the effect of CA on hepatic expression of several key genes involved in gluconeogenesis
in WT and FXR–/– mice. As expected, no FXR mRNA was detected
in FXR–/– mice with a cDNA probe corresponding to the deleted
last exon from the targeting construct (11), and SHP expression was markedly lower. Feeding a 1% CA diet for 5 days increased SHP
expression in WT mice and strongly decreased CYP7A1 expression, as expected (4, 11, 24). Both
responses were lost in FXR–/– mice, indicating
that FXR-SHP–independent mechanisms for repression observed in some circumstances (5, 6) were not active over this time course. Dietary CA also decreased expression of multiple
gluco-neogenic genes in WT mice, including PGC-1α,
PEPCK, and G-6-Pase, and this response was
completely absent in FXR–/– mice (Figure 6A).
Hepatocyte nuclear factor 4α (HNF-4α)
expres-sion showed a similar response to CA treatment, and its basal expression was modestly increased
in FXR–/– mice compared with WT mice.
Interestingly, not all genes involved in gluco-neogenesis were affected in the same fashion. Pyruvate carboxylase expression (Figure 6B) was unaffected by CA treatment in either the WT or
FXR–/– mice, whereas forkhead transcription
fac-tor FOXO1 mRNA levels were decreased in the
FXR–/– mice compared with WT in the presence
and absence of CA. We also studied the effect of CA treatment on 2 rate-limiting enzyme genes involved in the glycolytic pathway, glucokinase and pyruvate kinase. Pyruvate kinase expression was higher in FXR–/– livers but was not affected
by CA. Glucokinase transcripts were increased by
CA feeding in both the WT and FXR–/– mice,
sug-gesting this effect might be due to CA stimula-tion of signaling pathways independent of FXR. We then investigated whether the suppressed gluconeogenic gene expression affected serum glucose levels. Indeed, CA feeding decreased fasting glucose by approximately 50% in WT mice but did not have a statistically significant
effect in FXR–/– mice (Figure 6C). Consistent
with previous results (25), CA feeding also reduced serum triglyceride levels in the WT
mice but not the FXR–/– mice (Figure 6D).
The increased expression of SHP provides 1 potential mechanism for these FXR-depen-dent negative effects, as observed in the bile acid negative feed-back regulation of CYP7A1 expression (4–6, 24). We tested this hypothesis by studying the effects of CA feeding on
gluconeogen-ic gene expression in SHP–/– mice. On the chow diet, SHP–/– mice
responded in a manner similar to FXR–/– mice, showing
some-what higher serum glucose in both fed (152 ± 13 versus 135 ± 9 mg/dl in WT) and fasted conditions (139 ± 15 versus 105 ± 12 mg/dl in WT) without significant changes in insulin. As observed
in the FXR–/– mice, the SHP–/– mice also did not show repression
of PEPCK, PGC-1α, or G-6-Pase expression in response to CA
feeding (Figure 6E). On a chow diet, they exhibited modestly elevated serum glucose in both fasted and fed conditions (Fig-ure 6F) without significant changes in insulin. However, they did not decrease serum glucose in response to dietary CA, suggesting that this effect of CA is mediated through the induction of SHP by FXR. Taken together, these results allow us to conclude that the previously identified pathways of bile acid feedback
regula-tion by the FXR-SHP nuclear receptor cascade (4–6, 24)also
[image:5.585.45.351.83.352.2]tar-get glucose metabolism.
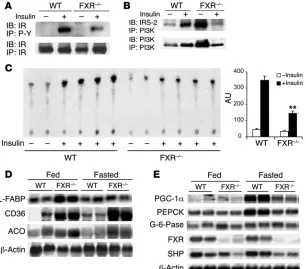
Figure 5
Impaired hepatic insulin signaling and expression of fatty acid metabolism and gluconeo-genesis in the livers of FXR–/– mice. Liver tissue homogenates from 4–5 mice per group
Discussion
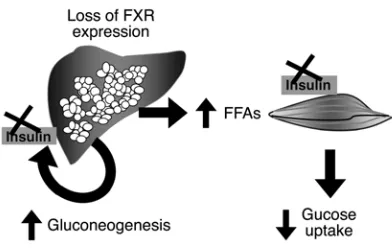
Our results provide 2 independent but complementary lines of evidence to show that the bile acid receptor FXR is a key regulator of glucose metabolism in vivo. As diagrammed in Figure 7, the first is that loss of FXR disrupts normal glucose homeostasis and leads to the development of insulin resistance as shown by hyper-glycemia, impaired glucose tolerance, and severely blunted insulin signaling in both liver and muscle. This is associated with elevated
serum triglycerides and lipid accumulation in FXR–/– livers, which
has been ascribed to increased hepatic lipid production (12).
The FXR–/– mice also showed markedly elevated circulating FFA
levels comparable to those of WT mice on a high-fat diet, which is consistent with their elevated lipoprotein lipase activity (12). Second, FXR activation by CA suppressed expression of multiple
genes involved in gluconeogenesis in WT mice but not FXR–/– or
SHP–/– mice. This was associated with decreased fasting serum
glucose in WT but not FXR–/– mice (Figure 6C), and preliminary
results showed a similar effect in SHP–/– mice (our unpublished
observations). These results indicate that the FXR-SHP negative regulatory cascade targets gluconeogenesis. Taken together, our results suggest that FXR function provides a novel molecular link between fatty liver and development of insulin resistance.
There are 2 major defects in glucose metabolism in FXR–/– mice:
attenuated inhibition of glucose production in the liver in response
to insulin and severely impaired peripheral glucose disposal. Both are the result of markedly blunted insulin signaling in these
tis-sues associated with lipid accumulation. FXR–/– mice develop overt
fatty liver, elevated levels of plasma FFAs, and elevated triglyceride and FFA levels in skeletal muscle.
In patients, the association of fat accumulation in the liver with insulin resistance is independent of obesity (13), and a recent study found that in nonobese, nondiabetic subjects fatty liver was both closely associated with and an early predictor of metabolic dis-orders such as hypertriglyceridemia and insulin resistance (14). Although the precise mechanisms linking fatty liver to diabetes remain unknown, the effect of elevated plasma FFAs on insulin sen-sitivity is well established. The contribution of elevated FFA to the development of peripheral insulin resistance was initially described in the Randle hypothesis (26), which suggested that higher FFA levels would compete with glucose for mitochondrial oxidation, leading to impaired glucose usage (27). More recently, a number of studies have revealed that FFAs interfere with the function of the insulin signaling pathway in skeletal muscle (28, 29), resulting in acquired insulin resistance. However, an intriguing recent study
demonstrated that overexpression of PPARα in skeletal muscle
results in insulin resistance via a distinct pathway associated with altered mitochondrial function (30). The apparent induction of
[image:6.585.76.501.83.378.2]expression of genes of fatty acid oxidation in the FXR–/– skeletal
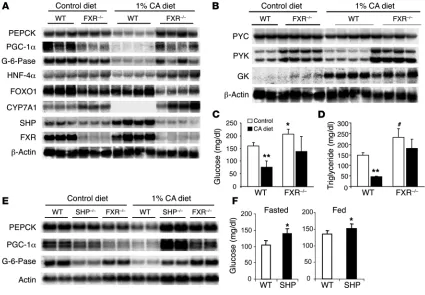
Figure 6
Effects of FXR agonists. Expression of genes involved in gluconeogenesis and glucose and triglyceride levels, which were measured after a 1% CA diet for 5 days. Glucose and triglyceride levels were measured at fed state from 6–7 mice per group and RNA from each group was pooled from 3–4 mice after overnight fasting. (A) Suppression of genes involved in gluconeogenesis by CA feeding was observed in WT but not FXR–/–
research article
The Journal of Clinical Investigation http://www.jci.org Volume 116 Number 4 April 2006 1107
muscle is consistent with elevated PPARα activity. In addition, in
an effort to rescue insulin resistance by lowering FFA levels, we
treated mice with the PPARα agonists WY-14643 and fenofibrate.
Instead of improving insulin sensitivity, both treatments further
exacerbated the glucose intolerance in the FXR–/– mice (data not
shown), suggesting that activation of the PPARα pathway in these
animals is detrimental to insulin sensitivity. Thus we propose that
the impaired insulin signaling in FXR–/– skeletal muscle is due to
the adverse effects of elevated circulating FFA levels.
In the fed state, when insulin-dependent glucose uptake is the
major determinant, FXR–/– mice show hyperglycemia that is
con-sistent with their reduced peripheral insulin sensitivity.
Periph-eral insulin resistance in FXR–/– mice was confirmed by both
the impaired glucose tolerance after glucose challenge and the decreased glucose disposal rate in the hyperinsulinemic clamp. However, blood glucose levels are dependent not only on periph-eral glucose uptake, but also on glucose output from the liver. In human subjects, fat accumulation in the liver is associated with defects in insulin action in this tissue (13). Consistent with this,
the livers of FXR–/– mice were also insulin resistant as shown by
elevated fasting glucose levels in relatively older (3-month-old) ani-mals, the failure to suppress glucose production in the low-dose clamp condition, and direct analysis of insulin signaling pathways.
Interestingly, FXR–/– mice were also defective in the induction of
gluconeogenic genes, including PGC-1α and PEPCK, after fasting
(Figure 5E), which is consistent with a recent report of decreased expression of these genes in fasted FXR–/– livers (19). This failure to
induce gluconeogenesis may contribute to the relative
normaliza-tion of glucose levels in younger FXR–/– mice (Figure 1). The basis
for this defect is not clear, but it could be a reflection of elevated FFA or other consequences of FXR deficiency in the liver, includ-ing elevated bile acid levels, which could affect the response of gluconeogenic genes to inductive signals such as glucocorticoids or cAMP. Taken together, we conclude that both peripheral and hepatic insulin resistance contribute to dysregulation of glucose
homeostasis in FXR–/– mice (Figure 7). It is possible that either
genetic or pharmacologic loss of FXR function could contribute to insulin resistance in patients with fatty liver disease.
If the absence of FXR leads to insulin resistance, does its acti-vation promote insulin sensitivity? CA feeding in WT but not
FXR–/– mice suppressed the expression of multiple genes in the
gluconeogenic pathway, including PGC-1α, PEPCK, and
G-6-Pase, and significantly lowered plasma glucose. These alterations
in gluconeogenic gene expression were also lost in SHP–/– mice,
strongly suggesting that they are dependent on the FXR-SHP negative regulatory pathway previously associated with negative feedback regulation of both bile acid (4–6, 24) and triglyceride
(25) production. One recent study found that SHP represses the PEPCK and G-6-Pase promoters through its interaction with the glucocorticoid receptor (17), while another suggested that SHP could suppress these promoters through its interaction with a nonreceptor target, HNF-3 (31). Transgenic overexpression of SHP in the liver markedly decreases bile acid production via direct effects on CYP7A1 and other promoters, while effects on other pathways, including lipogenesis, appear indirect (32). Thus SHP activation may modulate gluconeogenesis via several mechanisms that remain to be elucidated.
These specific responses of gluconeogenic genes to activation of FXR contrast with their attenuated induction by fasting in the
FXR–/– mice. Elevated bile acids activate FXR-independent
signal-ing pathways such as JNK, PKC, and MAPK (20–22), and CA feed-ing had disparate effects on other genes, for example, inducfeed-ing glucokinase expression in an FXR-independent manner. In accord with the decrease in hepatic glucose production predicted by the effects on gluconeogenic gene expression, the CA diet markedly lowered fasting glucose levels in the WT mice. These effects of CA mimic the response of the liver to feeding, raising the intriguing possibility that the return of reabsorbed bile acids to the liver, arriving with the co-absorbed nutrients, provides a signal that could function in concert with insulin and facilitate the energy switch occurring at the fasting-feeding transition.
In contrast to the results with CA feeding, we did not observe similar effects on gluconeogenic gene expression or glucose metabolism in several different treatments with the synthetic FXR agonist GW4064 over comparable time courses (data not shown). In these experiments, appropriate responses of SHP, CYP7A1, and other FXR targets at early time points confirmed the general effectiveness of the treatment, but these responses were blunted or absent as treatments continued (3–7 days). This indicates that the apparent lack of effect of GW4064 on glucose metabolism may be due to problems with the in vivo pharmacokinetics of this synthetic ligand. Alternatively, differences observed in effects of different FXR agonists (33) suggest that GW4064 may be a selec-tive FXR modulator unable to activate a full response that encom-passes the effects on glucose metabolism. However, it seems more likely that bile acid activation of additional signaling pathways (20–22) may be required to complement the FXR-dependent effects of CA on glucose metabolism.
The current results contrast with a recent report indicating that FXR agonists induced, rather than decreased, expression of PEPCK, but tended to increase plasma glucose (18). The authors’ in vitro studies with chenodeoxycholic acid and GW4064 obviously differ from our in vivo studies, and their in vivo treatment protocols (50 mg/kg GW4064 i.p. twice daily) differed from ours (35 mg/kg oral gavage daily). Overall, however, our failure to observe a clear effect of GW4064 on glucose levels is consistent with these prior results (18).
[image:7.585.65.261.80.206.2]In conclusion, we have demonstrated that FXR is required for the maintenance of glucose homeostasis in vivo. As observed in
Figure 7
Dysregulation of hepatic and skeletal muscle glucose homeostasis in FXR–/– mice. Loss of FXR function in the liver results in increased
type 2 diabetes, the altered glucose homeostasis in FXR–/– mice
includes both dysregulated gluconeogenesis in liver and blunted insulin signaling in muscle. In addition, activation of FXR by CA suppresses gluconeogenic gene expression through the induction
of SHP. FXR–/– mice provide what we believe to be a unique animal
model that links fatty liver with development of insulin resistance and type 2 diabetes.
Methods
Animals. FXR–/– mice were obtained from F. Gonzalez (NIH, Bethesda, Maryland, USA) and backcrossed to C57BL/6J background for 5 genera-tions. SHP–/– mice were generated previously in this laboratory (5) and backcrossed to C57BL/6J background for 5 generations. Genotyping of the mice was performed as described previously (5, 11). C57BL/6J WT mice were used as controls. Mice were maintained in the accredited pathogen-free Baylor College of Medicine Transgenic Mice Facility on a 12-hour light/dark cycle with free access to food and water. All experiments were done following approval of the protocol by the animal care research com-mittee of Baylor College of Medicine.
Plasma glucose and lipids assays. Unless otherwise indicated, all plasma sam-ples were drawn from mice at 8–12 weeks of age after overnight fasting. Glucose kits were purchased from Sigma-Aldrich (GPO-trinder), choles-terol and triglyceride kits were obtained from Thermo DMA Inc., and FFA acid kits were obtained from WAKO Chemicals Inc. Leptin was measured by ELISA (R&D Systems).
GTT and ITT. We performed i.p. GTTs and ITTs on 8- to 12-week-old mice. For GTTs, mice were injected a glucose dose of 2 g/kg of body weight after overnight fasting. For ITTs, random fed mice were injected with an insulin dose (Humulin R; Eli Lily and Co.) of 0.5 U/kg body weight and were fasted throughout the experiment. Insulin level was determined using a rat insulin ELISA kit (Crystal Chem Inc.).
Low-and high-dose hyperinsulinemic euglycemic clamp study. Mice were cannu-lated as described previously (34). Briefly, mice were anesthetized, and the right jugular vein was exposed via a midline neck incision through which a microcannula was inserted, threaded into the right atrium, and anchored at the venotomy site. Mice were allowed to recover for 4 days before the clamp. After an overnight fast, chronically catheterized conscious mice received a primed infusion (10 μCi) and then a constant rate intravenous infusion (0.1 μCi/min) of high pressure liquid chromatography–purified
3H-glucose (PerkinElmer) using a syringe infusion pump (KD Scientific).
For determination of basal glucose production, blood samples were col-lected from the tail vein after 50, 55, and 60 minutes of labeled glucose infusion. After 60 minutes, mice were primed with regular insulin (bolus 40 mU/kg body weight) followed by a 2-hour insulin infusion (3 mU/kg/min). Simultaneously, 10% glucose was infused using another infusion pump at a rate adjusted to maintain the blood glucose level at 100–140 mg/dl (low-dose hyperinsulinemic euglycemic clamp). Blood glucose concentra-tion was determined every 10 minutes by a glucometer (LifeScan Inc.). Near the end of a 120-minute period (at 100, 110, and 120 min), blood was col-lected to measure hepatic glucose production and peripheral glucose dis-posal rates (35–37). A high-dose hyperinsulinemic euglycemic clamp was then started using 10 mU/kg/min insulin infusion and continued for 120 minutes to measure in vivo glucose utilization according to the method of Fujita et al. (35) with slight modifications. We monitored the plasma glucose level every 6–10 minutes. At the end of 120 minutes, blood was collected to measure the glucose disposal rate, and the total body glucose infusion rate was calculated.
Northern blotting analysis. Total RNA was isolated from snap-frozen liver or muscle tissues using Trizol reagent (Invitrogen Corp.). Northern blots were performed as previously described (34) using 20 μg total RNA
frac-tionated on 1.2% 2 M formaldehyde agarose gels and transferred to Zeta-Probe GT genomic membrane (Bio-Rad). Gene-specific cDNA probes amplified by RT-PCR were used for hybridization in UltraHyb buffer (Ambion) at 42°C overnight. The FXR cDNA probe corresponded to the deleted last exon in the targeting construct of bp 1220–1698 of Gene-Bank cDNA NM009108.
Tissue triglyceride and FFA content analysis. Liver and muscle triglyceride and FFA content was analyzed using chloroform-methanol extraction and enzymatic assay kits (Thermo DMA Inc. and WAKO Chemicals Inc., respectively). Quadriceps was used for muscle analysis, and care was taken to avoid extracapsular fat tissues for this purpose. Total lipids were resus-pended in 0.2% Triton-100 solution after extraction, followed by triglyc-eride assay using a kit from Thermo DMA Inc. and FFA assay using a kit from WAKO Pure Chemicals Industries Ltd.
IP and IB. For IP, 4 mg total protein was incubated with 4 μg of indicated antibodies at 4°C overnight, before incubation with protein A/G agarose beads at 4°C for 2 hours. After washing, beads were resuspended in Laem-mli buffer before resolution by SDS-PAGE. Proteins were transferred to nitrocellulose membrane after electrophoresis and detected by chemilumi-nescence (Supersignal; Pierce Biotechnology). Monoclonal anti-phospho-tyrosine antibody and polyclonal anti-PI3K P85 antibody were obtained from Upstate USA Inc. Rabbit polyclonal anti-IR antibody was a gift from Joslin Diabetes Center. Anti–phospho-Akt (Ser473) and anti–Akt-2 anti-bodies were obtained from Cell Signaling Technology.
In vivo insulin stimulation and analysis of insulin signaling. Mice were fasted overnight and injected i.p. with 5 U/kg body weight of regular insulin (Humulin; Eli Lilly and Company). Mice were sacrificed 5 minutes after insulin stimulation. Liver and muscle was removed, snap-frozen in liquid nitrogen, and stored at –80°C until use. Liver and muscle tissue were homogenized in protein lysis buffer containing 50 mM Tris-HCl, pH 7.4; 1% NP-40; 0.25% sodium deoxycholate; 150 mM NaCl; 1 mM EDTA; 1 mM PMSF; 1 μg/ml each of aprotinin, leupeptin, and pepstatin; 1 mM Na3VO4; and 1 mM NaF.
PI3K activity assay. PI3K activity was assayed in 4G10 anti-phosphotyro-sine antibody IPs from muscle and liver extracts as previously described (38, 39). Extracted reaction products were resolved by thin-layer chromatogra-phy using Silica gel 60 plates (EMD Chemicals Inc.), and phosphorylated lipids were visualized by autoradiography.
Statistics. Values are expressed as mean ± SD. The differences between dif-ferent genotypes were calculated by the 2-tailed Student’s t test. P < 0.05 was considered statistically significant.
Note added in proof. After this work was completed, similar results were reported by Cariou et al. (40) and Zhang et al. (41).
Acknowledgments
Research was supported by NIH grants R01 DK53366 and U19 DK62434 (to D.D. Moore), American Heart Association Postdoc-toral Fellowship AHA-0425117Y (Texas Affiliate; to K. Ma), and NIH grants R01 DK68037 and R01 HL-51586 (to L. Chan). We thank X-Ceptor Therapeutics Inc. for supplying GW4064, and Franck Mauvais-Jarvis for guidance on PI3K assays.
Received for publication May 10, 2005, and accepted in revised form January 31, 2006.
research article
The Journal of Clinical Investigation http://www.jci.org Volume 116 Number 4 April 2006 1109 1. Parks, D.J., et al. 1999. Bile acids: natural ligands for
an orphan nuclear receptor. Science.284:1365–1368. 2. Makishima, M., et al. 1999. Identification of a nucle-ar receptor for bile acids. Science.284:1362–1365. 3. Wang, H., Chen, J., Hollister, K., Sowers, L.C., and
Forman, B.M. 1999. Endogenous bile acids are ligands for the nuclear receptor FXR/BAR. Mol. Cell.3:543–553.
4. Goodwin, B., et al. 2000. A regulatory cascade of the nuclear receptors FXR, SHP-1, and LRH-1 represses bile acid biosynthesis. Mol. Cell.6:517–526. 5. Wang, L., et al. 2002. Redundant pathways for
neg-ative feedback regulation of bile acid production.
Dev. Cell.2:721–731.
6. Kerr, T.A., et al. 2002. Loss of nuclear receptor SHP impairs but does not eliminate negative feedback reg-ulation of bile acid synthesis. Dev. Cell.2:713–720. 7. Holt, J.A., et al. 2003. Definition of a novel growth
factor-dependent signal cascade for the suppression of bile acid biosynthesis. Genes Dev.17:1581–1591. 8. Urizar, N.L., Dowhan, D.H., and Moore, D.D. 2000.
The farnesoid X-activated receptor mediates bile acid activation of phospholipid transfer protein gene expression. J. Biol. Chem.275:39313–39317. 9. Claudel, T., et al. 2003. Farnesoid X receptor
ago-nists suppress hepatic apolipoprotein CIII expres-sion. Gastroenterology.125:544–555.
10. Claudel, T., et al. 2002. Bile acid-activated nucle-ar receptor FXR suppresses apolipoprotein A-I transcription via a negative FXR response ele-ment. J. Clin. Invest.109:961–971. doi: 10.1172/ JCI200214505.
11. Sinal, C.J., et al. 2000. Targeted disruption of the nuclear receptor FXR/BAR impairs bile acid and lipid homeostasis. Cell.102:731–744.
12. Lambert, G., et al. 2003. The farnesoid X-receptor is an essential regulator of cholesterol homeostasis.
J. Biol. Chem.278:2563–2570.
13. Seppala-Lindroos, A., et al. 2002. Fat accumula-tion in the liver is associated with defects in insulin suppression of glucose production and serum free fatty acids independent of obesity in normal men.
J. Clin. Endocrinol. Metab.87:3023–3028.
14. Kelley, D.E., McKolanis, T.M., Hegazi, R.A., Kuller, L.H., and Kalhan, S.C. 2003. Fatty liver in type 2 diabetes mellitus: relation to regional adiposity, fatty acids, and insulin resistance. Am. J. Physiol. Endocrinol. Metab.285:E906–E916.
15. De Fabiani, E., et al. 2003. Coordinated control of cholesterol catabolism to bile acids and of gluco-neogenesis via a novel mechanism of transcription
regulation linked to the fasted-to-fed cycle. J. Biol. Chem.278:39124–39132.
16. Duran-Sandoval, D., et al. 2004. Glucose regulates the expression of the farnesoid X receptor in liver.
Diabetes.53:890–898.
17. Yamagata, K., et al. 2004. Bile acids regulate glu-coneogenic gene expression via small heterodimer partner-mediated repression of hepatocyte nuclear factor 4 and Foxo1. J. Biol. Chem.279:23158–23165. 18. Stayrook, K.R., et al. 2005. Regulation of carbo-hydrate metabolism by the farnesoid X receptor.
Endocrinology.146:984–991.
19. Cariou, B., et al. 2005. Transient impairment of the adaptive response to fasting in FXR-deficient mice.
FEBS Lett.579:4076–4080.
20. Gupta, S., et al. 2004. Deoxycholic acid activates the c-Jun N-terminal kinase pathway via FAS receptor activation in primary hepatocytes. Role of acidic sphingomyelinase-mediated ceramide generation in FAS receptor activation. J. Biol. Chem. 279:5821–5828.
21. Milkiewicz, P., Roma, M.G., Elias, E., and Coleman, R. 2002. Hepatoprotection with tauroursodeoxy-cholate and beta muritauroursodeoxy-cholate against taurolitho-cholate induced cholestasis: involvement of signal transduction pathways. Gut.51:113–119. 22. Fang, Y., et al. 2004. Bile acids induce
mitochon-drial ROS, which promote activation of receptor tyrosine kinases and signaling pathways in rat hepatocytes. Hepatology.40:961–971.
23. Le Marchand-Brustel, Y., et al. 2003. Fatty acid-induced insulin resistance: role of insulin receptor substrate 1 serine phosphorylation in the retro-regulation of insulin signalling. Biochem. Soc. Trans. 31:1152–1156.
24. Lu, T.T., et al. 2000. Molecular basis for feedback regulation of bile acid synthesis by nuclear recep-tors. Mol. Cell.6:507–515.
25. Watanabe, M., et al. 2004. Bile acids lower triglyc-eride levels via a pathway involving FXR, SHP, and SREBP-1c. J. Clin. Invest.113:1408–1418. doi:10.1172/JCI200421025.
26. Randle, P.J., Garland, P.B., Hales, C.N., and News-holme, E.A. 1963. The glucose fatty-acid cycle. Its role in insulin sensitivity and the metabolic distur-bances diabetes mellitus. Lancet.1:785–789. 27. Ruderman, N.B., Saha, A.K., Vavvas, D., and
Wit-ters, L.A. 1999. Malonyl-CoA, fuel sensing, and insulin resistance. Am. J. Physiol.276:E1–E18. 28. Shulman, G.I. 2000. Cellular mechanisms of
insu-lin resistance. J. Clin. Invest.106:171–176.
29. Petersen, K.F., and Shulman, G.I. 2002. Pathogen-esis of skeletal muscle insulin rPathogen-esistance in type 2 diabetes mellitus. Am. J. Cardiol.90:11G–18G. 30. Finck, B.N., et al. 2005. A potential link between
muscle peroxisome proliferator-activated receptor-α signaling and obesity-related diabetes. Cell Metab. 1:133–144.
31. Kim, J.Y., et al. 2004. Orphan nuclear receptor small heterodimer partner represses hepatocyte nuclear factor 3/Foxa transactivation via inhibition of its DNA binding. Mol. Endocrinol.18:2880–2894. 32. Boulias, K., et al. 2005. Regulation of hepatic
meta-bolic pathways by the orphan nuclear receptor SHP. EMBO J.24:2624–2633.
33. Downes, M., et al. 2003. A chemical, genetic, and structural analysis of the nuclear bile acid receptor FXR. Mol. Cell.11:1079–1092.
34. Saha, P.K., Kojima, H., Martinez-Botas, J., Sunehag, A.L., and Chan, L. 2004. Metabolic adaptations in the absence of perilipin: increased beta-oxidation and decreased hepatic glucose production associ-ated with peripheral insulin resistance but normal glucose tolerance in perilipin-null mice. J. Biol. Chem.279:35150–35158.
35. Fujita, Y., et al. 1998. Increased intestinal glucose absorption and postprandial hyperglycaemia at the early step of glucose intolerance in Otsuka Long-Evans Tokushima Fatty rats. Diabetologia. 41:1459–1466.
36. Ma, K., et al. 2002. Increased beta-oxidation but no insulin resistance or glucose intolerance in mice lack-ing adiponectin. J. Biol. Chem.277:34658–34661. 37. Kim, J.K., Gavrilova, O., Chen, Y., Reitman, M.L.,
and Shulman, G.I. 2000. Mechanism of insulin resistance in A-ZIP/F-1 fatless mice. J. Biol. Chem. 275:8456–8460.
38. Ueki, K., et al. 2000. Restored insulin-sensitivity in IRS-1-deficient mice treated by adenovirus-medi-ated gene therapy. J. Clin. Invest.105:1437–1445. 39. Mauvais-Jarvis, F., et al. 2002. Reduced expression
of the murine p85α subunit of phosphoinositide 3-kinase improves insulin signaling and ame-liorates diabetes. J. Clin. Invest.109:141–149. doi:10.1172/JCI200213305.
40. Cariou, B., et al. 2006. The farnesoid X receptor mod-ulates adiposity and peripheral insulin sensitivity in mice. J. Biol. Chem. doi:10.1074/jbc.M510258200. 41. Zhang, Y., et al. 2006. Activation of the nuclear
receptor FXR improves hyperglycemia and hyperlip-idemia in diabetic mice. Proc. Natl. Acad. Sci. U. S. A.