www.impactjournals.com/oncotarget/ Oncotarget, Vol. 7, No. 32
Nomograms predicting long-term overall survival and
cancer-specific survival in head and neck squamous cell carcinoma
patients
Jun Ju1,*, Jia Wang2,*, Chao Ma1,*, Yun Li1, Zhenyan Zhao1, Tao Gao1, Qianwei Ni1 and Moyi Sun1
1 State Key Laboratory of Military Stomatology & National Clinical Research Center for Oral Diseases & Shanxi Clinical
Research Center for Oral Diseases, Department of Oral and Maxillofacial Surgery, School of Stomatology, Fourth Military Medical University, Xincheng, Xi’an, Shaanxi, China
2 State Key Laboratory of Military Stomatology & National Clinical Research Center for Oral Diseases & Shanxi Key Laboratory
of Stomatology, Department of Prosthodontics, School of Stomology, Fourth Military Medical University, Xincheng, Xi’an, Shaanxi, China
* These authors have contributed equally to this work
Correspondence to: Moyi Sun, email: moyisun08@163.com
Keywords: head and neck squamous cell carcinoma, nomogram, overall survival, cancer-specific survival, prognosis Received: April 16, 2016 Accepted: June 13, 2016 Published: July 13, 2016
ABSTRACT
This study aimed to develop nomograms to predict long-term overall survival and cancer-specific survival in patients with head and neck squamous cell carcinoma (HNSCC). We conducted prognostic analyses and developed nomograms predicting survival outcome using HNSCC patient data collected from the Surveillance, Epidemiology and End Results (SEER) program of the National Cancer Institute. An external dataset of 219 patients was used to validate the nomograms. Of 36,179 HNSCC patients, 9,627 (26.6%) died from HNSCC and 4,229 (11.7%) died from other causes. Median follow-up was 28 months (1-107 months). Nomograms predicting overall survival (OS) and cancer-specific survival (CSS) were developed according to 10 clinicopathologic factors (age, race, sex, tumor site, tumor grade, surgery, radiotherapy and TNM stage), with concordance indexes (C-indexes) of 0.719 and 0.741, respectively. External validation C-indexes were 0.709 and 0.706 for OS and CSS, respectively. Our results suggest that we successfully developed nomograms predicting five- and eight-year HNSCC patient OS and CSS with high accuracy. These nomograms could help clinicians tailor surgical, adjuvant therapeutic and follow-up strategies to more effectively treat HNSCC patients.
INTRODUCTION
Head and neck squamous cell carcinoma (HNSCC) is the most common malignant head and neck tumor. Global annual HNSCC incidence is more than 500,000 [1, 2] and in United States alone, annual incidence is 40,000 with 7,890 deaths reported [3]. Due to clinicopathologic heterogeneity and relatively high malignancy, three- and five-year HNSCC patient OS rates range from 54.0% to 93% and 46.2% to 82%, respectively [4, 5]. For patients with tumors located in important organs or with high-stage tumors, radical surgery is not advised. Therefore, accurate estimates of HNSCC patient prognoses based on clinicopathologic factors would help clinicians provide
appropriate individual treatments. HNSCC patients are also at high risk of death from other factors such as liver diseases, secondary cancers and chemoradiotherapeutic toxicity [6, 7]. While deaths resulting from other causes (DROC) are often related to cancer-specific mortality (CSM), measuring CSS, rather than OS, will more accurately describe patient survival due to HNSCC directly.
The National Comprehensive Cancer Network (NCCN) guidelines [8] currently recommend the use of the American Joint Committee on Cancer (AJCC) Staging Manual (7th edition) to predict HNSCC patient prognosis [9]. However, HNSCC patient stage, from I to IV, is only based on TNM stage. Consideration of other clinicopathologic factors like age, sex, tumor site and
treatment, which are associated with HNSCC patient survival [10-13], is necessary for accurate prognostic analyses. Therefore, our prognosis predictions included age, sex, race, tumor site, surgery and radiotherapy, along with TNM stage.
Using nomograms to predict cancer prognosis is a growing trend. Compared with the AJCC Staging Manual, nomograms predict individual patient survival with higher accuracy. Nomograms are useful scoring and visualization tools that can transform multi-factorial Cox’s or competing risks models into a single score sheet. Nomograms have been used to assisting surgeons in developing treatment and follow-up strategies in several cancers, including gastric cancer [14], adenoid cystic carcinoma [15] and breast cancer [16] based on a series of factors together. Nomogram development is also included in the NCCN guidelines [17]. One HNSCC study based on the Surveillance, Epidemiology and End Results (SEER) database between 2000 and 2010 applied nomograms [18], but TNM stage information was not available in the database until 2004, and this study did not include patients without surgery. We aimed to develop HNSCC nomograms predicting long-term OS and CSS based on multiple clinicopathologic factors, as well as TNM stage, to improve individual patient treatments and follow-up strategies.
RESULTS
Patient, tumor and follow-up characteristics
A total of 154,581 primary HNSCC patients diagnosed between 2004 and 2012 were collected from the SEER database of the National Cancer Institute. All patients were diagnosed above 15 years of age. 118,402 records were excluded due to clinicopathologic factor uncertainty or because information was obtained from a death certificate or autopsy. In total, 36,179 primary HNSCC patients were included in our study to conduct prognostic analyses and develop nomograms, and the median follow-up length was 28 months (1-107 months).
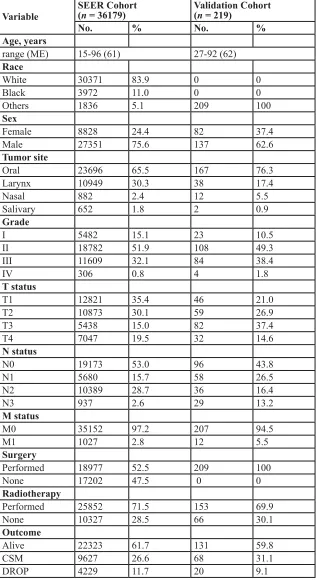
Patient ages ranged from 15 to 96 years (median, 61). Of 36,179 eligible patients, 30,371 (83.9%) were white and 27,351 (75.6%) were male. 23,696 (65.5%) tumors arose from the oral cavity or pharynx. 11,915 (32.9%) tumors were poorly or un-differentiated. T3-T4 tumors accounted for 34.5% of all tumors, and positive neck nodes and distant metastases accounted for 47.0% and 2.8%, respectively. 18,977 (52.5%) and 25,852 (71.5%) patients received surgery and radiotherapy, respectively. Of these, 9,627 (26.6%) died from HNSCC and 4,229 (11.7%) died from other causes (Table 1).
The validation cohort included 219 primary HNSCC
patients diagnosed and treated between 2000 and 2008 (Table 1). All were Chinese and received surgery. Median follow-up length was 37 months (12-130 months).
Prognostic analyses: HNSCC patient OS and CSS
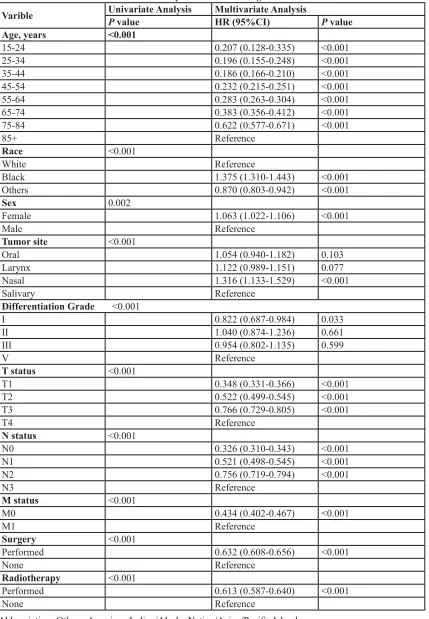
By univariate analysis, all clinicopathologic factors were statistically associated with OS. Multivariate analysis indicated that all ten factors were independent prognostic factors for HNSCC OS. (Table 2)
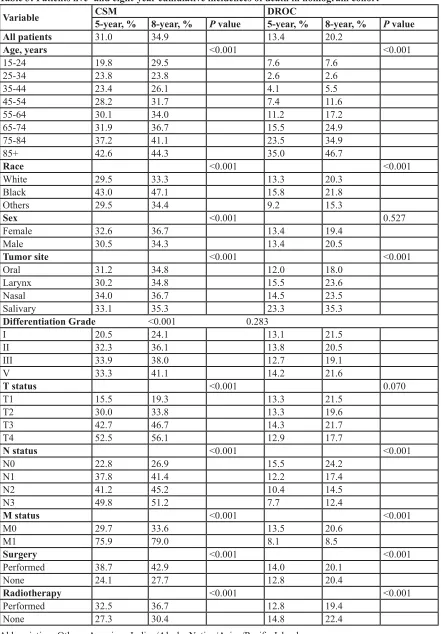
According to Gray’s test and a multivariate competing risks model, all factors were independent for HNSCC CSS (P < 0.05) (Table 3). CSM and DROC cumulative incidence functions (CIF) were significantly higher in older patients than in younger patients. Compared to whites and other races, black patient prognoses were more directly influenced by HNSCC. When tumors were located in the salivary gland and larynx, CSM CIFs were highest and lowest, respectively. HNSCC patients with higher NM stage suffered from a worse CSS, while DROC incidence decreased. Notably, patients who received surgery or radiotherapy had worse CSS rates than those who did not receive surgery or radiotherapy.
Nomograms predicting five- and eight-year survival
According to the smallest AIC (26819.6) of the predictive accuracy test, all factors were selected to develop the nomogram predicting five- and eight-year OS. According to the CIF, all factors were also selected to develop the nomogram predicting five- and eight-year CSS (Figure 1).
Nomogram validation
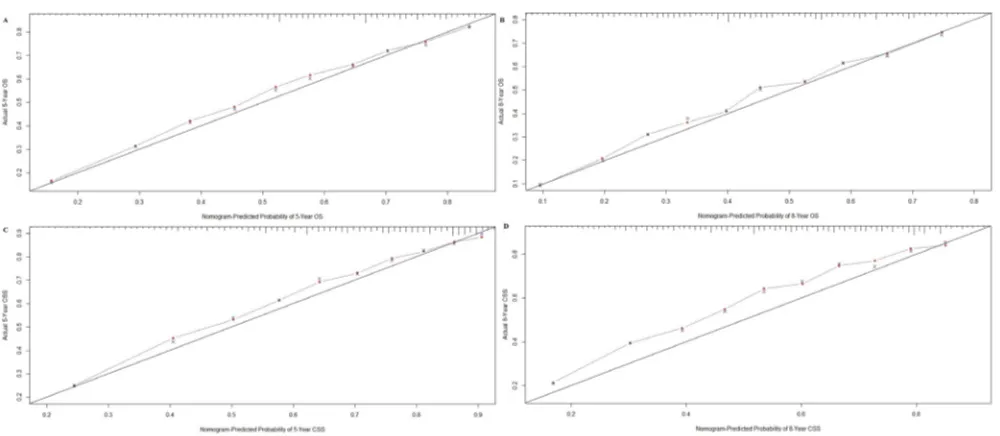
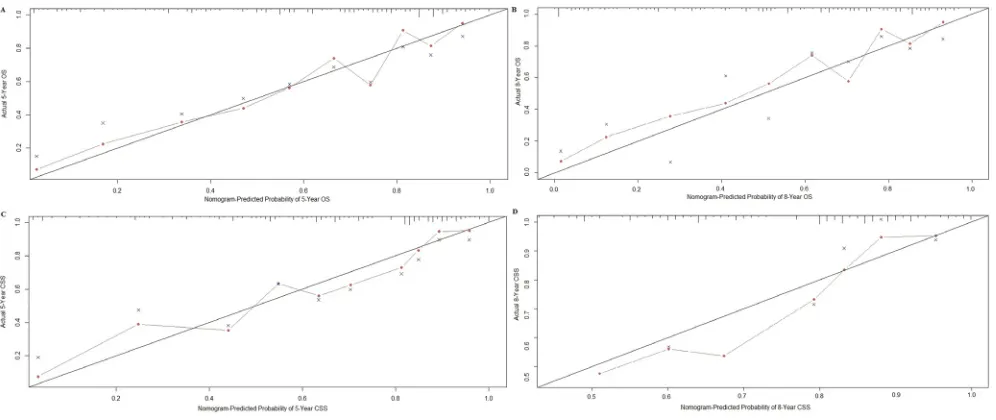
,Nomograms were validated internally and externally using bootstrap and ten-fold cross-validation methods. Internal validation via the training cohort showed that nomograms predicting OS and CSS were in excellent agreement with actual OS and CSS, with concordance indexes (C-indexes) of 0.719 and 0.741, respectively. External validation via the validation cohort showed that OS and CSS nomogram C-indexes decreased slightly to 0.709 and 0.706, respectively. Internal and external OS and CSS nomogram calibration plots showed excellent agreement between the calibration curves and the 45-degree perfect match straight lines (Figure 2 and 3).
DISCUSSION
Figure 1: Nomograms predicting five- and eight-year OS A. and CSS B.
Figure 2: Internal calibration plot for A. five- and B. eight-year OS and C. five- and D. eight-year CSS. The 45-degree straight line
[image:3.612.58.558.461.679.2]Table 1: Patient, tumor and follow-up characteristics
Variable SEER Cohort(n = 36179) Validation Cohort(n = 219)
No. % No. %
Age, years
range (ME) 15-96 (61) 27-92 (62) Race
White 30371 83.9 0 0
Black 3972 11.0 0 0
Others 1836 5.1 209 100
Sex
Female 8828 24.4 82 37.4
Male 27351 75.6 137 62.6
Tumor site
Oral 23696 65.5 167 76.3
Larynx 10949 30.3 38 17.4
Nasal 882 2.4 12 5.5
Salivary 652 1.8 2 0.9
Grade
I 5482 15.1 23 10.5
II 18782 51.9 108 49.3
III 11609 32.1 84 38.4
IV 306 0.8 4 1.8
T status
T1 12821 35.4 46 21.0
T2 10873 30.1 59 26.9
T3 5438 15.0 82 37.4
T4 7047 19.5 32 14.6
N status
N0 19173 53.0 96 43.8
N1 5680 15.7 58 26.5
N2 10389 28.7 36 16.4
N3 937 2.6 29 13.2
M status
M0 35152 97.2 207 94.5
M1 1027 2.8 12 5.5
Surgery
Performed 18977 52.5 209 100
None 17202 47.5 0 0
Radiotherapy
Performed 25852 71.5 153 69.9
None 10327 28.5 66 30.1
Outcome
Alive 22323 61.7 131 59.8
CSM 9627 26.6 68 31.1
DROP 4229 11.7 20 9.1
Table 2: Univariate and multivariate analyses of OS in nomogram cohort
Varible Univariate AnalysisP value Multivariate AnalysisHR (95%CI) P value
Age, years <0.001
15-24 0.207 (0.128-0.335) <0.001
25-34 0.196 (0.155-0.248) <0.001
35-44 0.186 (0.166-0.210) <0.001
45-54 0.232 (0.215-0.251) <0.001
55-64 0.283 (0.263-0.304) <0.001
65-74 0.383 (0.356-0.412) <0.001
75-84 0.622 (0.577-0.671) <0.001
85+ Reference
Race <0.001
White Reference
Black 1.375 (1.310-1.443) <0.001
Others 0.870 (0.803-0.942) <0.001
Sex 0.002
Female 1.063 (1.022-1.106) <0.001
Male Reference
Tumor site <0.001
Oral 1.054 (0.940-1.182) 0.103
Larynx 1.122 (0.989-1.151) 0.077
Nasal 1.316 (1.133-1.529) <0.001
Salivary Reference
Differentiation Grade <0.001
I 0.822 (0.687-0.984) 0.033
II 1.040 (0.874-1.236) 0.661
III 0.954 (0.802-1.135) 0.599
V Reference
T status <0.001
T1 0.348 (0.331-0.366) <0.001
T2 0.522 (0.499-0.545) <0.001
T3 0.766 (0.729-0.805) <0.001
T4 Reference
N status <0.001
N0 0.326 (0.310-0.343) <0.001
N1 0.521 (0.498-0.545) <0.001
N2 0.756 (0.719-0.794) <0.001
N3 Reference
M status <0.001
M0 0.434 (0.402-0.467) <0.001
M1 Reference
Surgery <0.001
Performed 0.632 (0.608-0.656) <0.001
None Reference
Radiotherapy <0.001
Performed 0.613 (0.587-0.640) <0.001
None Reference
Table 3: Patients five- and eight-year cumulative incidences of death in nomogram cohort
Variable CSM5-year, % 8-year, % P value DROC5-year, % 8-year, % P value
All patients 31.0 34.9 13.4 20.2
Age, years <0.001 <0.001
15-24 19.8 29.5 7.6 7.6
25-34 23.8 23.8 2.6 2.6
35-44 23.4 26.1 4.1 5.5
45-54 28.2 31.7 7.4 11.6
55-64 30.1 34.0 11.2 17.2
65-74 31.9 36.7 15.5 24.9
75-84 37.2 41.1 23.5 34.9
85+ 42.6 44.3 35.0 46.7
Race <0.001 <0.001
White 29.5 33.3 13.3 20.3
Black 43.0 47.1 15.8 21.8
Others 29.5 34.4 9.2 15.3
Sex <0.001 0.527
Female 32.6 36.7 13.4 19.4
Male 30.5 34.3 13.4 20.5
Tumor site <0.001 <0.001
Oral 31.2 34.8 12.0 18.0
Larynx 30.2 34.8 15.5 23.6
Nasal 34.0 36.7 14.5 23.5
Salivary 33.1 35.3 23.3 35.3
Differentiation Grade <0.001 0.283
I 20.5 24.1 13.1 21.5
II 32.3 36.1 13.8 20.5
III 33.9 38.0 12.7 19.1
V 33.3 41.1 14.2 21.6
T status <0.001 0.070
T1 15.5 19.3 13.3 21.5
T2 30.0 33.8 13.3 19.6
T3 42.7 46.7 14.3 21.7
T4 52.5 56.1 12.9 17.7
N status <0.001 <0.001
N0 22.8 26.9 15.5 24.2
N1 37.8 41.4 12.2 17.4
N2 41.2 45.2 10.4 14.5
N3 49.8 51.2 7.7 12.4
M status <0.001 <0.001
M0 29.7 33.6 13.5 20.6
M1 75.9 79.0 8.1 8.5
Surgery <0.001 <0.001
Performed 38.7 42.9 14.0 20.1
None 24.1 27.7 12.8 20.4
Radiotherapy <0.001 <0.001
Performed 32.5 36.7 12.8 19.4
None 27.3 30.4 14.8 22.4
identify and treat high-risk HNSCC patients are urgently needed. The decision to treat HNSCC surgically is made according to several factors, including age, pathologic features and tumor site, and a considerable number of patients (50% in our study) do not receive surgery. Radiotherapy, chemotherapy and chemoradiotherapy are frequently performed in HNSCC patients for whom surgery is not advised [19, 20]. As a large proportion of HNSCC patients do not receive surgery, it is very important to evaluate patient prognosis and accurately predict the effects of adjuvant therapy.
To ensure nomogram accuracy, we used Cox’s proportional hazards regression model and the number of AIC to obtain the factors used in developing the OS nomogram. We obtained the factors used in developing the CSS nomogram via a competing risks model. These clinicopathologic factors were then used to develop nomograms predicting five- and eight-year HNSCC patient OS and CSS. All nomogram C-indexes were more than 0.7 and there was excellent agreement between calibration curves and 45-degree perfect match straight lines.
Using a nomogram to predict patient survival is simple. First, to include every clinicopathological factor, a vertical line should be drawn from every factor to the “Points” line in nomogram. Then, the total points value is obtained, and a vertical line should be drawn from the “Total Points” line to the survival probability line to obtain the corresponding survival. For example, consider a 55-year-old male white patient with a T3N0M0 moderate-differentiated salivary squamous cell carcinoma who underwent both surgery and radiotherapy. Using nomograms, we estimate that he has an eight-year OS of 61% and an eight-year CSS of 76%. In addition, this
step can also be conducted by command “predict” of R program [21].
We also performed HNSCC prognostic analyses for OS and CSS. OS and CSS declined for patients older than 55 years. Among patients younger than 55 years old, those aged 35-44 had the best survival. Age was found to be an important prognostic factor in several studies [18, 19, 22], although the reason for this is currently unclear. The mortality rates of black HNSCC patients were higher than that of other races. A National Cancer Data Base (NCDB) study also showed that five-year survival for HNSCC patients was lower for African-Americans [23]. Accordingly we hypothesize that melanin might promote HNSCC growth in black patients, while no relevant study has been reported. Contrary to OS and CSM trends, DROC improved with increasing NM stage, indicating that NM stage influences HNSCC CSS.
Both five- and eight-year CSM of HNSCC patients who received radiotherapy (32.5% and 36.7%) were higher than those of patients without radiotherapy (27.3% and 30.4%), while DROC decreased with radiotherapy. On the contrary, radiotherapy improved HNSCC patient OS (P
[image:7.612.59.557.467.677.2]< 0.001). This may be because radiotherapy was primarily used to treat patients with higher-grade disease or those who could not receive surgery. In the training cohort, patients with a T3-T4 tumor (80.6%) or an N+ tumor (85.8%) received more radiotherapy than average (71.5%). Among patients who did not receive surgery, 87.7% had radiotherapy, as compared to only 56.5% of patients who did receive surgery. Excluding all patients treated surgically, the five- and eight-year CSMs of patients who received radiotherapy (34.4% and 39.1%) were improved compared with non-radiotherapy-treated patients (58.9%
Figure 3: External calibration plot for A., five- and B. eight-year OS and C. five- and D. eight-year CSS. The 45-degree straight line
and 61.5%). However, when patients who were not treated surgically were excluded, radiotherapy did not improve CSM, but did increase DROC. Thus, radiotherapy might decrease CSM in patients with higher-grade disease and in those for whom surgery is not advised.
Our results suggest that nomograms not only accurately estimate the effects of all independent factors on survival, but also clearly estimate the prognostic values of single factors when Cox’s or competing risks models fail. Although our nomograms were of high accuracy according to C-indexes and calibration plots, there are likely important independent prognostic factors that have not yet been identified by researchers or recorded by the SEER program, and these factors were not included in our study.
Our study had certain limitations. First, HNSCC TNM stage information was not available from the SEER program until 2004. The earliest record included in our study was diagnosed in that year, and we failed to predict a survival time longer than than eight years. Second, factors like human papillomavirus [24], perineural invasion [25] and chemotherapy [26] were associated with HNSCC prognosis, but were not recorded by the SEER program, and thus were not included in our nomograms. For the same reason, nomograms predicting loco-regional control or disease-free survival were not developed.
In conclusion, based on a large patient cohort from the SEER database, we conducted prognostic analyses and developed nomograms predicting five- and eight-year HNSCC patient OS and CSS with high accuracy. These nomograms could help clinicians tailor surgical, adjuvant therapeutic and follow-up strategies to more effectively treat HNSCC patients.
MATERIALS AND METHODS
Patient data collection
HNSCC patient data were collected from the SEER program of the National Cancer Institute (training cohort) [27] and a medical center (Department of Oral and Maxillofacial Surgery, School of Stomatology, Fourth Military Medical University, China, validation cohort). For data collected from the SEER program, initial selection criteria were as follows: The HNSCC primary tumor site was the oral cavity, pharynx, larynx, nose, nasal cavity or middle ear; malignant behavior; older than age 15; and diagnosed between 2004 and 2012. Final selection criteria were as follows: active follow-up; clinical and pathological information, including age, race, sex, tumor site, tumor grade, surgery, radiotherapy and TNM stage, were complete and definite; and data was collected not from an autopsy or death certificate. Patients were divided into several groups according to age (grouped by 10 years)
ranging from 15 to 84 years, with one group of patients over 85 years of age. Race classifications included white, black and others (American Indian/Alaska Native/Asian/ Pacific Islander). Tumor site classifications included salivary gland, larynx, oral cavity/pharynx and nose/nasal cavity/middle ear.
Prognostic analyses
Prognostic analysis was conducted according to the training cohort collected from the SEER database. Ten clinicopathologic factors, including age, race, sex, tumor site, tumor grade, surgery, radiotherapy and TNM stage, were used to conduct the analyses.
HNSCC patient OS
OS was defined as failure if a patient died, or censoring if a patient was alive at the last follow-up. OS length was defined as the time from diagnosis to failure or censoring. Log-rank test and Cox’s proportional hazards regression model were used to conduct the prognostic analysis, and factors with a P value less than 0.2 in univariate analyses were included in the multivariate analysis to obtain independent HNSCC OS factors (P < 0.05) [28].
HNSCC patient CSS
CSS was defined as failure if a patient died due to HNSCC, or censoring if a patient was alive at the last follow-up or dead due to other reasons. CSS length was defined as the time from diagnosis to failure or censoring. Gray’s test and competing risks model were applied to conduct the competing risks prognostic analysis and obtain CIFs for different category groups [29]. Cutoff of time was 5 and 8 years. Categories with a P value less than 0.05 were considered as independent HNSCC CSS factors.
SPSS version 19.0 (SPSS, Chicago, IL, USA) was used to conduct OS prognostic analysis. R version 3.2.4 software (Institute for Statistics and Mathematics, Vienna, Austria; www.r-project.org) was used to conduct CSS prognostic analysis.
Nomogram development
The Akaike Information Criterion (AIC) [30] was obtained
via the above-mentioned commands, and the combinations of factors with the smallest number of AIC were used as the models to develop nomograms predicting five- and eight-year HNSCC patient OS [31]. Independent CSS factors obtained via competing risks model were used to develop nomograms predicting five- and eight-year HNSCC patient CSS. R version 3.2.4 software was used to develop nomograms.
Nomogram validation
Nomogram validations were conducted both internally (training cohort) and externally (validation cohort) by two methods, C-index and calibration plot. 1000 times bootstrapping and ten-fold cross-validation was used in internal and external validations, respectively. A C-index is an index of probability of concordance between predicted and actual situations, ranging from 0.5 to 1.0 (perfect agreement). A Calibration plot is a graph consisting of two curves, a 45-degree straight line (perfect match) and an irregular curve (calibration curve). Distance from the irregular curve to the straight line is proportional to nomogram accuracy. C-index and calibration plot were obtained by R software via the “rcorrcens” and “calibrate” commands, respectively.
Ethics statement
Our study was approved by the Fourth Military Medical University Ethical Committee. Informed patient consent was not required for data released by the SEER database.
ACKNOWLEDGMENTS
We express our deepest gratitude to Xinghua Ma (School of Mathematics & Computational Science, Sun Yat-sen University) for providing expert guidance and advice on the application of R software.
CONFLICTS OF INTEREST
The authors declare no conflicts of interest.
GRANT SUPPORT
This work was supported by grants from the National Natural Science Foundation of China (30772428).
REFERENCES
1. Marur S, Forastiere AA. Head and neck squamous cell carcinoma: update on epidemiology, diagnosis, and
treatment. Mayo Clin Proc. 2016; 91: 386-396.
2. Torre LA, Bray F, Siegel RL, Ferlay J, Lortet-Tieulent J, Jemal A. Global cancer statistics, 2012. CA Cancer J Clin. 2015; 65: 87-108.
3. Siegel RL, Miller KD, Jemal A. Cancer statistics, 2015. CA Cancer J Clin. 2015; 65: 5-29.
4. Ang KK, Harris J, Wheeler R. Human papillomavirus and survival of patients with oropharyngeal cancer. N Engl J Med. 2010; 363: 24-35.
5. Cmelak A, Li S, Marur S. E1308: Reduced-dose IMRT in human papilloma virus (HPV)-associated resectable oropharyngeal squamous carcinomas (OPSCC) after clinical complete response (cCR) to induction chemotherapy (IC). J Clin Oncol. 2014; 32: 5s. Abstract LBA6006.
6. Argiris A, Brockstein BE, Haraf DJ, Stenson KM, Mittal BB, Kies MS, Rosen FR, Jovanovic B, Vokes EE. Competing causes of death and second primary tumors in
patients with locoregionally advanced head and neck cancer
treated with chemoradiotherapy. Clin Cancer Res. 2004; 10: 1956-1562.
7. Adelstein DJ, Li Y, Adams GL, Li Y, Adams GL, Wagner H Jr, Kish JA, Ensley JF, Schuller DE, Forastiere AA. An intergroup phase III comparison of standard radiation therapy and two schedules of concurrent chemoradiotherapy
in patients with unresectable squamous cell head and neck
cancer. J Clin Oncol. 2003; 21: 92-98.
8. Pfister DG, Spencer S, Brizel DM, Burtness B, Busse PM, Caudell JJ, Cmelak AJ1, Colevas AD, Dunphy F, Eisele DW, Foote RL, Gilbert J, Gillison ML, et al. Head and Neck Cancers, Version 1.2015. J Natl Compr Canc Netw. 2015; 13: 847-855.
9. Edge SB, Compton CC. The american joint committee on cancer: the 7th edition of the AJCC Cancer Staging Manual and the future of TNM. Ann Surg Oncol. 2010; 17: 1471e4. 10. Awad MI, Palmer FL, Kou L, Yu C, Montero PH,
Shuman AG, Ganly I, Shah JP1, Kattan MW, Patel SG. Individualized risk estimation for postoperative complications after surgery for oral cavity cancer. JAMA Otolaryngol Head Neck Surg. 2015; 141: 960-968. 11. Schwam ZG, Judson BL. Improved prognosis for patients
with oral cavity squamous cell carcinoma: Analysis of the National Cancer Database 1998-2006. Oral Oncol. 2016; 52: 45-51.
12. Fakhry C, Westra WH, Li S, Cmelak A, Ridge JA, Pinto H, Forastiere A, Gillison ML. Improved survival of
patients with human papillomavirus-positive head and neck
squamous cell carcinoma in a prospective clinical trial. J Natl Cancer Inst. 2008; 100: 261-269.
13. Hocwald E, Korkmaz H, Yoo GH, Adsay V, Shibuya TY, Abrams J, Jacobs JR. Prognostic factors in major salivary gland cancer. Laryngoscope. 2001; 8: 1434-1439.
cancer using the national cancer registry. Oncotarget. 2016; doi: 10.18632/oncotarget.8221.
15. Ganly I, Amit M, Kou L, Palmer FL, Migliacci J, Katabi N, Yu C, Kattan MW, Binenbaum Y, Sharma K, Naomi R, Abib A, Miles B, et al. Nomograms for predicting survival
and recurrence in patients with adenoid cystic carcinoma.
An international collaborative study. Euro J Cancer. 2015; 51: 2768-2776.
16. Wen J, Ye F, He X, Li S, Huang X, Xiao X, Xie X. Development and validation of a prognostic nomogram based on the log odds of positive lymph nodes (LODDS) for breast cancer. Oncotarget. 2016; doi: 10.18632/
oncotarget.8091.
17. Kawachi MH, Bahnson RR, Barry M, Busby JE, Carroll PR, Carter HB, Catalona WJ, Cookson MS, Epstein JI, Etzioni RB, Giri VN, Hemstreet GP 3rd, Howe RJ, et al. NCCN clinical practice guidelines in oncology: prostate cancer early detection. J Natl Compr Cancer Netw. 2010; 8: 240e62.
18. Shen W, Sakamoto N, Yang L. Cancer-Specific mortality
and competing mortality in patients with head and neck
squamous cell carcinoma: a competing risks analysis. Ann Surg Oncol. 2015; 22: 264-271.
19. Bonner JA, Harari PM, Giralt J, Cohen RB, Jones CU, Sur RK, Raben D, Baselga J, Spencer SA, Zhu J, Youssoufian H, Rowinsky EK, Ang KK. Radiotherapy plus cetuximab for locoregionally advanced head and neck cancer: 5-year survival data from a phase 3 randomised trial, and relation
between cetuximab-induced rash and survival [published
correction appears in Lancet Oncol. 2010; 11: 14]. Lancet Oncol. 2010; 11: 21-28.
20. Pignon JP, Bourhis J, Domenge C, Designé L; MACH-NC
Collaborative Group. Chemotherapy added to locoregional
treatment for head and neck squamous-cell carcinoma: three meta-analyses of updated individual data. Lancet. 2000; 355: 949-955.
21. Frank Harrell. Predict: Compute predicted values and confidence limits. Package ‘rms’. Https://cran.r-project.org/
web/packages/rms/rms.pdf: 132-137.
22. Skillington SA, Kallogjeri D, Lewis JS. Prognostic importance of comorbidity and the association between comorbidity and p16 in oropharyngeal squamous cell carcinoma. JAMA Otolaryngol Head Neck Surg. 2016; doi: 10.1001/jamaoto.2016.0347.
23. F unk GF, Karnell LH, Robinson RA, Zhen WK, Trask DK, Hoffman HT. Presentation, treatment, and outcome of oral cavity cancer: a National Cancer Data Base report. Head Neck. 2002; 24: 165-180.
24. Marchiano E, Patel TD, Eloy JA. Impact of nodal level
distribution on survival in oral cavity squamous cell
carcinoma: a population-based study. Otolaryngol Head Neck Surg. 2016; pii: 0194599816636356.
25. Gillison ML, Broutian T, Pickard RK, Tong ZY, Xiao W, Kahle L, Graubard BI, Chaturvedi AK. Prevalence of oral HPV infection in the United States, 2009-2010. JAMA. 2012; 307: 693-703.
26. Sakamoto Y, Matsushita Y, Yamada S. Risk factors of
distant metastasis in patients with squamous cell carcinoma
of the oral cavity. Oral Surg Oral Med Oral Pathol Oral Radiol. 2016; 121: 474-480.
27. National Cancer Institude: Surveillance, Epidemiology, and End Results Program. http://seer.cancer.gov.
28. Hosmer D, Lemeshow S. Applied survival analysis: regression modeling of time to event data. New York: John Wiley & Sons. 1991;159.
29. Wolbers M, Koller MT, Witteman JCM, Steyerberg EW. Prognostic models with competing risks: methods and application to coronary risk prediction. epidemiology. 2009; 20: 555-561.
30. Ludden TM, Beal SL, Sheiner LB. Comparison of the Akaike Information Criterion, the schwarz criterion and the F test as guides to model selection. J Pharmacokinet Biopharm. 1994; 22: 431-445.
31. Harrell FE Jr: Regression modeling strategies with
applications to linear models, logistic regression, and