Product change
Process change
Fig-1: Manufacturing strategies for change [1]
Dynamic Product and Process Change: Innovation Strategy
The focus of innovation strategy is to frequently create small volumes of new products, while constantly innovating the processes required to develop and produce them.
Stable Product and Process Change: Mass Production Strategy
This strategy permits to standardize products, centralize decision-making, routinise work and reward, develop and enforce standard rules and procedures, and allocate work to
1
M.Tech., Industrial and Production Engineering Department, Vishwakarma Institute of Technology, Pune
3Abstract -
In practice, small improvements (kaizen, continuous improvement) and large improvements (process reengineering) always complement each other. To effect any such improvements to enhance the effectiveness of aInternational Research Journal of Engineering and Technology (IRJET)
e-ISSN: 2395 -0056Volume: 03 Issue: 07 | July-2016 www.irjet.net p-ISSN: 2395-0072
Improving Productivity on a Grinding Line through ‘Small & Large’
Improvements
Amit S. Gangaramani
1, Amit D. Shaha
2, Prof. (Dr.) Ganesh G. Dongre
3M.Tech., Industrial and Production Engineering Department, Vishwakarma Institute of Technology, Pune,
2
Professor, Industrial and Production Engineering Department, Vishwakarma Institute of Technology, Pune,
Maharashtra, India
---***---
were proposed. Thus, this work addressed a full-fledged productivity improvement project in its entirety on the guidelines of International Labour Office (ILO), Geneva.
process/system, it is usually recommended to begin with
1.1 Literature Review
streamlining the processes (small improvements - to reap thatlow hanging fruits first) followed with rapid improvements According to the book World Class Manufacturing[1], most (process reengineering). This work is also the manifestation of manufacturing companies are now experiencing rapid and the above principle. It proposes a systematic procedure in continuous change in their business environment, which can enhancing the productivity of a grinding line by initially be identified in terms of product change and/or in terms of optimizing the present process through minor improvements. process change (Luftman 1996). These two types of change This was followed with a radical change proposed in the form can be classified as either stable or dynamic. Stable change is of new tooling design. Sustenance of improvements can be slow, evolutionary and generally predictable, while dynamic ensured through standardized work. The improvements change is rapid, often revolutionary and generally effected were implemented with the help of standard unpredictable. Taken together, these two types of changes operating procedures (SOPs). Thus, this work addresses a full- provide a matrix of four possible combinations of 'change fledged productivity improvement work in its entirety conditions' that can confront an organization. The matrix supplemented by guidelines of International Labour Office combinations and the relevant manufacturing strategies are
(ILO), Geneva. described below in fig 1.
Key Words: Kaizen, Flow Process Chart, Overall Equipment Effectiveness, International Labour Office, Maynard’s Operations Sequence Technique, Standardization, Multiple Activity Chart.
1. INTRODUCTION
Stage 1 of this paper attempts to address the continuous improvement strategy by taking care of the above principles. The paper also addresses the concept of Overall Equipment Effectiveness (OEE).
OEE is an internationally accepted measure of the effectiveness of a piece of equipment during planned production i.e. it measures how effective a piece of equipment is at adding value to the manufacturing process.
A particular “Theoretical Production Time‟ is divided into two components viz. the planned production time and the planned downtime. The “planned downtime‟ is strategically kept aside for mandatory activities like preventive maintenance, measurement, etc. The remaining „planned production time‟ has two more components in it viz. unplanned downtime e.g. equipment breakdown, setup/adjustment, etc. and the remaining time is the “gross operating time‟. But, due to working inefficiencies i.e. reduced working speed due to “unknown” reasons, minor “unavoidable” component of idle time, the “gross operating time‟ further shrinks and the remnant is termed as “net operating time‟. Further, if some nonconformities in the final product or service are detected then the time elapsed for operating on the prospective non-conforming product becomes a waste which is termed as “quality loss‟. And, the remainder is the “final operating time‟. Thus, intrinsically, actual effectiveness of particular equipment is much less than what is perceived extrinsically.
Fig-2: Concept of Overall Equipment Effectiveness [4]
It is calculated as a product of availability factor (A), performance factor (P) and Quality factor (Q) as shown in the figure (2). Losses such as equipment failure and setup/adjustment are taken care by the availability factor, losses such as idling/minor stops and reduced speed are taken care by the performance factor. And quality factor takes care of defects in process and start up losses. In this way, the actual effectiveness of equipment is calculated.
Availability factor dedicated, specialized jobs i.e. to mass-produce goods or
services.
Dynamic Product Change, Stable Process Change: Mass Customization Strategy
Organizations in a number of industries are facing customers making increasingly unique and unpredictable product demands. However, the basic processes that these companies are instituting to meet these demands soon evolve into identifiable patterns enabling them to build stable but flexible platforms of process capabilities.
Stable Product and Dynamic Process Change: Continuous Improvement Strategy
Continuous improvement is followed in some industries, such as automobiles and machine tools, where the nature of product demand is still relatively mature, stable, large and homogeneous. (In this paper, continuous improvement strategy is taken into consideration).
But the competition in the industries adopting this strategy is based on dynamic process terms, i.e. the organizations are competing by achieving constant improvement in process quality, speed and cost. The focus of organizations in these industries is on customer satisfaction through process improvement. As opposed to mass production firms, they are very customer- or market focused, striving to better satisfy the market as a whole through continuous process improvement. These organizations manage rapid innovation and the use of new process capabilities and, therefore, require systems and structures that facilitate long-term organizational learning about products but simultaneously achieving radical changes in the processes. To make process innovation efficient, these organizations employ cross- functional teams that collaborate to improve processes or plan for product enhancement. The members of these teams then turn to their function-specific work and execute the rules they just developed, accomplishing a sort of micro transformation. In this sense, the teams of continuous improvement firms need to be as process-innovative as 'invention' organizations, and as process-efficient as 'mass production' firms.
Fig - 3: Details of the grinding line
The grinding line had 5 stations viz. manual loading station, grinding station, washing station, drying station and manual unloading station. All the stations were connected by two conveyors viz. grinding conveyor and washing conveyor as shown in the fig 3.
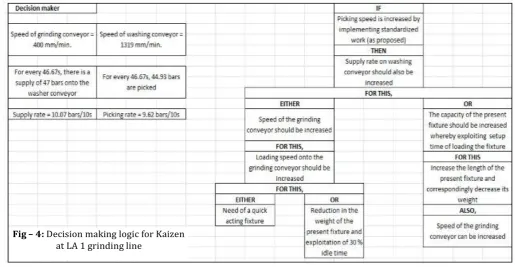
The speed of the grinding conveyor i.e. grinding feed was found to be 400 mm/min and the speed of the washing conveyor was 1319 mm/min. From time study through video analysis, it was revealed that for every 46.67s, there was a supply of 47 bars from grinding conveyor onto the washer conveyor (for every 46.67s, the bars come in a batch of 47). On the other hand, at the unloading side, for every 46.67s, 44.93 bars were picked. Thus, the supply rate was 10.07 bars/10s and the picking rate was 9.62 bars/10s. Thus, if picking speed was increased by implementing the Kaizen proposed in the paper then it was inferred that the supply rate from the grinding conveyor to the washing conveyor should also be increased. For this, either speed of the grinding conveyor should be increased or the capacity (no. of ferrite bars) of the present fixture which is used for length grinding should be increased. The present capacity was 47 bars. For increasing the speed of the grinding conveyor, it was inferred that the speed of loading
International Research Journal of Engineering and Technology (IRJET)
e-ISSN: 2395 -0056Volume: 03 Issue: 07 | July-2016 www.irjet.net p-ISSN: 2395-0072
= (planned production time – downtime)/planned would get processed through the grinding chamber. production time
2.1 Rationale for increasing grinding feed
Performance factor= (theoretical cycle time * processed no. of units)/gross operating time
Quality factor
= (processed no. of units – defective units)/processed no. of units.
In the stage 2 of this paper, the OEE of the grinding machine is enhanced by working on the performance factor, specifically by working the “reduced speed‟ loss.
Thus, this paper addresses the continuous improvement strategy in the form of “small‟ improvements by using core Industrial Engineering “pearls‟ such as method study, setup time optimization, standardization and Kaizen. On the other hand, “large‟ improvements are addressed in the form of enhancement of the overall equipment effectiveness (OEE) and change in the conceptual design in the fixture.
2. METHODOLOGY
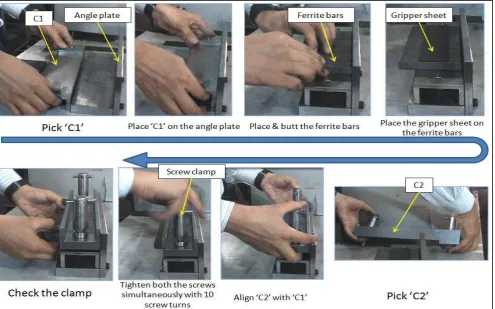
[image:3.595.43.559.495.762.2]A grinding machine, at a grinding shop, was used for maintaining the specified length of the ferrite bar (the product). It was a single spindle machine with a grinding feed around 400mm/min. As the machine proved to be a bottleneck, it was attempted to execute a productivity improvement project for the same. The machine involved use of a fixture which used to be loaded with ferrite bars and
grinding productivity of the machine i.e. the grinding feed. At last, stage 3 took care of increasing the manual working productivity of unloading activity i.e. the manual picking activity.
3. RESULTS AND DISCUSSION
3.1. Stage 1: Optimum utilization of the setup time of the loading fixture
3.1.1 Summary:
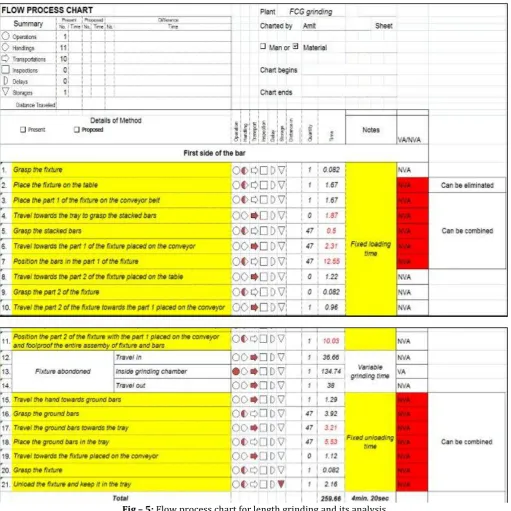
From the flow process chart (fig – 5) of the loading activity, it was revealed that the time required for some work elements (which was manual) should be increased. For this, the
weight of the present loading fixture should be reduced or fixture should be made quick-acting. On the other hand, to increase the capacity of the present fixture, it was required that the length of the fixture should be increased by corresponding decrease in the weight.
[image:4.595.41.553.261.772.2]Consider the following decision making logic for the Kaizen proposed in the work for the grinding line as shown in fig - 4. Thus, the entire work was executed in 3 stages. Stage 1 took care of the manufacturing losses which involved optimum utilization of the setup time and reduction in air-cutting time i.e. optimal increase in the capacity of the present fixture per setup. On the other hand, stage 2 aspired for increase in the
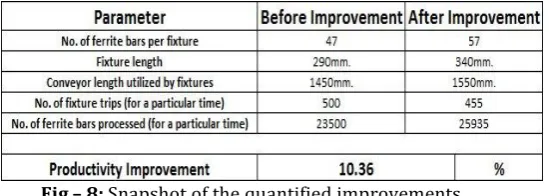
leading to operator fatigue. Also, in the flow process chart (fig - 5), it was pointed out that the activities 3 to 7 and 15 to 21, which were non-value adding activities, could be combined by providing a magnetic surface to any one part of the fixture. The change in the fixture design was accepted. The fixture, presently, is in use. Fig.-8 shows the snapshot of the productivity improvement calculations:
[image:5.595.308.583.216.314.2]3.1.2 Results
Fig – 8: Snapshot of the quantified improvements
3.2 Stage 2: Increase in the Overall Equipment Effectiveness (OEE) of the machine
As discussed earlier that the OEE of the machine considered was enhanced by increasing the performance factor of the machine, specifically by working on the “reduced speed‟ loss. This was done by changing the design of the fixture in order to increase the grinding feed of the machine.
3.2.1 Principle
According to a book published by International Labour Office (ILO) [5], Geneva named 'Introduction to Work Study', Decoupling of worker/machine systems, that is, freedom from being tied to a machine during the entire working day can lead to 3 specific results:
1) Elimination of waiting time/slow speed of the machine because an operative works at a different speed from the overall speed of the technical process. 2) Elimination of waiting time of the operative because he/she is forced to wait while a machine does its part of the work. 3) Increased job satisfaction.
3.2.2 Present case
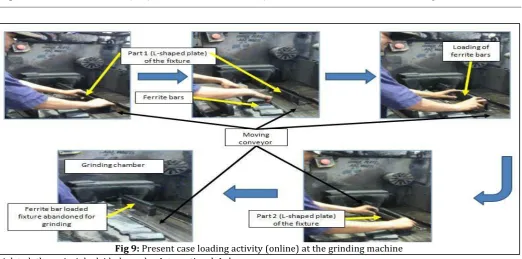
With reference to this principle, design of the fixture was required to be changed. In the present case, the loading activity at the grinding machine was online i.e. the loading activity was done on a moving conveyor. This can be seen in the figure (9) and its flow process chart in the figure (5). As a result, the speed of the moving conveyor was driven by the speed of manual loading activity i.e. the speed of the conveyor was bound to be kept slow in order to match with the manual loading activity speed. And the speed of the conveyor was nothing but the grinding feed of the machine. This hampered the grinding productivity of the machine. On the operator’s side (both loading and unloading operator), it resulted fatigue, as the operator had to match with the “legitimately” designed machine speed and moreover was continuously tied with the machine. This
International Research Journal of Engineering and Technology (IRJET)
e-ISSN: 2395 -0056Volume: 03 Issue: 07 | July-2016 www.irjet.net p-ISSN: 2395-0072
(motions) was the function of total number of ferrite bars. This could be termed as 'variable activity time'. Remaining work elements represented the 'fixed activity time'. Thus, the total loading activity was the sum of the 'variable activity time' and 'fixed activity time'. In the present case, 47 ferrite bars were loaded in the fixture. Thus, in the proposed case, if this number was increased then the fixed time for loading and unloading activities could be exploited.
Fig - 5 (flow process chart) explains the actual loading activity for length grinding at the line. From the flow process chart, it was revealed that the time of the activities 12, 13 and 14 were the function of total number of ferrite bars. The other activities were fixed to some extent. In the present case, 47 bars were loaded in the fixture. It was inferred that if this number was increased then the fixed time of loading and unloading could be exploited.
This is explained by the following example.
Fig - 6 shows the length grinding time of a single set of 47 bars. The 'fixed time for length grinding' is the sum of all the yellow colored cells in the flow process chart.
'Variable time for length grinding (per bar)' = Variable grinding time/47.
Thus, the total time = 'Fixed time for length grinding' + 'Variable time for length grinding*47'.
[image:5.595.40.283.509.680.2]The total time, as shown in fig - 6, matches with that of the flow process chart. On the contrary, as shown in the figure 7, if 84 ferrite bars were to be processed in the same setup then the total time would be 424.476s. But, in the present case, to process 84 bars, two setups were required and hence the total time was 519.282s. (259.641*2) Thus, the difference can be detected.
Fig-6: Snapshot of the calculations for total cycle time of 47 bars
Fig-7: Snapshot of the calculations for total cycle time of 84 bars (exaggerated case)
Fig-11: Snapshot of the iteration 1 of the concept generation process
[image:6.595.38.561.76.335.2]Fig-12: Snapshot of the iteration 2 of the concept generation process
Fig 9: Present case loading activity (online) at the grinding machine violated the principle laid down by International Labour
Office.
3.2.3 Need
Thus, it was required to convert the online loading activity into offline. This would make the provision to increase the grinding feed of the machine by deploying an extra fixture loader (if required). Thus, there would be an added provision of incremental capacity escalation in the machine. Also, this would increase the job satisfaction on the personnel side.
3.2.4 Proposed Case
It was argued with the shop floor manager as to why the loading activity can’t be made offline with the present fixture? It was answered that as the present fixture set has a structure which is open from the bottom, the ferrite bars would fall during the travel of the loaded fixture from the loading table to the conveyor. Thus, the fixture design needed to be changed.
The fixture design procedure went through exhaustive iterations which are as shown in the figures 10 to 15.
International Research Journal of Engineering and Technology (IRJET)
e-ISSN: 2395 -0056Volume: 03 Issue: 07 | July-2016 www.irjet.net p-ISSN: 2395-0072
[image:7.595.27.565.48.383.2]Fig - 13: Snapshot of the iteration 3 of the concept generation process
Fig - 15: Snapshot of the iteration 5 of the concept generation process
The newly designed fixture converted the online loading activity (i.e. loading activity on a conveyor) into an offline activity. The proposed offline activity is as shown in figure 16. Thus, this decoupled the worker/machine system and allowed an increase in the grinding feed (i.e. grinding conveyor speed) which was previously dependent on the speed on manual loading activity. This was already being followed at another 2-spindle length grinding machine with Fig - 14: Snapshot of the iteration 4 of the concept a conveyor speed of 630mm/min. Thus, potentially, it was generation process proposed that the speed of the grinding conveyor could be
[image:7.595.302.562.62.253.2]increased from 400 mm/min to 630 mm/min.
[image:7.595.53.549.413.722.2]Fig 17: Snapshot for ‘normal time’ calculations
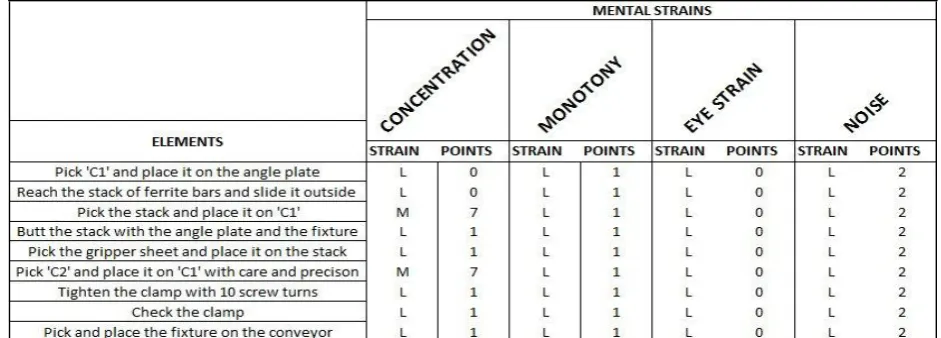
Fig 18: Snapshot for ‘physical strains’ of work elements
[image:8.595.61.532.575.744.2]3.2.5 Result
As shown in the table (1), with the new fixture design and loading activity, the grinding machine could be subjected to incremental escalation of its feed and thus it’s OEE. The new design of the loading fixture and the new loading sequence was taken into consideration. Trails were conducted and found to be satisfactory as shown in the figure 22. Some more changes were suggested by the shop floor manager which was required to be addressed before bringing the new fixture and sequence into mass production.
Table 1: Proposed incremental changes in grinding feed at the grinding machine
Before After Reduction in grinding time
(per ferrite bar) Grinding Grinding time Grinding Grinding time
feed (per ferrite bar) feed (per ferrite bar)
400 =(ferrite bar 450 =(ferrite bar 11.11% thickness)/400 thickness)/450
400 =(ferrite bar 500 =(ferrite bar 20% thickness)/400 thickness)/500
400 =(ferrite bar 550 =(ferrite bar 27.27% thickness)/400 thickness)/550
400 =(ferrite bar 630 =(ferrite bar 36.51% thickness)/400 thickness)/630
International Research Journal of Engineering and Technology (IRJET)
e-ISSN: 2395 -0056 [image:9.595.45.552.63.500.2]Volume: 03 Issue: 07 | July-2016 www.irjet.net p-ISSN: 2395-0072
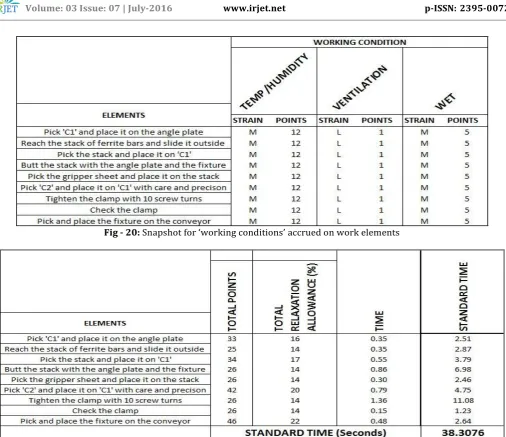
Fig - 20: Snapshot for ‘working conditions’ accrued on work elements
Fig - 21: Snapshot for ‘standard time’ calculations
[image:9.595.37.275.538.618.2]The newly designed fixture travelling on the conveyor
Fig - 22: Proposed fixture in working condition
(speed of both the conveyors) was dependent on the speed of the manual loading and unloading activity of the ferrite bars. If the manual loading/unloading speed is increased then it was inferred that the feed could be increased. This stage includes increase in manual unloading speed by standardization and change in the method of working.
3.3.1 Present case
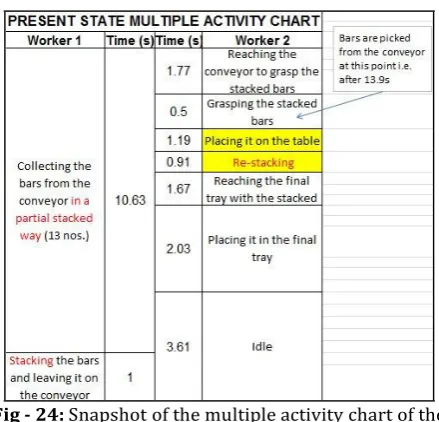
[image:10.595.385.479.297.432.2]The present unloading activity is shown in figure 23 and its analysis using Multiple Activity Chart is shown in the figure 24. As revealed from the multiple activity chart, worker 1 was loaded with the time-consuming task of “stacking‟ which was repeated in the subsequent period. Due to this time-consuming task for worker 1, the washing conveyor was not emptied before 13.9 s. On the contrary, worker 2 had an idle time of 3.61s.
Fig - 23: Present case unloading activity
Fig - 24: Snapshot of the multiple activity chart of the present case unloading activity
3.3.2 Proposed case
The future multiple activity chart for the proposed unloading activity is shown in figure 26 and its trial snapshot is as shown in the figure 25. As shown in the future state multiple activity chart, the conveyor was emptied within 7.34s unlike 13.9s in the present state multiple activity chart. Thus, the unloading speed of the worker 1 was increased by 47% OEE enhancement calculations:
With old fixture design, the OEE was given by: OEE1=A1*P1*Q1
(Where, A1 = Availability factor with old design, P1 = Performance factor with old design, Q1 = Quality factor with old design)
With new fixture design, the OEE was given by: OEE2=A2*P2*Q2
(Where, A2 = Availability factor with new design, P2 = Performance factor with new design, Q2 = Quality factor with new design)
Percentage enhancement in OEE was given by:
%( ∆OEE) = [(OEE2 – OEE1)/OEE1] = [(A2*P2*Q2 – A1*P1*Q1)/ (A1*P1*Q1)]
Now, since there is no change in the availability factor i.e. A1 = A2, and there is no change in the quality factor i.e. Q1 = Q2 thus:
%( ∆OEE) = [(P2 – P1)/P1] = [(TCT2*PU2/GOT2) – (TCT1*PU1/GOT1)]/ (TCT1*PU1/GOT1)
(Where, TCT2 & TCT1 = Theoretical cycle time with new & old fixture respectively, PU2 & PU1 = Processes units with new & old fixture respectively, GOT2 & GOT1 = Gross operating time with new & old fixture respectively)
Here, the processed units is considered to be 1 fixture (47 ferrite bars), i.e. PU2 = PU1. Also, since there is change in the theoretical cycle time i.e. grinding feed only and not in the gross operating time, thus:
%( ∆OEE) = [(TCT2 – TCT1)/TCT1]
Now, with the grinding feed of 400 mm/min, TCT1 for processing one fixture of 340 mm length was 340/400 = 0.85 minutes = 51 seconds.
With, potential grinding feed of 630 mm/min, TCT2 for processing one fixture of 340 mm length was 340/630 = 0.54 minutes = 32 seconds.
Thus, %( ∆OEE) = (32 – 51)/51 = 37.25 %.
Thus, with this “large‟ improvement, the Overall Equipment Effectiveness (OEE) of LA1 grinding machine was increased by 37.25%.
3.3 Stage 3: Standardization and alteration of the working method by methods engineering
[image:10.595.324.544.452.663.2]In the proposed method, the attempt was to reduce the variety of work for worker 1 thus reducing his/her cycle so that he/she can return to the conveyor at a high frequency and unload the conveyor at a faster rate. The idle time of worker 2 is transferred to worker 1. This idle time can be utilized to pick more number of ferrite bars if the feed is increased in the near future. The proposal went through many trials. Also, during the trials, minor changes such as modification in the tray 1 was done so as to prevent the ferrite bars from getting collected haphazardly.
[image:11.595.37.287.413.610.2]Fig - 25: Proposed case unloading activity
Fig – 26: Snapshot of the multiple activity chart of the proposed case unloading activity
4. CONCLUDING REMARKS
Thus, stage 1 increased the productivity by addressing the losses in the system; stage 2 increased the productivity by
International Research Journal of Engineering and Technology (IRJET)
e-ISSN: 2395 -0056Volume: 03 Issue: 07 | July-2016 www.irjet.net p-ISSN: 2395-0072
making a radical change in the system i.e. by increasing the pace of the machine. In order to cop up with proposed increased grinding feed at the unloading end, stage 3 was proposed.
In a nut shell, this paper initially streamlines the process by ironing out the sub-optimal situations by increasing just the length of the present fixture. Then, on the principles of Lean SixSigma, after ironing out the losses (wastes), radical changes in the form of enhancement of overall equipment effectiveness (OEE) was done. Then, some new working methodologies were proposed.
REFERENCES
[1] Richard Schonberger, World Class Manufacturing. [2] Laura Costa Maia et al, How could the TRIZ tool help
continuous improvement efforts of the companies? Procedia Engineering 131 ( 2015 ) 343 – 351
[3] Denis A. Coelho, Matching TRIZ engineering parameters to human factors issues in manufacturing, WSEAS Transactions on Business and Economics, ISSN: 1109- 9526 Issue 11, Volume 6, November 2009.
[4] Francis Wauters and Jean Mathot, Overall Equipment Effectiveness.
[5] Introduction to Work Study by ILO, ISBN 978-81-204- 1718-2, Oxford & IBH Publishing Company, New Delhi, Second Indian Adaptation, 2008