THE QUALITY DETERMINATION OF COCONUT WOOD
DENSITY USING LEARNING VECTOR QUANTIZATION
1IGN. NGESTI YUWONO, 2RICARDUS ANGGI PRAMUNENDAR, 3PULUNG NURTANTIO
ANDONO, 4RN. AMONG SUBANDI
1,4 Woodworking Technology Institution (PIKA-Semarang, Indonesia)
,2,3 Faculty of Computer Science, Postgraduate Program, Dian Nuswantoro University,
Semarang, Indonesia
E-mail:[email protected] , [email protected]
, [email protected] , [email protected]
ABSTRACT
Coconut wood is one of the wood species used in Indonesia as a material for furniture and building construction. Coconut wood quality in terms of strength and durability is determined by many factors, such as a vascullar bundle density pattern on the wood.
Currently the quality determination of coconut wood were done visually by the expert by looking at the pattern density vascullar bundle on coconut wood.
The coconut wood qualities visually were classified into patterns of low density, low quality coconut wood; patterns of medium density, medium quality coconut wood; patterns of high density, high quality coconut wood.
The classification of coconut wood density pattern could be done by applying intelligent technique, such as Learning Vector Quatization (LVQ). The LVQ model is a classification method thah uses a competitive supervised learning algorithm.
The experimental result showed that the accuracy was 65.7% with kappa value of 0.481. the obtained result had a sufficient congruence between assessment and appraisal target density using LVQ.
Keywords:CoconutWood Density, LVQ
1. INTRODUCTION
Coconut wood (cocos nucifera) are widely used for building construction materials. The strength of materials and decorative scheme of the coconut wood began revival as an alternative material for the manufacture of furniture[1].
In order to determine the quality of the wood is good for furniture products, some furniture industries require controlling the wood since the selection process up to ready-made products.
In general, the process of wood selection that used for raw materials of the products are doing manually using human inspection [2]. This method occurs a problem that will rely heavily on the expertise and experience of man who performs these inspections. This problem can be solved by applying digital image processing system, by making digital images of patterns of the coconut-wood with image processing, then these patterns are trained with LVQ algorithms.
Until the paper is written, similar research has not found that examines the determination of the
coconut wood quality. Image classification using LVQ method used by Supatman to detect the authenticity of dairy products by looking at the pattern of powdered milk [3]. Other research is the fingerprint pattern recognition using LVQ method conducted by Djalu Ranadi, Wawan Indarto and Taufik Hidayat [4]. Both the research became reference of this paper.
This research takes the pieces of wood obtained from the workshop production of PIKA Semarang, The pieces of wood transformed in digital form and then taken the wooden pattern. These patterns are trained using LVQ method to find out the quality of the wood seen from the pattern of the wood. The quality of the coconut wood had previously been determined by a competent expert in this field. As a comparison of the quality of the wood are also rated by 4 observers.
automatically and as a reference for further research
.
2. COCONUT WOOD
Parameters to determine the quality of coconut wood visually is as follows: Straight fibers showed minimal arc or spring form and density shows hardness is assessed from the fiber pattern (surface area fibers by total area)
Visual Grading coconut wood is determined by the pattern of the vascular bundle at the end of a wooden plank. It is very important to 'read' these patterns correctly. Coconut wood density is correlated with the pattern of the bundle.
Patterns bundle = surface area of the vascular bundle compared to the total surface area and patterns bundle = size + concentration (number of bundles per unit area) [5] [2].
Generally, visual grading on coconut wood is determined by the density of bundle (patterns) on the palm wood slivers per unit area. The more dense is the better quality of the wood. Another thing that makes the quality factor of coconut wood is the color and size of the bundle pattern, the larger size and darker color will result more good quality [5].
Generally the quality of coconut wood visually can be expressed as follows [5]:
• High Density 70%-90% (High density/HD): good quality
• Density Is 40%-70% (Medium density/MD): medium quality
• Low Density 10%-40% (Low density/LD): low quality
3. LEARNING VECTOR
QUANTIZATION (LVQ)
LVQ is a network which classify patterns so that each unit of output declared a class or category. Unit weights for output vector is often called a vector of references to classes declared by the unit. During training the unit output by finding his position to set up supervised training through does it weigh. In this case given the number of known patterns of interacting with the initial distribution of the reference vector. LVQ network after the training vector input in classifying the same class as the unit vector that
has output weight (reference) is closest to the input vector [6] [7].
The basic LVQ algorithm is the following [8]:
1) Initialize the codebook vectors W2 and the learning rate α
2) Randomly select an input vector X
3) Find the winner unit closest to the input vector (i.e. the codebook vector Wc with the smallest Euclidean distance with regard to the input vector X) :
||X-Wc|| = 𝑚𝑖𝑛
𝑘 ||X-Wk|| (1)
i.e
c = arg 𝑚𝑖𝑛
𝑘 ||X-Wk|| (2)
4) Modify the weights of the winner unit:
• If Wc and X belong to the same class (the classification has been correct)
Wc(t+1)=Wc(t)+α(t)[X(t)-Wc(t)]. (3)
• If Wc and X belong ti different classes (the classification has not been correct)
Wc(t+1)=Wc(t)-α(t)[X(t)-Wc(t)]. (4)
5) Reduce the learning rate α
6) Repeat from step 2 until the neural network is stabilized or until a fixed number of iterations have been carried out.
4. KAPPA CROSS TABULATION
Cohen's kappa (κ) is usually used for assessment of accuracy. For example, the kappa is useful to build a way to predict a different class or image classification. They help provide assessment of how accurate or useful this way. Kappa can be used as a measure of agreement between prediction and reality data or to determine if the values that are contained in the matrix of the error is the result of significantly better than a random. [9]
Kappa is formulated as :
𝛋
=
𝑁 ∑𝑟𝑖=𝑙𝑥𝑖𝑖−∑𝑟𝑖=𝑙(𝑥𝑖+×𝑥+𝑖)𝑁2−∑𝑟 (𝑥𝑖+×
N is the amount of data in the matrix, r is the number of rows in the matrix, is the number of rows in the xii i and column i, x + i is the total of lines i and + xi are the total for a column i.
Kappa assessment guidelines are [10]:
• kappa values> 0.75 good value congruence between rows and columns
• kappa value between 0.4 to 0.75 value sufficient congruence between the rows and columns
• The value of kappa <0.4 poor suitability values between rows and columns
[image:3.612.93.280.171.667.2]5. EXPERIMENTAL DESIGN
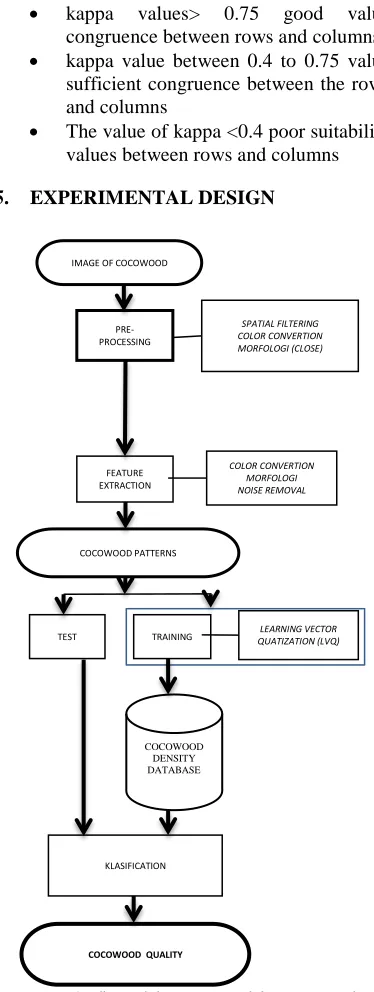
Figure 1 : flow of the process of determining the quality of coconut wood with LVQ method
Raw Data obtained from digitizing a piece of coconut wood, and then do the pre-processing on digital images. The process aims to improve the
quality of pre processing image data to be worthy of coconut wood processed at a next stage. Stages of the pre-processing of the image are spatial filtering, color coversion, noise removal and morphology. To get an image that contains only the pattern of vascular bundle then before the pre-processing is done, the necessary process of croping the image to get the desired wood pattern image.
At the next stage already acquired images done with feature extraction of color conversion and morphologically. From this data the expected stages can be processed on the next stage of the training data using methods of LVQ
Training and Testing Data
The first stage is the reading of the image, and because each of image size is different then the image croping of 256x 256 pixels, to specify the image pattern vascular bundle of wood.
Image croping process through different stages, namely:
1. The process of image segmentation with monochrome and color displays have a negative image.
2. Morphology in image processing is to analyze shapes in the image.
3. the Croping process necessary to take pictures only, in this case the image pattern of vascular bundle on coconut wood needed for the next process. Size croping specified for this research is 256 x 256 pixels, so that the obtained pattern:
Figure 2 : Coconut wood pattern image Data size of 256 x 256 pixels
5.1. Features Extraction
After getting an image of the pattern pieces of coconut wood then needs to improve the quality of image use:
IMAGE OF COCOWOOD
PRE-PROCESSING
COCOWOOD PATTERNS FEATURE EXTRACTION
TRAINING
COLOR CONVERTION MORFOLOGI NOISE REMOVAL
LEARNING VECTOR QUATIZATION (LVQ)
KLASIFICATION
COCOWOOD QUALITY
TEST
COCOWOOD DENSITY DATABASE
Change the color pattern of the coconut wood is obtained through the process of RGB to monochrome. Then do the conversion to binary image image with thresholding. This conversion is done with level 1-0 where a value of 1 for white and black, so the 0 to the resulting image is a black and white image instead of grayscale.
To reaffirm and clarify the patterns that have been retrieved from the previous phase of the necessary process of morphological dilation and erosion to erode binary image.
Figure 3 : Coconut wood pattern after erosion process
Coconut wood density according to expert assessment
Wood density assessment carried out by the experts with the physical look of a piece
of coconut
wood and coconut wood image cropping results. The assessment was performed by expert & 4 obsevers. They are competent in the field of coconut wood.
5.2. Experimental Result
In this training using 100 coconut wood pattern image data which consists of various density. Images of the vascular bundle pattern on the Palm woods are made a vector into a vector training. So the vector obtained from each image. These vectors are then made in a row vector of all 256 x 256 = 65536 vector
The vectors (x 1, x 2, x 3 ... xn) one line to be vectors for training. Determined also the T: categories of training vectors. There are 3 categories used for the training of high density = 3; medium density = 2 and low density = 1. Determination of the density of the target (Tc) to be trained in this process refers to the assessment conducted by one expert who is very competent in the field of coconut wood, the expert was Mr. Among Subandi as head of development and
timber industry and as an expert on coconut wood specialties.
From the results of the training can be concluded that the degree of match between the assessment made by LVQ algorithms to the assessment carried out by the expert shows 100% figure as such assessment is done by the method of LVQ can be said to be perfect.
Testing
In this testing using 70 image data coconut wood pattern consists of various levels of coconut wood density.
The stages of this testing using methods and algorithms that are in training with the determination of the density of the use an existing database on training has been done:
Generally the level of suitability on the quality of targets with the test results with LVQ shows percentage 65,71%
5.3. Accuracy Comparison of expert
Assessment and Target vs. training using LVQ method
The following is a recapitulation of the calculation accuracy of the assessment targets with the expert assessment and training using LVQ method.
From the table 1 it can be seen that the level of accuracy by using LVQ method is far better than the assessment of the observers in the field of coconut wood.
5.4. Accuracy comparison of the Testing
Target vs. expert and testing method using LVQ
The following is a recapitulation of the calculation accuracy of the assessment targets with the expert assessment and testing method using LVQ
From the table 2 it can be seen that the level of accuracy of testing using LVQ method still worse compared to the assessment of the expert & observers in the field of wood.
5.5. Accuracy
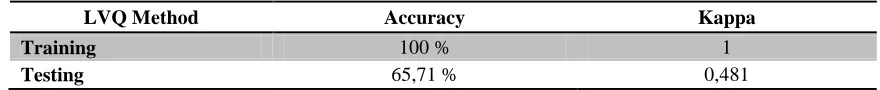
using LVQ method there is a significant difference as in the table 3:
Table 1 : Assessment of density and value of kappa
Assessment Compatibility level Kappa
Low Medium High TOTAL
Expert 37 % 32 % 31 % 100 % 1
Observer 1 21 % 22 % 31 % 74 % 0,614
Observer 2 26 % 19 % 26 % 71 % 0,566
Observer 3 23 % 25 % 24 % 72 % 0,583
Observer 4 23 % 22 % 27 % 72 % 0,583
LVQ Training 37 % 32 % 31 % 100 % 1
Table 2 : Assessment of density and value of kappa on testing
Assessment Compatibility level Kappa
Low Medium High TOTAL
Expert 41,4% 35,7% 22,9% 100% 1
Observer 1 21,4% 30% 21,4% 72,85% 0,595
Observer 2 31,4% 21,4% 20% 71,4% 0,589
Observer 3 28,6% 28,6% 14,3% 71,4% 0,561
Observer 4 25,7% 22,9% 21,4% 70% 0,550
LVQ Testing 18,6% 30% 17,1% 65,7% 0,481
Table 3 : A comparison of the fit and kappa on training and testing method using LVQ
LVQ Method Accuracy Kappa
Training 100 % 1
Testing 65,71 % 0,481
5.6. Discussion
Differences in the results occur because pieces of coconut wood image that is not perfect, so that the wood can not read the pattern. This is because: In the cut pieces of wood, knives used already dulled so arising strokes on the wood cross section.
There are smudges on the coconut pieces of wood so that the stains were read as a wooden pattern; The coconut Wood cut on the outside of the wood so that the grain of the wood fragment is read as coconut wood pattern;
Any defects of wood which is read as the coconut wood patterns for example there are cracks in the wood.
6. CONCLUSIONS
[image:5.612.89.529.445.490.2]exist, so that in the process of testing with LVQ coconut wood patterns becomes irregular.
Based on the results of the analysis and discussion on the research, there are some suggestions that might be made into a reference for the development of this research are: Development of research so that accuracy in testing could be improved by removing the other images outside of coconut wood pattern that we need. Development of research using a combination of several methods so expect could improve its accuracy by covering the deficiencies of these methods have been used.
REFERENCES
[1] Henri Bailleres et al., COCOWOOD PROCESSING MANUAL. Australian Government: Australian Centre for International Agricultural Research, 2004. [2] Arno Fruhwald, Rolf Peek Dieter, and
Matthias Schulte, Utilization of Coconut Timber from North Sulawesi, Indonesia. Hamburg, Federal Republic of Germany: Federal Research Centre for Forestry and Forest Products Institute of Wood Physics and Mechanical Technology Institute of Wood Biology and Wood Protection, 1992. [3] Supatman, "Identifikasi Tekstur Citra
Bubuk Susu Menggunakan Alihragam Gelombang Singkat Untuk Mendeteksi Keaslia Produk Susu," in Seminar on Intelligent Technology and Its Aplications, 2008, pp. 386-392.
[4] Djalu Ranadhi, Wawan Indarto, and Taufiq Hidayat, "Implementasi Learning Vector Quantization (LVQ) Untuk Mengenal Pola Sidik Jari Pada Sistem Informasi Narapidana LP Wirogunan," Media Informatika, vol. 4, pp. 51-65, Juni 2006. [5] Wulf Killmann and Dieter Fink, COCONUT
PALM STEM PROCESSING TECHNICAL HANDBOOK. Federal Republic of Germany: Potrade: Dept. Furniture and Wooden Products Deutsche Gesellschaft, 1996.
[6] Sri Kusumadewi, Artificial Intelligence, 1st ed. Yogyakarta: Graha Ilmu, 2003.
[7] Thomas Sri Widodo, Sistem Neuro Fuzzy untuk Pengolahan Informasi, Pemodelan, dan Kendali, 1st ed. Yogyakarta: Graha Ilmu, 2005.
[8] M.T. Martin Valdivia, L.A. Urena Lopez,
and M. Garcia Vega, "The Learning Vector quantization algorithm applied to automatic text classification tasks," ScienceDirect Neural Networks, vol. 20, no. ELSEVIER, pp. 748-756, 2007.
[9] RS/GIS Laboratories, "Kappa Tool User's Guide," Utah State University, 2003.