RECONSTRUCTION 4D OF BLOOD FLOW MR IMAGING ON
ABDOMINAL AORTIC ANEURYSMS WITH THROMBUS
SIGNAL
C. M. KARYATI1, S. WIDIYANTO1, S. MADENDA2, J. HARLAN3, A. B. MUTIARA4
1
Ass.Prof, Faculty of Computer Sciences and Information Technology, Gunadarma University, Indonesia 2
Prof., Faculty of Computer System, STMIK Jakarta STI&K, Indonesia. 3
Prof., Programm Study of Medical Informatics, Gunadarma University, Indonesia. 4
Prof.,Faculty of Computer Sciences and Information Technology, , Gunadarma University, Indonesia E-mail: 1,4{csyarah, sigitwidiyanto, [email protected]},
2
ABSTRACT
Cine MRI (amplitude image and phase contrast image) has been used to represent the blood flow velocity on the aortic aneurysm. Acquisition of images taken perpendicular to the abdominal aorta is done in free breathing and breath hold at the specified location as needed. Active Contour method or Snake (Deformable Model) has been used to perform automatic contour on amplitude image to detect the surface of the aorta and obtain the required parameter values. Furthermore, image reconstruction is performed on the object's surface from several slices of image segmentation that results with Scalar Volume Data technique (isosurface) in order to obtain the value of blood flow volume. The method has been developed and can represent animation of aortic aneurysm with blood flow velocity on each category of thrombus.
Keywords:Abdominal Aortic Aneurysm, Deformable Models, Scalar Volume Data, Blood Flow Velocity,
Blood Flow Volume
1. INTRODUCTION
Abdominal aortic aneurysm (AAA) is a dilation of the aorta that has reached over 50% of the normal diameter. AAA rupture risk is usually determined by the size of the diameter of the aorta. The prediction on the diagnosis of AAA in the next 5 years will be approximately 2% risk of rupture of AAA with diameter less than 4 cm and more than 25% on AAA with a diameter greater than 5 cm [1].
Clinical actions performed at this time for the big AAA (diameter>5.5cm) was surgery, while on the small AAA (diameter<=5.5 cm) the patients are monitored on a regular basis (every 6 months) with ultrasound, CT scan, MRI or other digital examination tools. Besides the size of the diameter, the other formal indication for surgery is if the evolution of the diameter is larger than 1 cm/year [2]. However, the surgeon still need to compare the risk of rupture with the risk improvement, especially since it was reported that only 25% from patient of AAA repair with surgery can last the life [3]. It is also possible due to the occurrence of serious complications after open repair of the aorta or after endovascular aneurysm repair.
on biomechanics and numerical models to quantify the threat of rupture risk.
The description above shows that it is very important to do further research on how to analyze and estimate the time of aortic rupture. This article presents a method of analysis of blood flow velocity and volume on aortic aneurysm with thrombus. The idea of this study is that about 80% of patients with AAA have been found a thrombus (blood clot) inside the aorta. Presence of the thrombus can cause changes in the blood flow speed, direction of the blood flow movement and the volume of blood flow on the aortic aneurysm.
2. RESEARCH METHODS
In method development and testing, the author uses the image of the 12 patients in AAA with thrombus (observed in the MRI examination). Each patient had 1 to 3 times the inspection at intervals of between 6 to 12 months (depending on the needs of each patient). MRI technology used is-3T MRI.
The proposed method for the reconstruction of 4D (3D+time) consists of three processes such as segmentation and extraction of object (aorta) from amplitude image, vector analysis and determination of the movement of blood flow, 3D reconstruction and animation of the aorta and mapping the movement of blood flow in the aorta with thrombus. Analysis and determination of the movement vector of blood flow using methods that have been developed in [16], so it is not described in this paper.
2.1Image Segmentation and Extraction Aorta
Segmentation is the process to determine the boundary between the region of interest ROI (i.e. the aorta) and extraction is the process of separating the aorta from the image and other regions. Segmentation is done using Active Contour method (Deformable Model / Snake).
In general, segmentation algorithms with Active Contour method can be written as follows:
- Determine the pixel offset between
the center (midpoint) of the two sets of images
- Discover the contour using an
iterative snake (used 3 iterations)
- Determine the contour where the most
correct (most compact)
- Use linear interpolation (from
center) on all the image
- Draw a line between the selected
contours on the original image
- Perform surgery morphology, fill the
hole.
- Find contour area.
- Show the contours of the original
image area
Due to the original image is obtained from DICOM, and then the segmentation algorithm used is:
- Read DICOM Image and convert the
image into a gray image (grayscale).
- Get the global threshold value and
the value of effectiveness.
- With this value, set the threshold
limit value.
•If the compactness value <= 0.65,
then the value of the global threshold of a new global value threshold = 0.05
•In addition, the global threshold
value = new global threshold value
- Masking images
- Labeling images with 4 values are
connected to obtain homogeneous regions selected (Region Of Interest / ROI).
- Calculate the area to determine the
long axis of the Major, and Minor axis length.
- Remove minority areas from areas
that have a high threshold value of more than 100 pixels.
- Find areas that have a minimum
compactness as ROI area. Compactness value derived from the value of the major axis length divided by the length of the minor axis.
- Improve the quality of the image at
the end of the ROI area by using morphology fill and then close and lock off the area.
- Determine the starting point of the
contour area.
- Get the boundary value with
8-connectivity and find the center for the snake.
- Show the contours of the image area
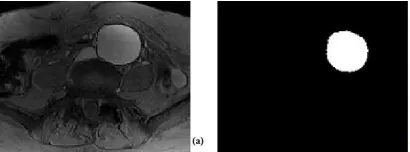
Figure 1. (A) Amplitude Image As An Input, (B) The Segmentation Result (Image Of The Aorta)
[image:2.595.305.510.573.649.2]Figure 2. Segmentation Result From 17 Slices Of Blood Flow Image Of The Aorta
2.2 4D Reconstruction from Blood Flow Image
Image reconstruction aims to reshape the object of several slices of image segmentation results. Figure 3 is a series of 2D images representing 17 image slices of the aorta objects that will be used to reconstruct a 3D image by adding vectors aortic blood flow movement which had been obtained previously. In this research, image reconstruction is performed only on the surface of the object, known as algorithms Scalar Volume Data (isosurface). The algorithm of this approach can be written as follows:
- Call MRI Data
- Transform the array 4D of data into
a 3D
- Indexing the data array
- Determine the coordinates of the
boundary
- Show isosurface
- Add display isocap
- Show the image reconstruction
results
Scalar Data volume consists of a 3D array of data and three-dimensional coordinates on the same array. Array coordinates determine the coordinates x, y, and z for each data point. The use of scalar data volume can be applied to the data from magnetic resonance imaging (MRI).
The algorithms described above have been Author implementation by using MatLab software. Calculation of blood flow volume has been processed and was obtained from the formula:
Volume (cm3) = xt*yt*zt (1) where:
xt = number of slices
yt = average cross-sectional area (cm ²) zt = distance between slices (mm) =
Maximum Diameter (mm) / number of slices
3. BLOOD FLOW IMAGING
Image acquisition technology in the field of medicine continues to evolve, such as Magnetic Resonance Imaging technology (MRI). With MRI technology, all anatomy of the body can be seen and acquired without having to perform surgery. MRI produces images with better quality so that it can facilitate the detection of some abnormalities in the soft tissues (e.g. blood vessels). The technology is also able to provide a more detailed overview of the anatomy and from different angles without having to change the position of the patient.
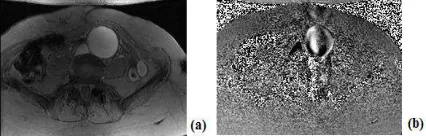
One type of image from cine-MRI technology is used to acquire MRI cerebrospinal fluid. This technology can also be used for the acquisition of blood flow in order to obtain a dynamic image. Cine-MRI image is the image of a amplitude and phase contrast image. This image has a interval on negative value to a positive that causes a phase jump and contain noise. This result makes the decline of image quality. Energy reduction techniques can be used to improve the quality of the image and re- adjustment of the absolute phase. Sample images of blood flow in the aortic aneurysm are shown in Figure 1.
Image acquisition is done vertically (in three directions) in the abdominal aorta and performed when the patient is breathing freely or doing breath hold at the specified location as needed [15]. Three directions from Cine-MRI image acquisition, i.e. from left to right (LR), from front to back (anterior-posterior/AP), and from the top down (top-down/TP).
[image:3.595.305.518.612.680.2]Image acquisition results on each patient examination can be obtained automatically making it possible to instantly processed and analyzed. In the description of this article, the researchers used the image of a three-way acquisition results mentioned above for the analysis and determine of blood flow velocity, direction of blood flow movement along the x-axis, y-axis and z-axis for reconstruction and animation.
Figure 3. Amplitude Image (A) And Phase Contrast Image (B) From MRI Examination
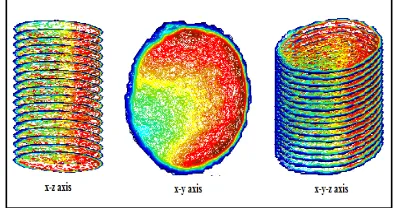
The method developed in this paper has implemented and has given excellent results. Figure 4, 5 and 6 show the results of aortic 4D reconstructions (3D+time) and 3D animation movement direction of blood flow. Each image is displayed in a 3-sided point of view, namely the visualization of the xz axis, in the xy axis and the xyz axis. Figure 4 show 3D reconstructed aorta and blood flow on heterogeneous thrombus categories, figure 5 for homogeneous thrombus categories and figure 6 for indefinite thrombus categories.
Figure 4. 4D Reconstruction From Blood Flow Image With Heterogeneous Thrombus Categories
[image:4.595.358.453.207.299.2]Figure 5. 4D Reconstruction From Blood Flow Image With Homogeneous Thrombus Categories
Figure 6. 4D Reconstruction From Blood Flow Image With Indefinite Thrombus Categories
The colors in the image reconstruction results representing a movement vector direction of blood flow in the aorta. Direction of movement is expressed in the corners as shown in Figure 7. The
blue color to the movement direction vector of blood flow in a vulnerable 0º-90º, the color red to the movement direction vector of blood flow in a vulnerable 90º-180º, yellow color to the movement direction vector of blood flow in prone 180º-270º, and the green color to the movement direction vector flow blood in the prone 270º-360º.
Figure 7. Representing The Difference Color From Vector Direction Of The Movement Of Blood Flow
[image:4.595.91.289.257.687.2]Under normal circumstances the blood flow in aorta represented by the movement of the colors mentioned above. What if there is a foreign object in the aorta? It would have looked the other colors in addition to the four colors representing blood flow movement. For example, in Figure 8 is the result of the reconstruction of the image of the blood flow in patients with AAA where distribution vector color looks evenly on all surfaces aorta. This shows that is not found the thrombus or blood clot inside the aorta. At figure 4,5 and 6 show the white color areas in addition to color blood flow vector. These results indicate there is a thrombus in the aorta.
Figure 8. 4D Reconstruction From Blood Flow Image
Without Thrombus
[image:4.595.307.505.498.602.2]Table 1. Measurement For Each Thrombus Categories
From the Table 1, it is obtained information that there were 3 patients AAA with homogeneous thrombus, 8 patients with heterogeneous thrombus and 1 patient with indefinite thrombus categories. The maximum diameter, thrombus area and thrombus categories have been obtained from the previous article [17]. Values of blood flow velocity have been calculated based on the maximum speed data obtained from the combined 3D instantaneous velocity in each direction vector (x, y, and z). And the volume of blood flow obtained simultaneously with 4D reconstruction image is the ultimate goal of this research.
5. CONLUDING REMARKS
5.1 Conclusion
Deformable models approach to image segmentation of dynamic blood flow has been used and developed in conjunction with the method of scalar volume data to produce image reconstruction which can represent the anatomy of the aortic aneurysm with blood flow in its every category thrombus. By obtaining the maximum diameter size and the size of the thrombus area, the value of maximum blood flow velocity 3D, as well as the presentation of the value of the volume of blood flow in each category thrombus, then it can be stated that the first thrombus will affect the volume and velocity of blood flow, greater the area of thrombus would further reduce the value of the speed of blood flow and vice versa, and the second the blood flow velocity, the presence of thrombus and blood flow volume have not seemed to affect the size of the diameter in patients with AAA.
5.2 Future Works
In the future it is necessary to consider other parameters such as the shear stress on the aortic wall, so the rupture of the aortic wall can be estimated in advance.
REFERENCES:
[1] Ernst C.B., Abdominal Aortic Aneurysms,
New England Journal of Medicine, 1993,
Volume 328, Pages 1167–1172
[2] Cosford P.A., Leng G.C., Screening for Abdominal Aortic Aneurysm, Cochrane
Database of Systematic Reviews, 2007, Issue 2
[3] Lederle F.A., Wilson S.E., Johnson G.R., Reinke D.B., Littooy F.N., Acher C.W., Ballard D.J., Messina L.M., Gordon I.L., Chute E.P., Krupski W.C., Busuttil S.J., Barone G.W., Sparks S., Graham L.M., Rapp J.H., Makaroun M.S., Moneta G.L., Cambria R.A., Makhoul R.G., Eton D, Ansel H.J., Freischlag J.A., and Bandyk D., Immediate Repair Compared with Surveillance of Small Abdominal Aortic Aneurysms, the New
England Journal of Medecine, 2002, Volume
346, Pages 1437-1444
[4] Raghavan, Wall Stress Distribution on Three-dimensionally Reconstructed Models of Human Abdominal Aortic Aneurysm, Journal
Vascular Surgery, 2000, vol. 31, pp. 760–769
[5] Fillinger M.L. Raghavan, Steven P. Marra, Jack L. Cronenwett, Francis E. Kennedy, In Vivo Analysis of Mechanical Wall Stress and Abdominal Aortic Aneurysm Rupture Risk, Journal Vascular Surgery, 2002, Volume 36: Pages 589–597
[6] Fillinger M.L., Steven P. Marra, M.L. Raghavan, Francis E. Kennedy, Prediction of Rupture Risk in Abdominal Aortic Aneurysm during Observation: Wall Stress versus Diameter, Journal Vascular Surgery, 2003, Volume 37: Pages 724-732
[7] Doyle B.J., Callanan A., Burke P.E., Grace P.A., Walsh M.T., Vorp D.A., and Mc-Gloughlin T.M., Vessel Asymmetry as an Additional Diagnostic Tool in the Assessment of Abdominal Aortic Aneurysms, J Vasc
Surg., 2009, 49(2): 443–454
[8] Geest J.P., Di Martino E.S., Bohra A., Makaroun M.S., Vorp D.A., A Biomechanics-Based Rupture Potential Index for Abdominal Aortic Aneurysm Risk Assessment: Demonstrative Application, Ann
N Y Acad Sci., 2006, 1085:11-21
[9] Kleinstreuer and Li, 2006, Analysis and Computer Program for Rupture-risk Prediction of Abdominal Aortic Aneurysms,
Biomedical Engineering Online, Volume 5,
[10] Stenbaek J., Kalin B., Swedenborg J., Growth of Trombus may be a Better Predictor of Rupture than Diameter in Pasiens with Abdominal Aortic Aneurysms, European
Journal Vascular Endovascular Surgery 20,
2000, 466-469
[11] Watton P.N., Hill N.A., Heil M, A Mathematical Model for the Growth of the Abdominal Aortic Aneurysm, Biomechanics
and Modelling in Mechanobiology, 2004,
Volume 3, No. 2, Pages 98-113
[12] Volokh K.Y. and Vorp D.A., A Model of Growth and Rupture of Abdominal Aortic Aneurysm, Journal of Biomechanics, 2008, Volume 41, Pages 1015–1021
[13] Doyle B.J., Coyle P., Kavanagh E.G., Grace P.A., and McGloughlin T.M., A Finite Element Analysis Rupture Index (FEARI) Assessment of Electively Repaired and Symptomatic/Ruptured Abdominal Aortic Aneurysms, IFMBE Proceedings, 2010, 31 (3), Pages 883-886
[14] Georgakarakos E., Ioannou C.V., Papaharilaou Y., Kostas T., Tsetis D., Katsamouris A.N., Peak Wall Stress does not necessarily Predict the Location of Rupture in Abdominal Aortic Aneurysms,
European Journal of Vascular and
Endovascular Surgery, 2010, Volume 39,
Pages 302–304
[15] Haacke, MRI: Physical Principles and Sequence Design, Canada 1999
[16] Karyati C.M., Refianti R., Muslim A., Mutiara A.B., Effect of Thrombi on Blood Flow Velocity in Small Abdominal Aortic Aneurysms from MRI Examination, (IJACSA) International Journal of Advanced Computer
Science and Applications, 2011, Volume 2,
No.3
[17] Karyati C.M., Lalande A., Steinmetz E., Mutiara A.B., Brunotte F., 2011, Prediction of the Evolution of the Aortic Diameter According to the Trombus Signal from MR Images on Small Abdominal Aortic Aneurysms, Medical and Health Science
Journal, MHSJ ISSN: 1804-1884 (Print)