365
DATA INVESTIGATION: ISSUES OF DATA QUALITY AND
IMPLEMENTING BASE ANALYSIS TECHNIQUE TO
EVALUATE QUALITY OF DATA IN HETEROGENEOUS
DATABASES
1
AZWA ABDUL AZIZ , 2MD YAZID MOHD SAMAN, 3JULAILY AIDA JUSOH
1
Lecturer, Fakulti Informatik, Universiti Sultan Zainal Abidin (UniSZA) Kampus Gong Badak, 21030 Kuala Terengganu, Terengganu, Malaysia 2
Professor, Fakulti Sains & Teknologi, Universiti Malaysia Terengganu, 21300 Kuala Terengganu, Terengganu, Malaysia
3
Lecturer, Fakulti Informatik, Universiti Sultan Zainal Abidin (UniSZA) Kampus Gong Badak, 21030 Kuala Terengganu, Terengganu, Malaysia E-mail: [email protected], [email protected], 3 [email protected]
ABSTRACT
Data investigation is a process to understand the nature of data in heterogeneous databases. Many organizations are using online transactions systems to support their company operations. The diversity of applications system that used to support organization may lead to data anomalies without the system owners realized the negative impact of decision making from insufficient information of data. The quality of the results from any analysis is only as good as the quality of the inputs (the data) that feed that analysis.
Therefore, data quality process is still a major factor in the successful operation of IT. An introducing of
new tech systems such as grid systems, ETL applications, semantic web are meaningless if data are lack of quality. In avoiding “Garbage In Garbage Out” principle, we proposed a technique that help to understand a
natured of data which we refer as Base Analysis Technique (BAT). BAT is used to profile heterogeneous
data in a structured approach, with the intention to determine abnormal data. The technique contains three levels of analysis consists of Top Level Analysis, Middle Level Analysis and Low Level Analysis. On the other hand, Data Quality Analysis System (DQAS) is a tool that developed using open source technologies which is connected to commercial databases in supporting BAT to be implemented in three-tier architecture. This paper describes issues surrounding data quality area and how BAT evaluates the quality of data in heterogeneous databases.
Keywords: Data Quality, Base Analysis Technique, Data Freshness
1. INTRODUCTION
The quality of data in Enterprise Information Systems is critical and has a significant impact to decisions made by the decision makers. Many researchers have proved that lack of Data Quality (DQ) may causes failures in respective subject areas. As an example, researchers have conducted the DQ impact in the areas of healthcare, information system, Information Technology (IT) management and many more. Sadiq et al. [1] has stated that the hurricane protection in New Orleans had failed due to the use of inadequate, incomplete and outdated elevation data. A survey conducted by Jafari [2] on the importance of critical success factors for implementing Enterprise Resources Planning (ERP) Systems in Malaysia, had
suggested that data accuracy and integrity is the third key success factor after top management support and clear goals and objectives. This survey is an empirical study on over 40 Malaysian enterprises that are running ERP system.
366 specific purposes. As example Human Resource System, Finance System, Sales System is separated systems but may have similar data. The separation of various applications systems to support business operations has led to data inconsistency and inaccuracies. The process becomes more complicated when decisions need to be made from a mixture of data in the transactions systems. Furthermore, the problems of DQ exist not only between databases (inter databases) but also in particular databases (intra databases).
Some issues that could possibly occur in transactions systems are data redundancy and inconsistent data anomalies. Redundant attributes, entity relationship problems, data errors (misspell, error in coding, etc.), semantic problems and missing elements are common errors in databases. Those errors may be accepted for some applications, but to some others; it may create chaos. Critical applications such as air-traffic system, military system, nuclear power system and disaster monitoring system are examples of applications that cannot tolerate failures. In business perspectives, poor decisions make based on inadequate data with lack of quality are similar analogy of digging their own graves.
Data profiling is a technique to understand the nature data of data in sources system by investigating the pattern of data. It can be achieved by profiling the hold column of data in databases or using clustering technique to perform analysis to speed up the profiling process. DQ software is an application that will be used to analyze the quality of data in databases. It will create automatic connection to any databases that need to be investigated. Then a set of function will be applied to determine the anomalies problems (consistency of data, missing value, key checking, and integrity of relationship between tables in the databases). Some examples of DQ software are Oracle Data Profiling/Quality and SAS Data Quality. Oracle Data Profiling is a data investigation and quality-monitoring tool. It allows business users to assess the quality of their data through metrics, discover or infer rules based on this data, and monitor the evolution of DQ over time. SAS DQ Solution provides an enterprise solution for profiling, cleansing, augmenting and integrating data to create consistent and reliable information.
The problems of existing DQ software are it is too much focus on consistency and missing element. It also required high involvement from users to identify quality data. As an example, it will provide null report analysis but cannot make a
clear classification whether null value is accepted or the value is there but not available. Furthermore the cost of owning DQ tools is really high (more than RM50 000 per year licensing). Consequently small companies or small middle size entrepreneur (SME) will not afford to buy it. As a result, many DW projects will leave DQ activities as one of their development cycle where most of them concentrate more to a result of data.
This paper has three main objectives. One is to create a structured way to perform data profiling in heterogeneous databases what we refer as BAT. Another objective is to implement BAT using Open Source Technologies to prove that DQ analysis can be done at lower cost by developing simple in house applications. The last one is to create awareness a crucial of DQ practice in any of Information System data.
Back-propagation is an iterative, gradient search, supervised algorithm which can be viewed as multiplayer non-linear method that can re-code its input space in the hidden layers and thereby solve hard learning problems. The network is trained using ANN technique until a good agreement between predicted gain settings and actual gains is reached.
During last three decades, the assessment of potential of the sustainable eco-friendly alternative sources and refinement in technology has taken place to a stage so that economical and reliable power can be produced. Different renewable sources are available at different geographical locations close to loads, therefore, the latest trend is to have distributed or dispersed power system. Examples of such systems are diesel, wind-diesel-micro-hydro-system with or without multiplicity of generation to meet the load demand. These systems are known as hybrid power systems. To have automatic reactive load voltage control SVC device have been considered. The multi-layer feed-forward ANN toolbox of MATLAB 6.5 with the error back-propagation training method is employed.
2. DEFINITION OF DATA QUALITY
367 a systematic approach to study related DQ concerns. Then in 1992, the Massachusetts Institute of Technology (MIT) Total Data Quality Management (TQDM) program was launched to underscore DQ as a research area[12] . Pioneering work in TQDM program has laid a foundation for DQ research. It has attracted a growing number of researchers to conduct cutting-edge research in this emerging field.
The previous studies shown DQ is often difficult concept to define and very considerably based upon the context in which it is been applied. However, researchers in DQ have agreed that a level of DQ can be measure by several DQ dimensions. TQDM has classified the DQ dimension into 4 main categories which is Intrinsic, Accessibility, Contextual and Representational [13]. Each category contains a several DQ dimension. As example accuracy and believability dimension is under intrinsic categories. However the basic sets of DQ dimension are accuracy, completeness, consistency and timeliness, which constitute the focus of the majority author [3].
Accuracy has been defined as that data are accurate when data values stored in the database correspond to the real world values [14]. Wang and Strong [15] have defined accuracy as the extent to which data are correct, reliable and certified. Redman [16] has stated that accuracy is a measure of the proximity of data value, v, to some other value, v’, that is considered correct. Accuracy also can be referred as correctness of data. The term correctness refers to the values and descriptions in data are truthfully and faithfully. Batini [3] has classified data accuracy into 2 types which are syntactic and semantic accuracy.
Syntactic Accuracy refers to the closeness of value, v, to the elements of the corresponding definition domain, D. Redundant data, violation of referential integrity rules and data typo error are examples of syntactic accuracy. Syntactic accuracy it is doesn’t mean comparing v with its real-world value v’; but verifying whether v is any one of the values in D, or how close it is to values in D. For example, v = ‘Amin’ is considered syntactically accurate even if v’ = ‘Amir’. However in our paper [5], we have suggested Gap Analysis Technique to identify the gap between target value (v’) retrieve from Metadata Analysis and real value in transactions system (v) that obtain from BAT. A set of improvement strategies can be develop to ensure
v= v’ or at least the value of v can be as close as
possible to v’.
Semantic accuracy refers to the different model definitions and representations for commonly business object. In other words, it is same values which have different meanings. The application systems are an isolated development of underlying data models, records, structures, data element formats and patterns. As an example is data defined on table vendor may be identified differently in each application system. Semantic accuracy is hard to solve and searching semantic accuracy require the involvement of expect users. Generating quality knowledge base dictionary possibly will help reducing semantic problems. Defining the taxonomy rules of subject in its, will help to create searching algorithm to control semantic issues.
The consistency dimension has been defined as the violation of semantic rules defined over a set of data items [3]. The values and descriptions of data need to be consistent across various business support systems. An example of consistency problems for ‘Kuala Lumpur’ is recorded in different ways of presentation such as K.T, Kuala Trg, Kuala Terengganu , K. Trg in source systems. A postcode which should have five numeric values is recorded in many patterns. A representation of address is different from Banking System and Billing System although they refer the same address. The consistency issue need involvement of many parties to produce standardization rules that agreed by respective parties. In real live situation, it is huge issue with both parties have the reason to their style of information. Changing the way of information possibly will increase their budget and resources.
Completeness refers to the degree which a given data collection includes data describing the corresponding set of real-world objects [3]. Two major aspects that need to be dealt on the completeness data are null values and missing values. A null value means the data is not available. However, it is ambiguous definition. The data may be exists in real world but not code in the system. It is an important mystery to solve. Most people seem it is normal issues which not give high impact to decision maker. Nevertheless, taking granted of null issue will lead to bad decision making On other hand, a missing value means that a value that are known exists in real world but is not available in data collection. For example, the attribute city for places column has not recorded. Without a city attribute, the system cannot locate where the places are.
368 the time gap between the extractions of data from the source and it delivery to users [6]. Some researchers have defined currency as age and others as freshness. Age is a measure of how old information is, based on how long it was recorded [17]. For an example, there are duplicate addresses of particular student in different transaction systems. Timeliness dimension can be used to determine the correct address by looking which data is more freshness. The newest record has more percentage of data is true by eliminating there fact that are typo error in newest record. The student might move to new house and records the latest address in systems. Volatility is a measure of information instability and the frequency change of values for an entity attributes [17]. It measures how frequent data have been updated in the source systems. The data updated normally depend on the type of data. Mokrane [6] has defined a nature of source data into three main categories; stable data, long term changing data, frequently changing data. Stable data is data that is improbable to change such as university name or state name. Long term changing data is data that have a very low frequency changes such as address of student. Finally, frequently changing data is Data that has intensive frequency changes such as quantity of sales or amount of sales.
There are several other dimensions in DQ that not been explain in the paper. As example are data believability/trustworthiness, data creditability, data security and accessibility. It is because BAT is focus more on four main dimensions that have been discuss most of DQ authors. Handling four main dimensions are crucial factors that help to dealing with other dimensions smoothly.
3. RELATED RESEARCH
Madnick [18] has divided DQ research into two main disciplines: from Management Information System (MIS) perceptive and Computer Science (CS) perceptive. In this paper, we classified DQ research into three main groups. One is the DQ issues in specific information systems and applying existing method of DQ framework. Secondly, research that are focus for on improving DQ process by introducing new method or enhance existing method in computer science perceptive. The last one is research that combining both of research perceptive (hybrid).
3.1 Research in Information System
DQ issues have been main concern in any applications system area such as business support systems (transactions systems, ERP, Decision Support Systems etc.), air traffic systems, transportation systems, military systems, energy management system. Those systems have to deal with quality problems which give a huge impact in their decision. Several researches are focusing the impact of poor or insufficient DQ in the applications.
For example, Mikkelsen and Aasly [19] reported that patient records often contain inaccurate attribute values. These inaccuracies make it difficult to find specific patient records. Salati et. al. [20] is applying DQ metrics (completeness, correctness, consistency, believability) into European Society of Thoracic Surgeon (ESTS) database. This study in medical science area is conducted to provide a template to be applied in medical/surgical field to test the quality of data in clinical registries. Meanwhile, The Nutrient Data Laboratory (NDL) of USDA conducted validation study of the USDA Data Quality Evaluation System (DQES). The system evaluate the quality of analytical data on nutrients by rating important documentation concerning the analytical method, analytical quality control, number of samples, sampling plans and sample handling . Shimshak et. al. [4] conducted a research to incorporate DQ into Data Envelopment Analysis (DEA) of nursing home performance. The study included the concern that arise when the result of analysis show that quality measures have been effectively ignored.
369 sets. Accuracy, Consistent and Believability / Reliability are DQ metrics that involved in the study.
In business area, Alshawi studies organizational, technical and data quality factors in Customer Relationship Management (CRM) adoption from Small Medium Enterprises (SMEs) perspective. The research objective is to enhance the quality of the evaluation process, and help support SME decision makers in exploring the implications surrounding CRM adoption. To address the issue, this research uses an investigative study aimed at identifying the organizational, technical and data quality related factors that influencing CRM adoption by SMEs. It also emphasizes the relationship between CRM and DQ.
There are many other researches that discuss DQ problems in specific areas. The numbers of research have been increase recently. Perhaps it is because researchers have realized the importance solving DQ issues to avoid GIGO phenomenon. Another reason is the maturity of DQ Life Cycle Methodology by Computer Science researches that helps to implement the quality analysis in information systems.
3.2 Research in Computer Science
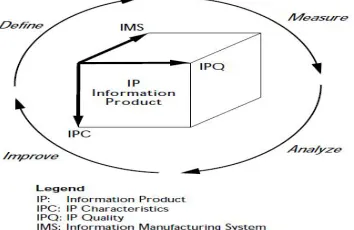
[image:5.612.320.514.290.455.2]Early data quality research focused mainly on developing techniques for querying multiple data sources and building large data warehouses (DW). Consequently, TQDM program is introduced as guidelines for DQ analysis in information systems. TQDM introduced four main categories of DQ dimensions; intrinsic, accessibility, contextual and representational. Each dimensions contain several DQ matrix attach to its. Intrinsic is the fact that information has qualities in its own right. Contextual is the requirement that IQ must be considered within the context of the task at hand. Accessibility and representational are emphasize the important roles of IS. Figure 1 shows TQDM for information products.
Figure 1. A schematic of the TDQM methodology
[image:5.612.104.281.598.713.2]Scannapieco et. al. [23], they present the architecture for managing DQ in cooperative information systems, by focusing on two specific modules, the DQ Broker and the Quality Notification Service. The DQ Broker allows for querying and improving DQ values. The Quality Notification Service is specifically targeted to the dissemination of changes on DQ values. DQ in Cooperative Information System (DaQuinCIS) project has started in 2001. It is involved 3 main universities in Italy which is Universita Di Roma, Polictechnico Di Milano, and Universita Di Milano. More than twenty people Professors, PHD Students, Technicians, and Researchers etc) cooperate in this project. Figure 2 is shows DaQuinCIS framework.
Figure 2. DaQuinCIS framework
370
Figure 3. Quality Meta Model
There are several others method that are focusing on developing techniques and solutions for DQ issues. As an example, Bouzeghoub and Perlata developed a framework for analysis data freshness. The data freshness has been related to currency and timeliness factor. Yu et. al. [7] is provided a Universal Data Cleaning Framework based on user model. User model is a data model which is abstracted from real model in the perceptive of user. It is focus on accuracy and consistency dimensions and how user interception can improve DQ. Lee et. al. [25] suggested a model for basic IQ assessment and benchmarking known as AIM Quality (AIMQ). It is encompasses a model for IQ, a questionnaire to measure IQ and analysis technique for interpreting IQ. Other researches of computer science are looking on precise area such as database technical solutions, DW and data integration, Enterprise Architecture, Network and performances. As an example, Davidson and Tayi [26] are combining data mining techniques into DQ matrices. The basic idea to perform the research is a fact that most of data mining researches are focus on discovering pattern in organizational databases without considers DQ knowledge of the databases. The research developed a general purpose method of incorporating data quality matrices into the data mining classification task by looking for accuracy, contextual, semantic interpretability and database quality matrix. Zhang et. al. [27] conducted a research to improve the quality of DW data by emphasize data structure correctness, data consistency, integrity and data atomicity. In data integration area, Lin and Hua [28] are focusing on data believability in data integration. They defined believability as the extent which data are accepted or regarded as true, real and credible. It consist three sub dimensions: trustworthiness, reasonable
and temporality of data. Madnick [28] in 2005 produced a paper on semantic issues in DQ. They discovered that many DQ problems are actually because data misinterpretation -that is, problems caused by heterogeneous data semantics. The paper illustrated how Context Interchange (COIN) technology can be used to capture data semantics and reconcile semantic heterogeneities, thereby improving DQ.
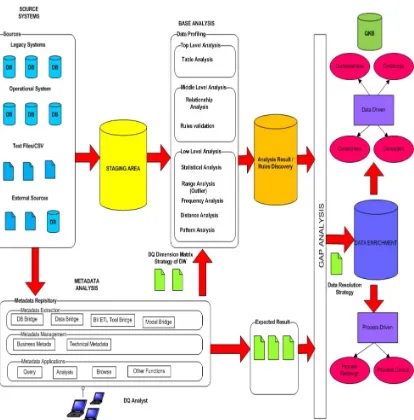
[image:6.612.315.522.339.549.2]In our previous research [5], we proposed DQ Life Cycle to handle DQ issues in DW architecture. It involved three main phases which are data definition, data analysis and data enrichment. Data analysis is vital phases because it is the process to investigating the quality of data. We suggested three sub analysis need to be done as shown in figure 4. There are Metadata Analysis, BAT and Gap Analysis. BAT will be the fundamental ideas in this paper.
Figure 4. Data Quality Life Cycle in Data Warehouse Architecture
In order to implement BAT we have developed a tool known as DQAS. It is developed using Hypertext PreProccessor (PHP) programming language to integrate to any Oracle Database Management System (DBMS) databases [30].
3.3 DQ Hybrid Research
371 Chen et. al. [31] have conducted a research on Chinese Materia Medica (Cmm) DW China Academy of Chinese Medical Sciences (CACMS) which support by China Natural Science Foundation and National Basic Research Program. It objectives is figure out processes of DQ construction, cited the reasons for bad DQ, and gave the key elements and their relations for DQ analysis and assessment. Chen proposes three steps of DQ phases. They are determination, assessment and improvement. It also proposed the DQ assessment is done when data available in DW. Most researchers suggested a DQ analysis need to be done before data extraction process. As an example, Mehmood et. al. [32] have proposed quality process need to be considered during the analysis phase of system development. More precisely, the earlier we can measure the quality of future software, the more we can improve it by being able to correct errors at the specifications level, the less will be the cost of these corrections and the more DQ will be improved.
Bertoni et. al. [33] have done a study Case Study on the Analysis of Data Quality for Large Medical Databases. It is involves a medical database containing clinical and administrative data from hospitals and private clinics in Bologna district area. This study adopts TDQM methodology and used Pentaho as BI tools and jasperETL for data extraction and transformations. Beroni is looking the result of the case study base on several DQ dimensions consistency, accuracy, completeness, interpretability, reliability, accessibility and security) suggested in other research.
Another paper by Jacobs [21] is concern on challenges to the quality of data-quality measures in food composition data. Demands are growing for information on the quality of food composition data. It is generally acknowledged today that the traditional measures of data quality (e.g. standard deviations) do not adequately address the complex issues affecting the quality of food composition data. In the paper, it discusses some of the significant challenges to implement the process of creating the standards for, and assigning quality values to food composition data. Specific strategic approaches are suggested that can reduce both the complexity and the cost of overcoming each of these challenges.
Devellers et. al. [34] has performed a study on geospatial data. The users of geospatial data increasingly face the need to assess how datasets fit an intended use. . However, information describing
data quality is typically difficult to access and understand. Therefore, data quality is often neglected by users, leading to risks of misuse. Understanding data quality is a complex task that may involve thousands of partially related metadata. For complex cases where heterogeneous datasets have to be integrated, there is a need for tools supporting DQ analysis. In this paper, it presents the design of such a tool that can manage heterogeneous data quality information and provide functions to support expert users in the assessment of the fitness for use of a given dataset. Combining concepts from GIS and Business Intelligence, this approach provides interactive, multi-granularity and context-sensitive spatial data quality indicators that help experts to build and justify their opinions.
There are several others research which not be highlighted in this paper. However, there more and more researches in this sectors that represent the important of DQ. It is a proved that the successful of information are based on how well data are provided to its consumer.
4. INTRODUCTION TO BASE ANALYSIS
TECHNIQUE (BAT)
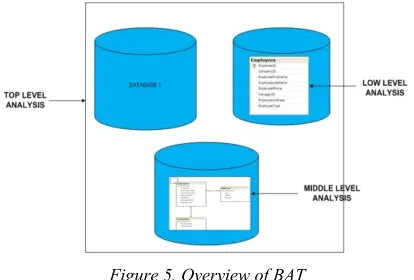
[image:7.612.314.521.565.705.2]BAT is data profiling techniques introduced to perform data investigation in heterogeneous databases. It is part of the DQ framework as suggested in [5]. The fundamental process is to determine the actual values stored in the source systems. Generally, BAT consists of three main analyses. Each of this analysis contains specific sub data analysis for a specific purpose. They main analyses in BAT are Top Level Analysis (TLA), Middle Level Analysis (MLA) and Low Level Analysis (LLA). Figure 5 shows how these analyses are performed to a set of databases.
372 TLA investigates and verifies the upper views of data model such as table definitions. It is conducted to ensure that the data is consistent in metadata technical definitions. It also requires an investigation of each table definitions across multiple databases. For example, identifying the semantic definition of an object such as client, customer, and supplier are the same entity that resides in different databases is a crucial factor to be carried out in quality analysis. It needs to be done to every database that support companies operations. MLA is a process to find whether the logic rules and integrity rules of relation tables are not violated. As an example, a foreign key that exist in the child tables also exist in parent tables. The third analysis, LLA is the process to capture data anomalies in specific data elements in databases. It can be divided into several data analysis processes such as Statistical Analysis, Outlier Analysis, Frequency Analysis, Distance Analysis and Pattern Analysis. A simple way to describe those analyses is: TLA mainly focuses on the relation between several databases, MLA focuses on the relation between entities/tables that reside in particular databases while LLA focuses on the attributes/data in the tables.
5. IMPLEMENTATION OF BAT USING
DQAS
Data Quality Analysis System (DQAS) is applications created to support BAT. It is developed using Hypertext PreProccessor (PHP) programming language to integrate to any Oracle Database Management System (DBMS) databases.PHP is a general-purpose scripting language originally designed for web development in order to produce dynamic web pages. For this purpose, PHP code is embedded into the HTML source document and interpreted by a web server with a PHP processor module, which generates the web page document. One of the main advantages of using DQAS is it only needs to be installed in a web server where multiple computers can access the systems and perform the task simultaneously
We chose Oracles as the DBMS platform to perform the analysis because it is a leading global DBMS over the years. It is the world's leading supplier of software for information management but it is best known for its sophisticated relational database products. Oracle's relational database was the world's first to support the Structured Query Language (SQL), now an industry standard. Most of established and well-known companies used
Oracle as their storage applications. The description of DQAS is divided into several subsections:
A. DQAS Architecture
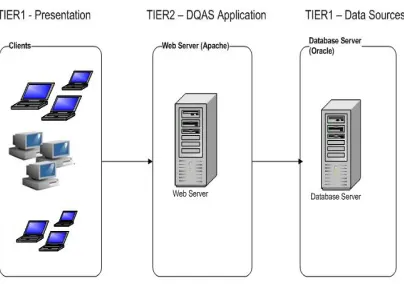
[image:8.612.314.516.274.416.2]DQAS uses Three-Tier Architecture. It is a client-server architecture in which the user interfaces, functional process logic ("business rules"), computer data storage and data access are developed and maintained as independent modules; most often on separate platforms. The main advantages of three-tier architecture are high performance and it avoids major failure if one of the machines cannot be operated. The three-tier architecture is shown in Figure 6.
Figure 6. DQAS Three-Tier Architecture
The first layer is the Presentation Layer. This is the topmost level of the application and it communicates with other tiers by forwarding results to the browser/client tier and all other tiers in the network. Several users can use DQAS simultaneously to run the applications at their machines using browser. The second layer is the Application Layer. The logic tier is pulled out from the presentation tier. As its own layer, it controls applications functionality by performing detailed processing. DQAS will be installed and maintained in this layer. A web server will be used to run the application. The last layer is the Data Source layer, a place to store data in databases.
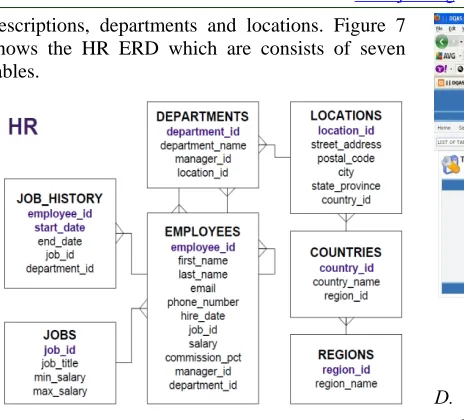
B. DQAS Implementation on HR Databases
373 descriptions, departments and locations. Figure 7 shows the HR ERD which are consists of seven tables.
Figure 7. DQAS Three-Tier Architecture
A set of connection is created between DQAS application and HR databases. The connection is automatically created by DQAS after users entered the password of the databases. Once the connection is done, BAT can be performed on the respective databases.
6. DQAS: DETAILED ANALYSIS
DQAS application will support all the analyses introduced in BAT that are:
C. DQAS : Top Level Analysis
Viewing every entity and attribute of databases are crucial factors in understanding the nature of the data before proceeding to the next phases. Let T =
{T1, ,T2, ...,Tp}be set of tables in database X that can
be described as:
Where,
is sum of tables in database X is tables in databases X
DQAS is able to display every as shown in Figure 8. In addition, DQAS enables users to display data in a single click without requiring users to understand SQL statement.The same method applies for viewing the attributes and data of each tables in the databases.
Figure 8. List Of Tables
D. DQAS : Middle Level Analysis
MLA is the process of viewing the relationship between entities of databases. Two main analyses developed by DQAS in MLA process are:
i. Rules Validation Analyis
The purpose of Rules Validation Analysis is to ensure the logic rules of 1 to many relationships (1-M) relationship are not violated. Mokrane and Veronica [6] have given an example which stated that the number of rows of a table depends on the number of rows of another tables: e.g., the number of accounts is equal or bigger than the number of customers.Based on the statement, DQAS count the total of both parent and child tables. The values will be compared and the system will prompt if the result is violated. As an example, when the number of region is more than the number of countries;the rule may be violated because every regions shoud contains at least one countries. Hence, the results still dependson the specific nature of the business environment.
ii. RelationshipAnalyis
[image:9.612.96.328.87.297.2]374
E. DQAS : Low Level Analysis
LLA is related to the analysis values of attributes. This is the core of BAT to obtain data abnormally over data elements. Those data may be violated in term of consistency, accuracy, timeliness, completeness or data believability. We have proposed DQ Dimension Matrix document in previous paper [5] in order to map dimensions needed to be investigated with particular attributes. Some major analyses in LLA are:
i. Statistical Analyis
[image:10.612.111.530.349.528.2]Statistical Analysis provides mathematical information of data such as minimum/maximum values, mean, median, mode and standard deviation. This is to ensure the validity of the data. It is normally used to analyze metrics in tables. Figure 9 shows an example of Statistical Analysis results using salary metric from EMPLOYEE. The result helps to determine whether it is an accepted result or not.
Figure 9. Statistical Analyis
ii. Frequency Analyis
Frequency Analysis is the process to calculate percentages of values that have been entered into the systems. This helps to solve a semantic problem. However, as proposed by Yu et. al.[7],it still needs human intervention to determine which values are correct. Furthermore, the correct values can be stored in the Quality Knowledge Base (QKB) which acts as a DQ dictionary. The same concept of QKB has been mentioned by Feng et. al. [8].It uses Unified Traditional Chinese Medical Language System (UTCMLS) to tackle data inconsistencies. Normally, the attribute which has highest frequency is the right value. SQL statement to gain the output from department_name in table DEPARTMENT can be evaluated in relational algebra as:
department_nameg count(depertment_id) as frequency
(DEPARTMENT)
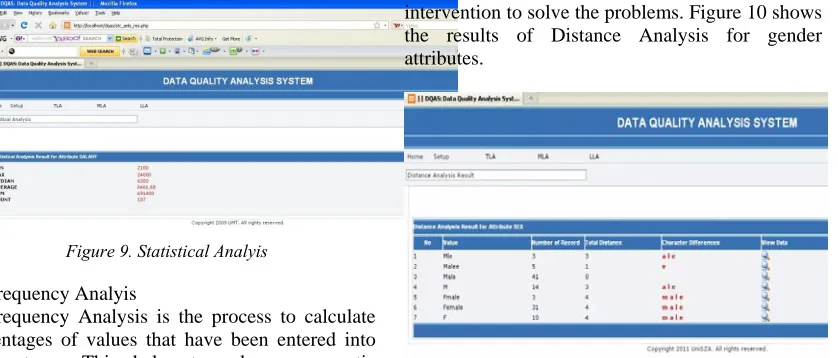
iii.Distance Analyis
Distance Analysis has been discussed by Sadiq et. al.[1] to overcome the problems of consistency and completeness. It assumes that we have defined appropriate value of target value (v).Distance analysis is a measure of the proximity of data value,
v, to some other value, v’, that is considered correctv’elements in order find out distances of each element against v. There are possibilities that the less value of distance result is the correct value with a typo error problem.
Distance Analysis is quite similar to the Hamming Code Technique in data communication flow to detect data error during transmission process. The distance function can successfully resolves the typo mismatch but there is a risk of matching two different terms which are similar in spelling: e.g,”Irin” and “Iris” should not be matched as they may be intentionally different [1]. Therefore, the framework proposes subject expert intervention to solve the problems. Figure 10 shows the results of Distance Analysis for gender attributes.
Figure10. Distance Analyis
In the figure, we have the v value gender which is ‘Male’. The v value will be entered to the system. The results show that there are several v’ values for ‘Male’ such as ‘ale’,’Mele’ and ‘Mle’. In additions, DQAS can display particular records for investigations purposes by a single click.
iv.Completeness Analyis
375 available in a data collection [3]. This analysis may not be suitable to be conducted to every single attributes, but to the selected attributes such as foreign key column, attribute which must contain values (other than primary key) and critical information columns. As example, assume that we want to analyze the completeness analysis of DEPARTMENTS table:
gcount(employee_id) (DEPARTMENTS)
n(x)= g count(selected attributes) is null (DEPARTMENTS)
Where,
isthe sum of total records in database DEPARTMENTS.
isthe sum of selected records in database DEPARTMENTS which consist
null values.
To obtain the percentage of null values:
( / *100
In DQAS application there are two options to find null values. First is by selecting specific attribute of tables. Another option is to select a single table and perform null value analysis for every attributes in the table. It can be evaluated as:
Let D = {d1, , d2, ...,dn} is the null values of each
attributes in table D. In order to find the percentages of null values of each attributes:
/n)*100
Where,
is percentage of null record is sum of null records of attributes
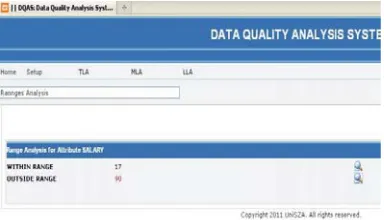
v. Outlier Analyis
Outlier Analysis is usually conducted to determine whether the values in an attributes are within the specified range or not. It is also referred as range analysis. As an example, a value of price items needs to have maximum and minimum value. It is impossible if the prices of shoes can reach until RM1 millions. Another example is an age values is not appropriate if it contains a values which more than 130 years.
DQAS offer two mechanisms to run the outlier analysis. Firstly, the ranges are specified by users. For instance, to find abnormal data for age in Malaysian secondary students; the range is between 13 to 17 years old. Abnormal data are data outside the range under consideration. To evaluate the range of the ‘salary’ attribute for EMPLOYEES table, we can use the relational algebra below by
assuming 1000 is minimum salary and 50 000 thousand is maximum salary.
employee_id (salary>1000 and salary<50 000 (EMPLOYEES))
[image:11.612.327.519.255.365.2]Figure 11 shows the results of this query. Records that were not included in the range can be considered as bad data. A further investigation needs to be conducted upon those records. DQAS will generate details of related records considered as data anomalies. Another mechanism is using DQAS automatic engine that produce the ranges values based on mathematical approach [9].
Figure 11. Range Analysis Result
7. FUTURE WORKS
There is more work need to be done to enhance the capability of DQAS. One is by combining data mining algorithm such as association rules, clustering analysis or decision support technique (e.g: AHP, TOPSIS, fuzzy). Those analyses are helpful in describing the issue of DQ in heterogeneous databases. It is also important to predict the possibility of errors that appear due to certain circumstances.
In addition, DQAS can also use association rules to describe the number v’ against appropriate value of target value (v). The association rules find the relations between items [10]. As an example, let say a data for attribute city in the table defines ‘Kuala Terengganu’ (v) as the city for Terengganu. However, in transaction system there are several v‘ values of ‘Kuala Terengganu’ such as ‘K.T, Kuala Trg, K. Trg’ which is consistency problems. The association rules help in determining the percentage or v‘ values occur to the v . Association rules have the following form: X→Y, support 40%, confidence 66%, which could mean 'if the city is Kuala
Terengganu, a user will enter it as K.T‘', with a
376 that contains both X and Y. Confidence is the percentage of the instances that contains Y amongst those which contain X.
A capability of BAT itself is another thing need to look at. Implementation of BAT in various area of information system need to done in order to prove a benefits of using structure data profiling technique.
In conclusion, intelligent analysis such as data mining algorithm is one of the vital features that should be included in DQAS especially to conduct LLA analysis since it serves the purpose to help system owner, decision maker, programmer or any parties that interact with the systems in order to improve the quality of data.
8. CONCLUSIONS
Inspiring by importance of decision maker need to decide based on information they have in their organization, this paper discusses a structured of investigating quality of data in heterogeneous databases. In the study, we have been given several examples on the impact of poor decision make due the incomplete or outdated data in respective area. We also classify DQ research into three main categories. A result of data quality analysis is crucial factor that give options to decision maker to believe their data in choosing a decision that may change a future of their organization.
BAT is a method developed to understand the nature of information in the structured data. It is one of analysis suggested in previous study to determine the level quality data base on DQ dimensions proposed by researchers. DQAS is a tool created to support BAT that is used open sources technologies in a network environment. Understanding the source of data is similar process to understand ourselves that make us know the capability to do certain works or to make decision in the journey of life.
REFRENCES:
[1] Sadiq, S., X. Zhou and O. Maria, 2007. Data quality-the key success for data driven engineering. Proceeding of the International
Conference on Network and Parallel
Computing-Workshops, University of
Queensland, pp. 48-56.
[2] J S.M. Jafari , M.R. Osman, R.M. Yusuff and
S.H. Tang, 2006. ERP Systems
Implementation in Malaysia: The Importance
of Critical Success Factors, International
Journal of Engineering and Technology, Vol.
3, No.1, pp. 125-131.
[3] Batini, C., C. Cappielo, C. Francalanci and A. Maurino, 2009. Methodologies for data quality assesment and improvement. ACM Comput.
Surveys, Vol. 41, 3:16.
[4] Shimshak DG, Lenard ML, Klimberg RK ,2009. Incorporating quality into data envelopment analysis of nursing home performance: a case study, Omega, 37: 672-685.
[5] Azwa, A., Md. Yazid, S. and Mohd. Pouzi, Hamzah, 2011. Using Metadata Analysis and Techniques in DQ Framework for DW (extended version), American Journal of
Economics and Business Administration 3 (1):
112-119.
[6] Mokrane, B., Veronica, P., 2004. A Framework for Analysis Data Freshness, Intelligence
Workshop on Information Quality in
Information Systems (IQIS’2004).
[7] Yu, H., Xiao-yi, Zhang. Zhen, Y., and Guao-quan, J., 2009. A Universal Data Cleaning Framework Based on User Model, In
Proceeding of the IEE International Colloquium on Computing, Communication,
Control and Management (ISECS), pp. 200 –
202.
[8] Feng, Y., Wu, Z., Chen, H., Yu, T., Mao, Y., and Jiang., X., Data Quality in Traditional Chinese Medicine, In Proceeding of
International Conference on Bio Medical Engineering and Informatics Technology: A comparison of two theoretical models.
Management Science 35, 8 (Aug. 1989), 982–1003, 2008.
[9] Allan G. Bluman, Elementary Statistic (7th edition), McGraw-Hill International Edition, 2009.
[10]Merceron, A., and Yacef , K.: Educational Data Mining: A Case Study, Proceedings of
Artificial Intelligence in Education
(AIED2005), Amsterdam, The Netherlands, IOS Press (2005).
[11]Wang, R. Y. and Madnick, S. E., 1989. The inter-database instance identification problem in integrating autonomous systems, In
Proceedings of the 5th International
Conference on Data Engineering, pp. 46–55.
377
Total Data Quality Management Program MIT
Sloan School of Management.
[13]Wang, R.Y., 1998. A product perspective on total data quality management”, Comm, ACM, 41: 2, pp. 58- 65.
[14]Ballou, D. and Pazer, H., 1985. Modeling data and process quality in multi-input, multi-output information system, Management Science,31, 2, pp. 150-162.
[15]Wang, R. and Strong, D., 1996. Beyond accuracy: What data quality means to data consumers”, J. Manage. Syst. 12, 4, pp. 5-33. [16]Redman, T.,1996. Data Quality for the
Information Age, Artech House Inc: Boston, London.
[17]Bovee, M., Srivastava, R., and Mak, B,2003. A conceptual framework and belief-function approach to assessing overall information quality, International Journal of Intelligent
Systems, Vol. 18, Issue 1, pp. 51-74.
[18]Madnick, S.E. Y.W. Lee and H. Zhu, 2009. Overview and framework for data and information quality research, Journal of Data
and Information Quality (JDIQ), ACM, Vol. 1,
2009. DOI:10.1145/1515693.1516680
[19]Mikkelsen, G. and Aasly, J., 2005. Consequences of impaired data quality on information retrieval in electronic patient records, Int. Journal Medical Information 74, 5, pp. 387–394.
[20]Salati, M., Brunelli, A., Dahan, M., Rocco, G., Raemdonck, D. and Varela, G., 2010. Task independent metric to assess DQ in European Society of Thoracic Surgeons (ESTS) ,
European Journal Cardiothorac Surg,
DOI:10.1016/j.ejcts.2010.11.004.
[21]Jacobs Jr., C., G., 2009. Challenges to the quality of data quality measures, EuroFIR
Special Issue, Volume 113, Issue 3, pp.
754-758.
[22]Cao, K., Zhu, Q., Iqbal, J. and Chan, J.,2007. A trend pattern assessment approach to microarray gene expression profiling data analysis, Pattern Recognition Letters, Volume 28, Issue 12, pp. 1472-1482.
[23]Scannapieco, M., Virgillito, A., Marchetti C., Mecella, M., and Baldoni, R, 2004. The DaQuinCIS architecture: a platform for exchanging and improving data quality in Cooperative Information Systems “, Inform.
Syst. 29, 7, p. 551–582.
[24]Juesfeld, M., Quix, C., and Jarke, M.,2008. Design and analysis of quality information data
warehouses , In Proceedings of the 17th
International Conference on Conceptual
Modeling, pp. 349 – 362.
[25]Lee Y.W., Strong, D. M., Kahn, B. K., and Wang, R. Y., 2002. AIMQ: A methodology for information quality assessment , Inform.
Manage. 40, 2, pp. 133–460.
[26]Donald, P., B., and Tayi, G.K., 1999. Enhancing Data Quality in Data Warehouse Environments. Communications of the ACM, Vol. 42, Issue 1, pp. 73-78.
[27]Zhang, J., Wen, Q. and Zhang, H., 2009. The research in improving quality of DW data “,
IEEE Wireless Communications, Networking
and Mobile Computing Conference, Beijing
University, pp. 1 – 4.
[28]Mo Lin., and Zheng Hua., 2008. “A Method for Measuring Data Quality in Data Integration”,In Proceeding IEEE International
Seminar on Future Information Technology
and Management Engineering, pp. 525 – 527.
[29]Madnick, S., and Zhu, H., 2005. Improving data quality through effective use of data semantics, Data & Knowledge Engineering 59, pp. 460–475.
[30]Azwa., A, Yazid,.M.,S., Hasni., H., 2011. “DQAS Implementation to support Base Analysis Techniques in data Quality Life Cycle “,HIS 2011, IEEE Explore, pp. 16-21, 10.1109/HIS.2011.6122073.
[31]Chen, B., Wang, B., Weng, X., Hu, X., 2009.Analysis and solution of Data Quality in Data Warehouse of Chinese Materia Medica ,
In Proceeding of the International Conference
on Computer Science & Education, pp.
823-827.
[32]Mehmood, K., Samira, S., and Isabelle, C., 2009. Data Quality through Model Quality: A Quality Model for measuring and improving the understandability of conceptual models,
MoSE+DQS’09, pp. 29-32.
[33]Bertoni, M., Furlini, G., and Gozzoli, G., 2009. A Case Study on the Analysis of Data Quality for Large Medical Database, 20th International
Workshop on Database and Expert Systems
Application, pp. 308-312.
Devillers, R., Bédard, Y., Jeansoulin, R. and Moulin, B. , 2007. Towards spatial Data Quality Information Analysis Tools for experts assessing the fitness for use of spatial data, International Journal of Geographical
Information Science, vol. 21, no. 3, pp. 261–