102
A NEW APPROACH OF RSSI PROBABILITY
DISTRIBUTIONS FOR INDOOR POSITIONING
1CHEN LINA, 2ZHANG YU, 3ZHENG ZHENGQI
1Doctor, College of Information Science and Technology, East China Normal University, Shanghai, China;
Assoc.Prof., College of Mathematics, Physics and Information Engineering, Zhejiang Normal University, Zhejiang, China
2
Doctor, College of Information Science and Technology, East China Normal University, Shanghai, China
3Prof., College of Information Science and Technology, East China Normal University, Shanghai, China
E-mail: [email protected], [email protected], [email protected]
ABSTRACT
In short range Radio Frequency technologies, Wireless Location Area Network (WLAN) has already be used as one of the most effective indoor positioning system. It is competitive in terms of both accuracy and cost compared to similar systems. To date, several signal strength based techniques have been proposed. Fingerprinting is a common technique for indoor positioning. It consists of the data training phase and the real-time positioning phase, data training phase is to generate a radio map for the location phase. Generated map is the key for the accuracy of positioning, for generating the radio map we need collect samples at each reference point and analyse Radio Signal Strength Indicator (RSSI) . This paper presents a new approach to approximate RSSI probability distribution, that is the adjusted Weibull function. Researchers have done several experiments in difference conditions, the test results show that the adjusted Weibull function can well approximate 2.4G WiFi RSS probability distribution. I hope this study can bring some reference for fingerprinting indoor positioning.
Keywords: Indoor Positioning, Fingerprinting, RSSI, Adjusted Weibull Function, WiFi
1. INTRODUCTION
Location Based Service (LBS) is mobile application which depends on mobile devices and mobile network to calculate the actual geographical location of mobile user, further to provide the service information related with the position the users need. It is now becoming one of the standard features in mobile devices and has good application prospect and huge market space. The key issues for LBS is the positioning technology. Indoor positioning is one of the most active research areas in recent years and more and more researches are concentrating on it. Global Position System (GPS) is the most popular positioning system, however, it is not suitable for indoor positioning due to the unavailability or attenuation of the GPS signals. There are many radio technologies adopted for indoor positioning, such as cellular networks, Wireless Local Area Network (WLAN), yes, WLAN aims to provide local wireless access to fixed network , it is welcomed by consumers due to its many advantages (such as low cost, mobile). Especially, WiFi has become the industry standard, it iperates up to 11 Mbps in the 2.4GHz band, all
those show WLAN is a good choice for indoor positioning.
As we all know, indoor radio signals distribution is very complex due to signal attenuation, penetration losses and multipath propagation. It is very difficult to generate a RSSI distribution model. As mentioned above, the fingerprinting approach is an effective way for WiFi positioning. For fingerprinting, to generate radio map is very important, because it directly affects the accuracy of positioning. In this paper, we proposed adjusted Weibull function to approximate the 2.4GHz WiFi RSS probability distribution, experiments show this approach can better reflect RSS distribution.
103 large workload. The better data map, the better locate.
The remains of the paper is organized as follows: To reduce the time of calculating location for indoor positioning with fingerprinting methodology, we need generate training database quickly and exactly. In section 2 and section 3, we explain that the existing the components and theory of WLAN and fingerprinting location system. Then we describe how to use Weibull function to approximate the RSSI distribution in section 4. Based on presented Weibull model and test data, in section 5, we do several experiments and simulations and discuss the test results. Section 6 draws a conclusion to the whole paper and
summarizes and discusses possible extensions of our work.
2. THE COMPONENTS OF WIRELESS INDOOR POSITIONING SYSTEM
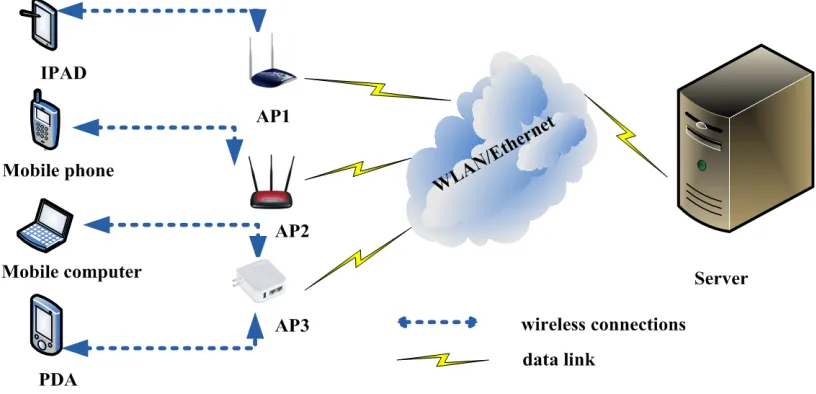
[image:2.612.105.513.285.482.2]The components of the wireless positioning system in this paper consist of two parts: the wireless network and mobile devices. As shown in Figure 1, the server connected with several accept points (APs) over a WLAN/Ethernet network is responsible for the system core functions, especially positioning calculations. The APs are synchronized by the server when inquiring the mobile devices in their surroundings and relay the positions from the server to mobile devices.
Figure 1: Wireless Indoor Positioning System
Whenever received signal strength, indicator (RSSI) measurements are needed for positioning, the server will send a trigger to all APs to scan the mobile devices in their surroundings. Having completed the inquiring task, all APs will send the RSSI measurements back to the server either for the purpose of calculating the current positions of the mobile devices or generating the radio map database.
3. LOCATION FINGERPRINTING TECHNOLOGY
Location fingerprinting consists of two phases: ‘data training phases’ and ‘positioning phases’. The objective of the training phase is to build a
104
...
AP(1)
AP(N) AP(2)
Mobile Users(MU)
(x1,y1)
(x2,y2)
(xn,yn)
...
calculate unit
RSSI1, RSSI2, ...
RSSI1, RSSI2, ...
RSSI1, RSSI2, ...
(x,y) RSSI1, RSSI2, ...
(x,y)?
MU MU location
data training phase
positioning phase
[image:3.612.94.513.66.350.2]database
Figure 2: Two Phases Of Fingerprinting
The fingerprinting approach has been accepted as an effective method for WLAN positioning, although there are still a lot of problems. There are in fact two ways to estimate the unknown location. The simplest one is the deterministic method. The average SS of each WLAN AP measured at each RP is used to create the fingerprint database. Since the variation of the SS measured at each point is large, in order to achieve more accurate results, the probabilistic approach has also been developed. Unfortunately, the distribution of the SS is non-Gaussian. Even worse, it varies at different locations, and at the same location when the orientation of the antenna changes. Hence many measurements are necessary, and this takes more time to generate the RSS distribution at each RP. Furthermore, this increases the database size and the computational burden. Nevertheless, the establishment of the location fingerprint database is an essential prerequisite. To achieve a good estimation of user location, the more RPs, or in other words, the smaller the granularity, the better. And the more measurements obtained at each point the better. However, more RPs and more measurements mean that the training phase is a significant task in terms of labour and time.
In all words, at each reference point, the RSSI probability distributions of all APs are stored. To speed up the location computation process, it is the
key which the probability of the RSSI was measured accurately and quickly.
4. THREE- PARAMETER WEIBULL DISTRIBUTION FUNCTION
In this paper, in order to obtain a good estimate of the RSSI probability distribution at data training phases, we introduce the Weibull function to proximate the RSSI probability distribution. The Weibull function is a traditional method for modelling the signal strength of radio propagation. The probability density function can be expressed as
<
≥
−
=
− − −
t
x
t
x
e
t
x
m
x
f
m t x m
,
0
,
)
(
1
θ
θ
θ
(1)
Where x is the variable of the function, t is the shift parameter, m is the shape parameter, and θ is the scale parameter. While the cumulate distribution function is defined as
m
t x
e
x
F
− −
−
=
θ1
)
(
(2)
105 Weibull distribution has very high accuracy. The basic idea is to choose undetermined parameter to make sample probability maximum in the observation fields. When there is n data and be expressed as the sign xi (where i from 1 to n), and
n
x
x
x
1≤
2
≤
, then the logarithmic likelihood function can be expressed as
∑
∑
= − − − =
−
=
=
n i t x m i n i i n m ie
t
x
m
t
m
x
f
t
m
x
x
x
L
1 1 1 2 1ln
)
,
,
;
(
ln
)
,
,
;
,
,
,
(
ln
θθ
θ
θ
θ
(3)
Then maximum likelihood equations can be defined = − + − − − = ∂ ∂ = − + − − = ∂ ∂ = − − − − + = ∂ ∂
∑
∑
∑
∑
∑
= = = − = = n i m i n i n i m i i n i n i i m i i t x m m n n L t x m t x m t L t x t x t x m n m L 1 1 1 1 1 1 0 ) 1 ( ln 0 ln 1 ln ) 1 ( ln 0 ln ln ln θ θ θ θ θ θ θ θ θ θ(4)
Through equations (4) we can obtain the three parameters of Weibull function. But due to the equations is nonlinear and can’t access answers directly. Currently, most ways is using computer programming iteration solve, it is not only very complex but also due to unfit initial value lead to can’t obtain the results which we hope. In this paper, we through logarithmic likelihood function maximum value to solve the parameters.
Let us look at the following deduced
∑
∑
= = − = ⇒ = − + − − − = ∂ ∂ n i m i m n i m i t x n t x m m n n L 1 1 ) ( 1 0 ) 1 ( ln θ θ θ θ θθ
(5)
Take equation (5) into equation (3), obtained
(
)
n
t
x
m
t
x
n
nl
m
n
t
m
x
x
x
L
n i i n i m i n−
−
−
+
−
−
=
∑
∑
= = 1 1 2 1)
ln(
)
1
(
1
ln
ln
)
,
,
;
,
,
,
(
ln
θ
(6)
According to maximum likelihood principle, maximizing equation (6), then the value of m and t are the estimated value of shape parameter and shift parameter. From the physics meaning of three-parameters Weibull distribution we know usually
1
0 10
0<m< ; ≤t <x , so solving equation (6) That is equivalent to solving equation(7)
(
)
n
t
x
m
t
x
n
n
m
n
t
m
x
x
x
L
n i i n i m i n−
−
−
+
−
−
=
∑
∑
= = 1 1 2 1)
ln(
)
1
(
1
ln
ln
))
,
,
;
,
,
,
(
max(ln
θ
(7)
Subject to:
<
≤
<
<
10
10
0
.
.
x
t
m
t
s
Using nonlinear programming method to get shape parameter and shift parameter is very easy, then take shape parameter and shift parameter’ value into equation (5) to work out scale parameter.
5. EXPERIMENTS AND DISCUSSIONS
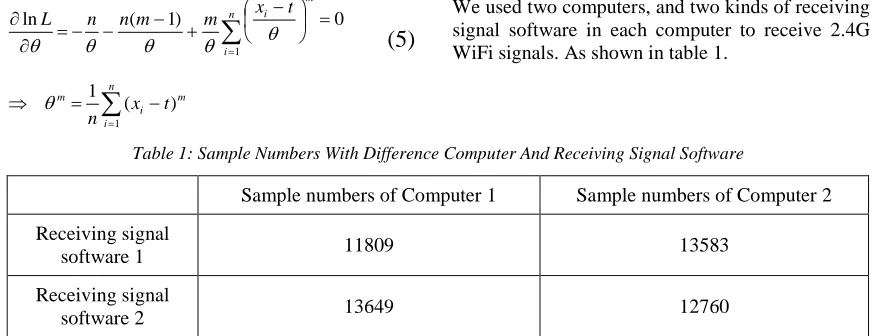
[image:4.612.87.527.539.707.2]In order to test the performance of the algorithm in this paper, two test cases have been carried out. We used two computers, and two kinds of receiving signal software in each computer to receive 2.4G WiFi signals. As shown in table 1.
Table 1: Sample Numbers With Difference Computer And Receiving Signal Software
Sample numbers of Computer 1 Sample numbers of Computer 2
Receiving signal
software 1 11809 13583
Receiving signal
software 2 13649 12760 We need to explain, one is the two computers
have difference wireless receiving configuration,
106 active receiving. Each test has more than 11000 RSSI samples. Using the algorithm in this paper, we draw the following pictures. Another is we only use equation (7) to work out the shape and shift parameters, the scale parameter is adjusted.
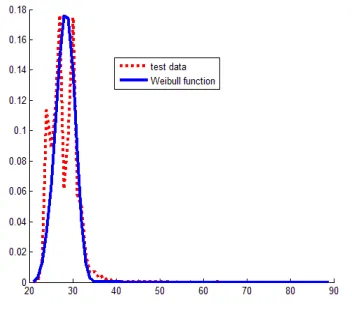
[image:5.612.326.512.160.328.2]The figure 3 is a picture which uses passive scan receivig software in computer 1, where red dash line is the 11809 RSSI samples distribution. The blue solid is we got the Weibull probability distribution from the RSSI samples. The figure 4 is a picture which uses active receiving software in computer 1, where red dash line is the 13649 RSSI samples distribution. The blue solid is we got the Weibull probability distribution from the RSSI samples.
Figure 3: 11809 samples by passive scan in computer 1
Figure 4: 13649 samples by active receiving in computer 1
Similarly, figure 5 and figure 6 is respectively the RSSI smples distribution and corresponding Weiull probability distribution in the computer 2,
[image:5.612.105.286.295.452.2]where red dash line shows samples distribution and blue solid line shows Weibull probability, passive scan has 13583 samples and active receiving has 12760 samples.
[image:5.612.323.513.371.529.2]Figure 5: 13583 samples by passive scan in computer 2
Figure 6: 12760 samples by active receiving in computer 2
From figure 3 to figure 6, we can draw a conclusion, the shapes of the two lines are similar for each figure in lots of different conditions (different receiving software and different computer). Of course, we also must look out this test since it is only at one sampling position, hence if we want to verify point further in this paper, we need have lots of tests in various conditions. This is our next works.
6. CONCLUSIONS
[image:5.612.101.277.501.656.2]107 distribution. In order to make this algorithm quickly create curve, we propose programming solving, using this method significantly accelerate calculating speed. Wireless infrastructure has been widely utilized in personal area network communication. The proximity approaches have also been investigated in recent years. To pursue a practical indoor locating solution with sufficient accuracy in a wider area, this study enlightens an indoor locating approach via RSSI probability distributions.
The test result shows that RSSI probability distribution approach is a reasonable way for 2.4G WiFi locating. Since the Weibull function (adjusted scale parameter) is utilized for approximating the probability distribution of 2.4G WiFi signal strength, it can reduce the workload needed for generating the fingerprint database, to generate fingerprint database will become easy and speediness, location time cost will be improved significantly.
Of course, the data in this paper from the test which be done in a perfect place, have no people’s disturb and other noticeable. But in real using, these conditions are no existing. Hence we plan to do more tests in various environments, such as school, shopping, computer room and office etc, our further work is to accurate describe the regularity of radio signal distribution, provide sufficient theoretical basis to generate fingerprinting database for indoor positioning.
ACKNOWLEDGEMENTS
This work was partially supported by the Pre-Research project of the key technology research of container intelligent logistics based on Beidou satellite which funded by Science and Technology Commission of Shanghai Municipality (12511501102), and also is supported by the project high gain low cost miniaturization multimode substrate integrated satellite navigation antenna which funded by Shanghai Municipal Commission of Economy and Informatization.
REFRENCES:
[1] B. Li, A. G. Dempster, J. Barnes, C. Rizos and D. Li, "Probabilistic algorithm to support the fingerprinting method for CDMA location," in Proc. Int. Symp. on GPS/GNSS 2005.
[2] B. Li, J. Salter, A.G. Dempster, C. Rizos, “Indoor positioning techniques based on Wireless LAN,” in Proceedings of 1st IEEE
Int. Conf. on Wire-less Broadband & Ultra Wideband Communications, Sydney, Australia, 13-16 March, , 2006.
[3] Ladd, A.M., Bekris, K.E., Rudys, A., Marceau, G., Kavraki L.E., & Dan, S., “Robotics-based location sensing using wireless Ethernet”, Eighth ACM Int. Conf. on Mobile Computing & Networking (MOBICOM), Atlanta, Georgia, US, 23-28 September 2002, pp. 227-238. [4] Sagias C. and Karagiannidis K. Gaussian class
multivariate Weibull distributions: theory and applications in fading channels, Institute of Electrical and Electronics Engineers. Transactions on Information Theory, Vol. 51 No. 10, 2005, pp. 3608–3619.
[5] Roos T., Myllymaki P., Tirri H., Misikangas P., and Sievanen J. A probabilistic approach to WLAN user location estimation, International Journal of Wireless Information Networks, Vol 9(3), July 2002, pp.155-164.
[6] Youssef M., Agrawala A., and Shankar A. U. Wlan location determination via clustering and probability distributions, Proceedings of the First IEEE International Conference on Pervasive Computing and Communications, IEEE Computer Society, Texas, USA, March 2003, pp:143-150.
[7] Ling Pei, Ruizhi Chen, Jingbin Liu. Using Inquiry-based Bluetooth RSSI Probability Distributions for Indoor Positioning, Journal of Global Positioning Systems, Vol. 9, No. 2, 2010, pp. 122-130.
[8] Hightower, J., & Borriello, G., “Location systems for ubiquitous computing”, IEEE Computer, Vol. 34, No. 8, August 2001, pp. 57-66.
[9] Saha, S., Chaudhuri, K., Sanghi, D., & Bhagwat, P., “Location determination of a mobile device using IEEE 802.11b access point signals”, IEEE Wireless Communications & Networking Conference (WCNC), New Orleans, Louisiana, US, 16-20 March 2003, vol. 3, pp.1987-1992.
[10] Youssef, M., Agrawala A., & Shankar, A.U., “WLAN location determination via clustering and probability distributions”, IEEE Int. Conf. on Pervasive Computing & Communications (PerCom) 2003, Fort Worth, Texas, US, 23-26 ,March 2003, pp.143-150.
108 Communications, vol. 3, August 2003, pp. 2208–2212.
[12] Li, B., Dempster, A.G., Rizos, C., & Barnes, J., “Hybrid method for localization using WLAN”, Spatial Sciences Conference, Melbourne, Australia, 12-16 September 2005, 341- 350, CD-ROM procs.
[13] Li, B., Wang, Y., Lee, H.K., Dempster, A.G. & Rizos, C. “Method for Yielding a Database of Location Fingerprints in WLAN”, Communications, IEE Proceedings, Vol. 152, Issue 5, October 2005, pp. 580-586.
[14] A. G. Dempster, B. Li and I. Quader, "Short baseline propagation characteristics of deterministic wireless fingerprinting systems for localisation," in 6th IEEE Consumer Communications and Networking Conference, 2009. CCNC 2009, Las Vegas, Nevada, 2009, pp. 1-5.
[15] A. G. Dempster, B. Li and I. Quader, "Errors in determinstic wireless fingerprinting systems for localisation," in Wireless Pervasive Computing, 3rd International Symposium on, Santorini, Greece, 2008, pp. 111-115.