2019 International Conference on Information Technology, Electrical and Electronic Engineering (ITEEE 2019) ISBN: 978-1-60595-606-0
Analysis of Water Resources Utilization Efficiency in Jilin Province
Based on DEA Method
Bo-yang SUN and Xiao-hua YANG
*State Key Laboratory of Water Environment Simulation, School of Environment, Beijing Normal University, No. 19, XinJieKouWai St., HaiDian District, Beijing 100875, China
*Corresponding author
Keywords: DEA analysis, Water use efficiency, Water resources carrying capacity.
Abstract. Based on the DEA analysis method and input-output principle, this study selected the natural water resources, water resources input and social economic indicators of Jilin Province to construct the water resources development efficiency model of Jilin Province and the water resources utilization efficiency model of Jilin Province. Using the above model to evaluate the water resources development and utilization efficiency of various cities in Jilin Province. Studies have shown that one-third of the prefecture-level cities in Jilin Province have low water use efficiency and have great potential for improvement. Policy recommendations have been put forward for the improvement of water use structure and water use efficiency. The research shows that the water saving potential of Jilin Province is 1.343 billion cubic meters, and the potential GDP will increase by 63.4 billion yuan due to the improvement of comprehensive water use efficiency.
Introduction
The Fifth Plenary Session of the Eighteenth Central Committee of the Eighteenth Party of the Party proposed that water is the foundation of survival, the source of civilization, and the essence of ecology. In order to better support China's water conservancy in building a well-off society in an all-round way, the party and the state have proposed new ideas for water management [1,2]. Water resources and water environment have become the bottleneck restricting China's current economic and social development. How to balance water resources, water environment and economic development, and coordinated regional development has become a top priority. Water resources, water environment, water environment and people's living and health. It is closely related and is also the most important public product and production material. How to improve the utilization efficiency of water resources and improve the carrying capacity of water resources is a hot issue in current research. The mainstream scholars at home and abroad believe that the meaning of water resources carrying capacity is that water resources carrying capacity is the water resources of a certain region under a specific historical development stage, based on predictable technical, economic and social development levels [3,4].The principle of sustainable development is to maintain the virtuous circle of ecological environment as the condition, and after reasonable allocation and optimization, the maximum support capacity for the socio-economic development and population size of the region. Therefore, based on the input-output view and DEA analysis method, this paper constructs the evaluation model of water resources utilization efficiency in Jilin Province, and analyzes the water use efficiency of various cities in Jilin Province, and gives policy recommendations for water resources carrying capacity regulation [5].
Method
DEA has a variety of measurement models, including CCR, BCC, ST, FG, etc[8].Suppose there are n DMUs in a system, each of them has m input indicators ( xm1,xm2,…,xmj) and s output
indicators ( ys1,ys2,…ysj), and the DEA model is:
s. t
{
𝑚𝑖𝑛[𝜃 − 𝜀(𝑒1𝑇𝑆++ 𝑒 2𝑇𝑆−)] ∑𝑛 𝜆𝑗
𝑗=1 𝑋𝑗+ 𝑆−− 𝜃𝑋𝑗0 = 0 ∑𝑛𝑗=1𝜆𝑗𝑌𝑗− 𝑆+− 𝑌𝑗0 = 0
𝜆𝑗 ≥ 0, (j = 1,2, … , n) 𝑆+ ≥ 0
𝑆− ≥ 0 0 ≤ 𝜃 ≤ 1
(1)
where, θ, effective value; ε, non-Archimedean infinitesimal, S+, slack variables of m input, S-, slack
variables of s output; 𝜆𝑗, weight vector of input and output; n, the number of DMU;
𝑒1𝑇=(1,1,…,1)
1×m, 𝑒2𝑇=(1,1,…,1)1×s.
The economic meaning is:
(1) if θ=1,while S+= S-=0, then DEA is effective;
(2) if θ<1, then DEA is invalid; when ∑𝑛𝑗=1𝜆𝑗=0, technical efficiency, otherwise technical inefficiency; here K=1/(θ∑𝑛𝑗=1𝜆𝑗), when K=1, scale efficiency, when K<1, increasing returns to scale, when K>1, decreasing return to scale[9,10].
Model Construction
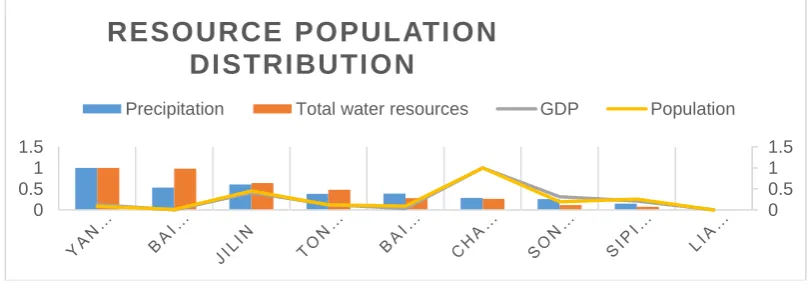
[image:2.595.94.500.484.630.2]Located in northern China, Jilin Province has jurisdiction over nine prefecture-level cities. The virgin forest in Changbai Mountain is distributed in the east and the grassland wetland in the west. It is an important ecological barrier in Jilin Province; the Songliao Plain in the middle is an important production base for grain and livestock products in the country. The water resources and population distribution in Jilin Province are uneven. The detailed data is shown in Figure 1.
Figure 1. Distribution of population and water resources.
For comparison purposes, the data in Figure 1 has been normalized. It can be seen from Figure 1 that the water resources and population distribution in Jilin Province are extremely uneven, and Yanbian and Baicheng in the east are the main water producing areas, but the population is relatively small and GDP is low. Changchun, the most populous city, has the highest GDP in the province, but its water resources and precipitation are relatively small. It can also be concluded from the above figure that GDP is highly correlated with the population, and the amount of water resources is closely related to precipitation. Therefore, improving water use efficiency and optimizing industrial layout are important means for Jilin Province to improve water resources carrying capacity. Based on the definition of input-output principle and water resources carrying capacity, this study combines the indicators of social welfare and water resources planning in Jilin
0 0.5 1 1.5
0 0.5 1 1.5
RESOURCE POPULATION
DISTRIBUTION
Province in 2016 to construct the water resources development efficiency model of Jilin Province and the water resources utilization efficiency model of Jilin Province. Among them, in the water resources development efficiency model of Jilin Province, each DMU selects annual precipitation, surface water resources, and groundwater resources as input indicators, and water supply as output indicators; in the water use efficiency model of Jilin Province Agricultural water, industrial water and domestic water were selected as input indicators, and GDP and population were used as output indicators. The solution of the model is implemented by Access.
Result Analysis
[image:3.595.56.542.269.451.2]According to the above method, the water resources development efficiency model of Jilin Province can be used to obtain the water resources development efficiency of various cities in Jilin Province. The results are shown in Table 1.
Table 1. Jilin Province Water Resources Development Efficiency Table.
DMU DMU Order in
Data
Technical Efficiency Score(CRS)
Pure Technical Efficiency Score(VRS)
Scale Efficiency
Score RTS
Changchun 1 1 1 1 Constant
Jilin 2 1 1 1 Constant
Siping 3 0.771 0.913 0.844 Increasing
Liaoyuan 4 0.992 1 0.992 Increasing
Tonghua 5 0.810 0.812 0.998 Increasing
Baishan 6 0.132 0.178 0.742 Increasing
Songyuan 7 1 1 1 Constant
Baicheng 8 0.8670 1 0.867 Decreasing
Yanbian 9 0.274 0.275 0.997 Increasing
Province 10 0.637 1 0.637 Decreasing
It can be seen from the above table that the development of water resources in Changchun, Jilin and Songliao has reached an optimal state. Among them, Yanbian and Baishan have the lowest water resources development efficiency. On the one hand, these areas have better natural resources, and on the other hand, the degree of development of the region is too low and there is great potential for development.
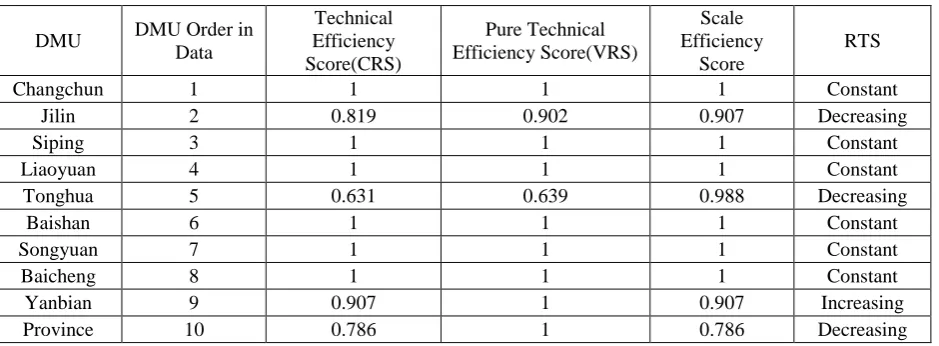
The water use efficiency of Jilin Province is shown in Table 2.
Table 2. Jilin Province Water Resources Utilization Efficiency Table.
DMU DMU Order in
Data
Technical Efficiency Score(CRS)
Pure Technical Efficiency Score(VRS)
Scale Efficiency
Score
RTS
Changchun 1 1 1 1 Constant
Jilin 2 0.819 0.902 0.907 Decreasing
Siping 3 1 1 1 Constant
Liaoyuan 4 1 1 1 Constant
Tonghua 5 0.631 0.639 0.988 Decreasing
Baishan 6 1 1 1 Constant
Songyuan 7 1 1 1 Constant
Baicheng 8 1 1 1 Constant
Yanbian 9 0.907 1 0.907 Increasing
Province 10 0.786 1 0.786 Decreasing
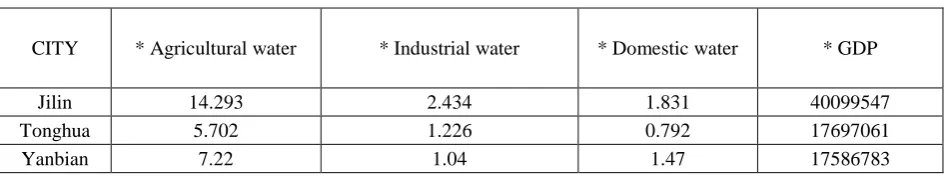
[image:3.595.66.536.559.732.2]technology and water management experience can enhance the water carrying capacity of this region. From the perspective of scale return, the scale income of Yanbian's water resources utilization increases with the input of water resources, indicating that the economic development level and water use efficiency of the region can be improved by increasing the capital, manpower and resource input of the region. The scale of income of Jilin and Tonghua is decreasing, which means that the increase of water resources investment will not bring about an increase in income, but will result in waste of resources. Therefore, it is necessary to improve the efficiency of water resources utilization through industrial transformation and upgrading and technological advancement, thereby improving the carrying capacity of water resources. Since the water use efficiency of Jilin, Tonghua and Yanbian is not optimal, it is possible to adjust the input to predict its potential output, so that the adjusted data can achieve the optimal efficiency, and then provide decision support for the actual water resources management. The results of water resource efficiency adjustment are shown in Table 3.
Table 3. Water use efficiency adjustment table.
CITY * Agricultural water * Industrial water * Domestic water * GDP
Jilin 14.293 2.434 1.831 40099547
Tonghua 5.702 1.226 0.792 17697061
Yanbian 7.22 1.04 1.47 17586783
* indicates the value that can be achieved after technical optimization
As can be seen from Table 3, using potential efficiency improvements, Jilin Province's agricultural water can be reduced by 476 million cubic meters, industrial water can be saved 802 million cubic meters, and living water saving can reach 65 million cubic meters. At the same time, it is expected to increase GDP by 63.4 billion yuan.
Conclusion
The above studies show that the current water resources distribution in Jilin Province is obviously dislocated, and the water resources in the regions with large water consumption are small. These studies show that there is a significant dislocation of the current distribution of water resources in Jilin Province, a small amount of water a large area of water consumption. Three of the nine prefecture-level cities in Jilin Province have not achieved optimal water use efficiency, accounting for 1/3 of the total. Therefore, the overall water use efficiency of Jilin Province has great potential for improvement. In particular, industrial water conservation can account for 6% of the province's total annual water consumption. Therefore, Jilin Province should optimize its industrial structure and water resources management through technological advancement. Measures to improve the efficiency of water use, and thereby enhance the carrying capacity of water resources in Jilin Province.
Acknowledgement
This work was supported by the National Key Research Program of China (No. 2016YFC0401305, 2017YFC0506603), the State Key Program of National Natural Science of China (No. 41530635), and the Project of National Natural Foundation of China (No. 51679007, 51379013).
References
[2] J.Christian-Smith, H. Cooley, P. H. Gleick, Potential water savings associated with agricultural water efficiency improvements: a case study of California, USA, Water Policy.14(2012) 194-213.
[3] Y. Liu, J. Du, J. B. Zhang, Estimation on utilization efficiency of agricultural water resource in Hubei Province, China Population Resources and Environment. 17(2007)60-65.
[4] Y.H. Ji, H.W. Zhang, L. Jiang, Water efficiency evaluation of Lanzhou based on data envelopment analysis, Resources & Industries. 14(2012) 49-52.
[5] C.Z.Sun, D. Yan, The evaluation of water resource and socio-economic sustainable using in Dalian based on the DEA model, Journal of Economics of Water Resources.26 (2008) 1-5.
[6]A. Charnes, W. W. Cooper, E. Rhodes, Measuring the efficiency of decision-making units, European Journal of Operational Research.3(1979) 339.
[7] X. M. Gu, Y. Wang, H. H. Zhao, X. D. Zhu, G. F. Lu, Linking between water resources utilization and economic growth in Jiangsu Province, China Environmental Science. 32(2012) 351-358.
[8] R. Ramanathan, U. Ramanathan, Y. Bentley, The Debate on Flexibility of Environmental Regulations, Innovation Capabilities and Financial Performance—A Novel Use of DEA , Omega- International Journal Of Management Science.75(2018)131-138.
[9]H. Gupta, K. Baruamk, A Framework to Overcome Barriers to Green Innovation in SMEs Using BWM and Fuzzy TOPSI, S. Science of the Total Environment. 633(2018)122-139.