R E S E A R C H A R T I C L E
Open Access
Low back pain patterns over one year
among 842 workers in the DPhacto study
and predictors for chronicity based on
repetitive measurements
Julie Lagersted-Olsen
1,2, Hans Bay
1, Marie Birk Jørgensen
1, Andreas Holtermann
1,2and Karen Søgaard
2*Abstract
Background:Low back pain (LBP) occurrence and intensity are considered to fluctuate over time, requiring frequent repetitive assessments to capture its true time pattern. Text messages makes frequent reporting of LBP feasible, which enables investigation of 1) the time pattern of LBP, and 2) predictors for having a continued high (chronic) level of LBP over longer periods of time. However, this has not previously been investigated in a larger working population.
The aim of this study was to examine these two aspects in a working population of 842 workers with repetitive measurements of LBP over one year.
Methods:There were 842 workers from 15 companies in the DPhacto study participating in this study.
Demographic, work- and health-related factors, and back endurance were measured at baseline, while 14 monthly repeated text message assessments of LBP intensity were prospectively collected. A factor analysis was used to cluster different time-patterns of LBP, and defining the group of participants with chronic LBP. A multi-adjusted logistic regression analysis was performed to investigate baseline predictors for chronic LBP.
Results:The factor analysis revealed two dimensions of the time pattern of LBP, defined as the LBP intensity and LBP variation, respectively. A Visual Pain Mapping was formed based on the combination of the two pain dimensions, classifying the time-patterns of LBP into four categories: (1) low intensity and low variation, (2) low intensity and high variation, (3) high intensity and high variation, (4) high intensity and low variation (defined as chronic LBP). Significant baseline predictors for chronic LBP in the fully adjusted model were high baseline LBP (p< 0.01), low workability (p< 0.01), low BMI (p< 0.05), and being a blue-collar worker (vs. white-collar worker) (p< 0.05).
Conclusion:This study presents a novel classification of the course of LBP based on repetitive measurements over a year, and revealed the predicting factors for chronic LBP based on repetitive measurements in a working population.
Keywords:Factor analysis, Low back pain, Repeated measures, Risk factors, Text messages, Visual pain mapping
* Correspondence:[email protected]
2University of Southern Denmark, Campusvej 55, 5230 Odense M, Denmark Full list of author information is available at the end of the article
Background
Musculoskeletal pain is a prevalent health issue in the working population. More than one million individuals have chronic musculoskeletal pain in Europe [1]. Low back pain (LBP) is among the leading causes of years with reduced life quality, physical activity limitation, work ability loss and absence from work worldwide [2–4]. Risk factors for developing [5–9] or not recovering [10] from LBP still remain unsettled, which hampers pre-ventive strategies towards LBP in the general population.
An explanation for the inconsistent documentation on risk factors for LBP may be the way LBP is measured [11]. Previously, LBP was often based on surveys with recall periods up to one year which inherently disregard-ing fluctuations of LBP [12]. Such long recall periods are known to introduce severe risk of recall-bias [13]. To minimize recall bias, it is recommended that recall pe-riods should not be longer than 1 month [14]. Repeated measurements of LBP at least once a month over longer periods are therefore required to elucidate the time course of LBP [15].
Until recently, methods for convenient sampling of re-peated measurements of LBP over prolonged time have been lacking. However, mobile phones and text messages have been shown to convey a feasible, practical, inexpen-sive and well-accepted method to collect responses to regular brief questions of various health conditions, such as pain [16]. Text messages with frequent pain measure-ments may therefore provide a more valid pattern of LBP over a prolonged period (e.g. one year). However, such frequent measurements of pain provide large amounts of data and currently there are no standards established on how to process such data.
Frequent measurements of LBP have up till now been mainly conducted on patient populations [17], while co-hort studies in non-patient populations using frequent LBP measurements are scarce. In non-patient popula-tions, several time-patterns of LBP may be expected (e.g. sustained low levels, fluctuating levels and chronic high levels). To capture these different patterns, there is a need for easily computed and understandable categoriza-tions based on the frequent measurements of LBP.
The aim of this study was therefore to investigate 1) the time pattern of LBP, and 2) predictors for chronic LBP with repetitive measurements of LBP over one year among 842 workers in the DPhacto study [18].
Method
This study is conducted on frequently repeated prospect-ive follow-up measurements of LBP and descriptprospect-ive base-line characteristics from the Danish Physical Activity Cohort with Objective Measurements (DPhacto) [18]. The main purpose of the cohort was to investigate the associ-ation between physical activity at work and the pattern of
musculoskeletal pain among blue-collar workers in a pro-spective design with frequent pain measurements. DPhacto was evaluated by The Research Ethics Commit-tee of The Capital Region of Denmark (H-2-2012-011) and the Danish Data Protection Agency, and the protocol has been described in details elsewhere [18]. The compan-ies in the DPhacto cohort were mainly recruited in collab-oration with a labour union representative. And all participants provided informed written content prior to participate. The workers and management at the com-panies agreed upon that participation was voluntary, and would not influence the workers work status. Moreover, the management only attained information from the study on group level, not on the level of the individual worker.
Study population
Approximately 2000 workers from 15 different compan-ies in the manufacturing, cleaning and transportation sector in Denmark were invited to participate in the study. The flow of the recruitment of the study popula-tion is illustrated in Fig. 1. Blue-collar workers with a variety of physically demanding work tasks were the pri-mary target population. However, also administrative white-collar workers in 12 of the 15 companies were of-fered participation. Both blue- and white-collar workers were included in the analyses.
[image:2.595.305.538.429.672.2]Data collection
Data were collected from April 2012 to May 2014 with stepwise inclusion of companies. Workers were invited to participate in one-hour baseline measurements car-ried out by trained research personnel at the specific worksites during working hours. The baseline measure-ments included a computer based questionnaire and physical examination. Subsequently, workers were in-vited to participate in a one-year follow up on musculo-skeletal pain occurrence and intensity.
Baseline questionnaire
The questionnaire is described in detail in a previous paper [18]. It included questions regarding socio-demographic measures (e.g. gender, age, country of birth), education, work and employment along with physical and mental health. The present paper focuses on the questions and re-sponse options described in the following.
Employment status was categorically evaluated by the question “Are you employed as blue-collar or white-collar worker?”. Seniority was evaluated by the question
“For how long time have you had the kind of occupation as you have now? Respond in years and months”. Answers were recalculated to total number of months. Work ability was evaluated by the question “Please rate your present work ability?”[19] rated on a scale from 0– 10, with 0 being the worst and 10 being the best work ability. Physical strain at work was evaluated by the question “How physically demanding do you normally consider your present work?” [20], and rated on a scale from 1–10, with 1 being the least and 10 the most de-manding work. Finally, LBP at baseline was evaluated by the question“On a scale of 0–10, grade the worst pain you have experienced in your lower back within the past three months? (Modified from [12]) and rated on a scale from 0– 10, with 0 being no pain and 10 the worst possible pain”
Physical examination
The physical examination included measurements of body height, body mass and a back endurance test [21]. BMI was calculated from body height and mass (kg/m2). In the back endurance test, participants were asked to lie prone on a plinth on the floor and lift and hold their upper body free from the floor for as long as possible. Workers re-ported extensive back pain 7 days prior to testing could choose not to participate in this particular test.
Frequent prospective measurements on musculoskeletal pain intensity
Musculoskeletal pain intensity was collected by text messages every fourth week during the one-year follow-up period (i.e. 14 repeated assessments of LBP over one year). First, workers received a message introducing that the research questions were about to be sent to them,
immediately followed by a text message with the ques-tion (“On a scale of 0–10, grade the worst pain you have experienced in your lower back within the past month? (0 = no pain, 10 = worst possible pain)” (modified from [12]). Participants received the first round of questions in the week of baseline measurement, followed by 13 additional rounds covering the one-year of follow-up. The questions were given on Sundays with a reminder on Mondays. If the reminder was not answered, personal follow-up by telephone calls was attempted at least three times during the following week. Distribution of ques-tions and registration of answers were handled by trained research personnel using the Internet based soft-ware“SMS-Track®”(https://sms-track.com).
Inclusion/exclusion criteria
For inclusion in the analyses for the present paper, workers were required to answer at least 12 (85 %) of the 14 follow-up questions of low back pain. Twelve out of 14 answers were considered as necessary to properly reveal the pattern and variation of LBP during the follow-up period. Workers were excluded during the one-year follow-up if they chose to terminate participa-tion in the project or left the workplace.
Data analyses
If answers were given in text (instead of numbers, as re-quired), it was manually recoded into an adequate number. For example the answer “I have had no pain in the past month”was recoded as 0 and“My pain has been five on a scale from 0 to 10”was recoded as 5. If the text was insuffi-cient for valid interpretation, the answer was recoded to missing. All cleaning of data were performed by trained re-search personnel and verified by a data manager.
Statistical analyses
IBM SPSS Statistics 20 was used for processing and cleaning of all data as well as some basic descriptive sta-tistics. SAS Enterprise Guide 5.1 was used for additional calculations and all statistical analyses.
A Pearson correlation analysis was used to investigate the correspondence between the pain variables.
To further reduce and simplify the data, a factor ana-lysis was applied. The factor anaana-lysis reduces the eight pain variables to two (independent) factors. Only these two factors were retained for rotation in an orthogonal varimax rotation, ensuring that the factors were uncorre-lated for easier interpretation.
The allocation of the pain variables by the correlation and the factor analysis were used to describe the respect-ive factors. The factors were treated independently from each other, and were made normally distributed with
mean = 0 and spread = 1. A factor was accepted as an in-dependent factor if having an eigenvalue > 1.
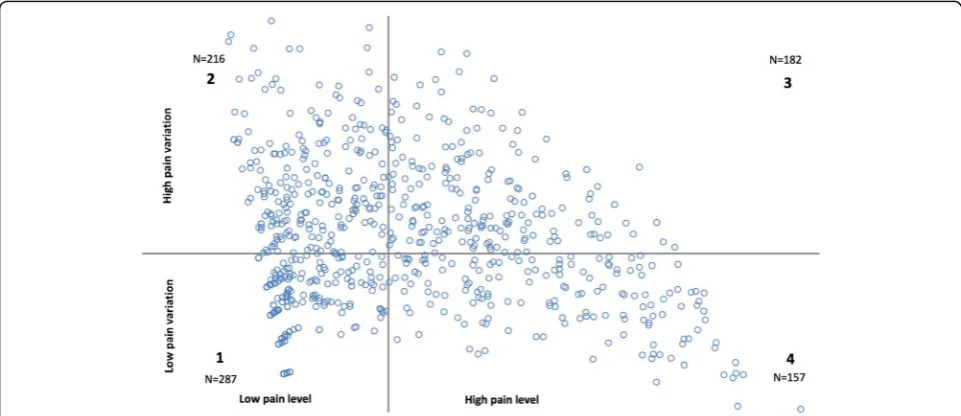
Furthermore, the dimensions of pain defined by the factor analysis were combined in a constructed Visual Pain Mapping (Fig. 2). The Visual Pain Mapping is a summarized graphical description of the LBP experience of each participant during the one-year follow up period. The mapping is based on the factor values of LBP ex-tracted from the population, and not depending on an apriority determined cut-point of LBP intensity.
Logistic regression was applied to test the association between baseline demographic variables and the LBP di-mensions estimated from the repetitive LBP measure-ments over the following year. Three models were tested: model 1: Crude analysis, model 2: Adjusted for age and gender, model 3: Adjusted for age, gender, BMI, back endurance, baseline LBP intensity, sector, seniority, workability and physical strain in work. Due to multicol-linearity, the model is not adjusted for position (i.e. be-ing blue-collar or white-collar worker).
Odds ratios were considered as statistically significant ofp< 0.05.
Results
Study population
[image:4.595.57.289.110.235.2]From the invited 2107 workers, 1087 blue- and white-collar workers provided informed consent and partici-pated in baseline measurements, and 1018 engaged in the one-year follow-up on musculoskeletal pain by text messages (Fig. 1). Sixty-nine workers declined to partici-pate in the follow-up on musculoskeletal pain due to
Table 1Descriptive characteristic of the eight constructed variables of low back pain (N= 842)
Pain variables Mean (SD) Range
Accumulated LBPa 32.5 (28.8) 0–137
Mean LBP 2.4 (2.1) 0–9.8
Median LBP 2.1 (2.3) 0–10
LBP > 2 5.5 (5.1) 0–14
LBP > 4 2.9 (4.1) 0–14
LBP = 0 5.2 (5.2) 0–14
Standard deviation 1.3 (0.8) 0–4.3
Variation spanb 4.2 (2.7) 0–10
The eight constructed low back pain variables are calculated from the 12–14 repeated measures of low back pain intensity for each worker included from the DPhacto. LBP = low back pain. SD = Standard deviation. Mean and SD presents mean LBP intensity of the eight pain variables
a
Accumulated LBP = summation of all LBP intensity scores for each worker
b
Variation span = numeric difference between the workers highest and lowest LBP intensity rating
[image:4.595.57.538.486.694.2]lack of interest, not having a mobile phone or being un-able to handle text messages.
The majority of workers (62 %) completed the follow-up on LBP with a response rate of 100 %. Among the participants included in the follow-up, 3 % did not re-spond to any text messages, and 10 % rere-sponded to less than half of the text messages.
The study population included in the statistical ana-lyses were 842 workers (82 %), who met the inclusion criteria of answering 12 or more of the 14 received ques-tions (Fig. 1).
The 842 workers responding to 12–14 questions about LBP intensity provided a total of 11,511 assessments of LBP over the one-year period. As expected in a general working population, the assessments are highly orien-tated towards low LBP intensity with 37 % of the an-swers being 0, and 69 % of the anan-swers being less than 4 on the LBP intensity scale from 0 to 10.
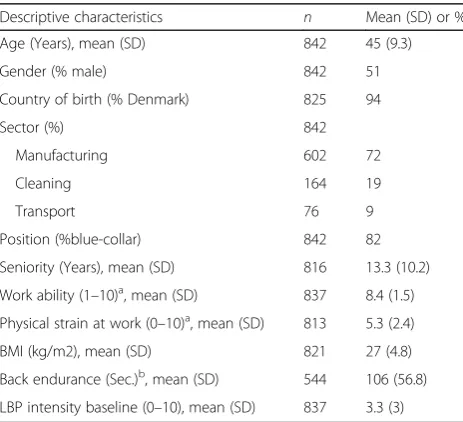
Characteristics of the population are presented in Table 2. The 842 workers have an equal gender distribu-tion and an average age of 45 years. The majority of the population is blue-collar workers, and the manufacturing sector is strongly represented with 72 %. Seniority ranged from workers just being hired to workers with seniority of 45 years.
Grouping of the pain variables using factor and correlation analyses
The factor analysis was performed on the eight extracted LBP variables, and resulted in two factors with eigen-values > 1, suggesting a two factor distribution. The
eigenvalues for dividing into two factors were 1.5, with a degree of explanation of 92 %.
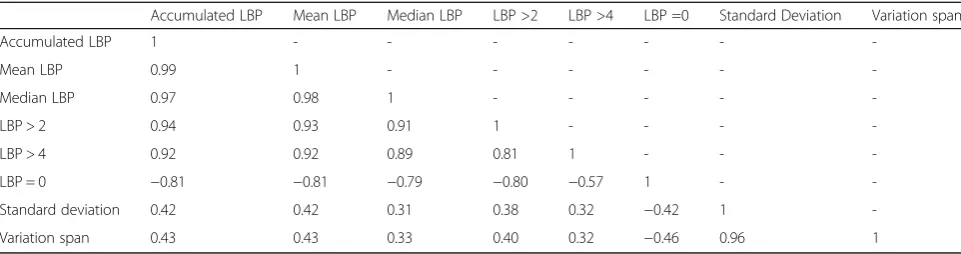
The factor analysis is supported by the correlation analysis between the same eight extracted LBP variables (Table 3). The correlation analysis revealed fairly high agreement between accumulated LBP, mean LBP, median LBP and LBP > 2, LBP > 4, and LBP = 0, with correlations ranging from 0.99 – 0.57. These LBP variables were all poorly correlated with the two variables: standard devi-ation and varidevi-ation span, with 0.46 as the highest correl-ation. However, the standard deviation and the variation span were highly correlated with each other, with a cor-relation of 0.96.
Therefore, the factor analysis and the correlation ana-lysis suggest a clear grouping of the eight LBP variables into two meaningful dimensions. Each dimension was given an explanatory title: “Pain Level” (i.e. comprising the LBP variables: accumulated LBP, mean LBP, median LBP, LBP < 2, LBP < 4 and LBP = 0) and“Pain Variation”
(i.e. comprising the LBP variables: standard deviation and variation span).
Visual pain mapping
The two dimensions; Pain Level and Pain Variation
were combined in a Visual Pain Mapping (Fig. 2). The first factor representing Pain Level defines the x-axis and the second factor representing Pain Variation de-fines the y-axis. The axes crosses at the factor value 0; their mean values, thereby dividing the Visual Pain Map-ping into the following four categories:
1. LowPain Leveland lowPain Variation: the workers generally having no or a low LBP intensity.
2. LowPain Leveland highPain Variation: the workers generally having no or low LBP intensity, but occasionally experiencing episodes with higher levels of LBP.
3. HighPain Leveland highPain Variation: the workers generally having high intensity of LBP, but
occasionally experience episodes with low or no LBP. 4. HighPain Leveland lowPain Variation: the workers
who generally have a sustained high LBP intensity, which is defined in this study as having chronic LBP.
[image:5.595.57.289.495.706.2]The visual pain mapping presents the distribution of workers within the four categories of LBP based on the coordinates from their two factor values. Since the two factors are normally distributed, the population should mainly divide equally between the four categories. Nevertheless, the allocation of the workers is slightly skewed. Category 1 contains the highest number of workers (N= 287), but also presents the smallest spread (Fig. 2). This is due to the skewed distribution of LBP ratings in this population with many workers generally
Table 2Descriptive characteristics of the study population in Dphacto,N= 842
Descriptive characteristics n Mean (SD) or %
Age (Years), mean (SD) 842 45 (9.3)
Gender (% male) 842 51
Country of birth (% Denmark) 825 94
Sector (%) 842
Manufacturing 602 72
Cleaning 164 19
Transport 76 9
Position (%blue-collar) 842 82
Seniority (Years), mean (SD) 816 13.3 (10.2)
Work ability (1–10)a, mean (SD) 837 8.4 (1.5)
Physical strain at work (0–10)a, mean (SD) 813 5.3 (2.4)
BMI (kg/m2), mean (SD) 821 27 (4.8)
Back endurance (Sec.)b, mean (SD) 544 106 (56.8)
LBP intensity baseline (0–10), mean (SD) 837 3.3 (3)
SDstandard deviation,BMIBody Mass Index,LBPlow back pain
a
High workability and low physical strain at work is preferable
b
having no or a low LBP level during the follow-up period. In category 2 and 4 the spread of the distribution of workers are rather large because of the capturing of the extreme cases; workers who experience either a large variation imposed on a general low pain level (top left of category 2) and workers with constant high pain level (right bottom of category 4). Category 3 represents the workers generally having high intensity of LBP, but occa-sionally experience episodes with low or no LBP. In this category there are no extreme cases in the outer corner of the map.
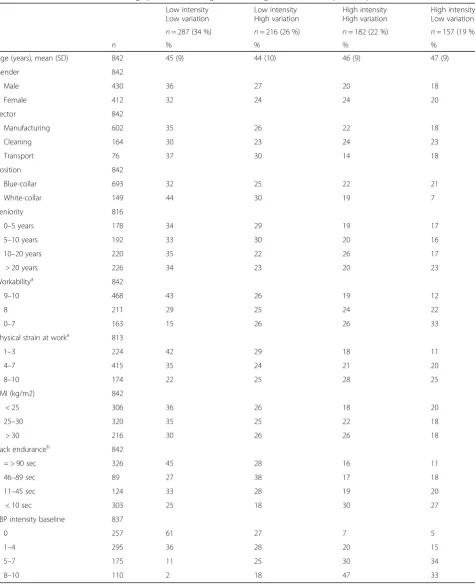
Descriptive characteristics for each of the four pain categories are presented in Table 4. As expected, the baseline characteristics tend to differ between the four categories. Males are overrepresented in the lower pain categories and females are overrepresented in the higher pain categories, but there is a large sector-related gender distribution with most females in cleaning and most males in transportation and workers from the cleaning sector seem to be overrepresented in the higher pain categories. Blue-collar workers show similar tendencies as cleaners, while the distribution of white-collar workers is highly skewed towards the lower pain cat-egories. Workers with high work ability, low physical strain at work, high back endurance and low LBP inten-sity at baseline tend to be overrepresented in category 1, and correspondingly the workers with the opposite char-acteristics tend to be overrepresented in category 4. There is a small tendency of more workers with BMI < 25 to be located in category 1, compared to workers with higher BMI. No clear tendencies are seen for seniority.
Baseline risk factors for chronic LBP
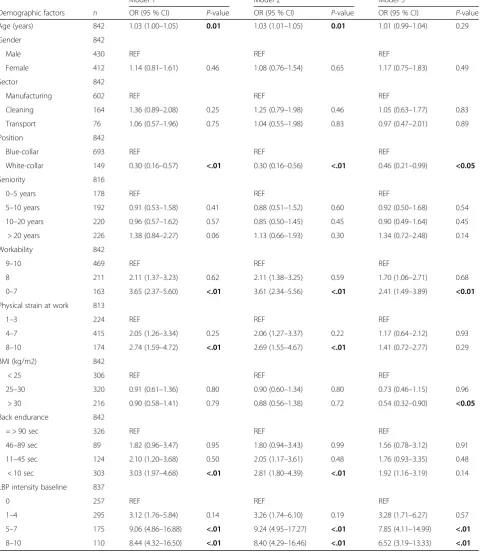
The logistic regression analysis, presented in Table 5, shows the baseline risk factors for having chronic LBP (LBP category 4). In the fully adjusted model, workers with high LBP intensity at baseline (i.e. the two groups with 5–7 and 8–10) had significantly elevated odds
ratios (OR: 7.85 and 6.52) for chronic LBP compared to workers with no LBP at baseline.
Moreover, workers with low work ability (0–7) had a significantly increased odds ratio (OR: 2.41) for chronic LBP compared to workers with high work ability (9–10). White-collar workers were found to have a significantly lower odds ratio (OR: 0.46) for chronic LBP compared to blue-collar workers. No significant odds ratios were found for physical strain at work, back endurance, age, gender and seniority in model 3. Surprisingly, workers with high BMI (>30) were observed to have significantly lower odds ratio (OR: 0.54) for chronic LBP compared to workers with low BMI (<25).
Discussion
The aim of this prospective study was to investigate the time pattern of LBP and baseline predictors for chronic LBP with repetitive measurements of LBP over one year in a working population. A factor analysis, based on eight LBP variables constructed from the repeatedly measured LBP, provided two main dimensions: pain level and pain variation. The two dimensions were transformed into a Visual Pain Mapping disclosing four categories describing the experienced pain over the past year with follow-up measures. This methodological ap-proach identified the group of workers with high pain and low variation, termed as chronic LBP. The main sig-nificant baseline characteristics increasing the risk of be-ing classified with chronic LBP were low work ability, high baseline LBP, the position as a blue-collar worker and surprisingly, also low BMI.
[image:6.595.57.538.98.225.2]The factor analysis indicates that the two dimensions of pain level and pain variation as well as the four dis-tinct combinations (i.e. the combination of high and low of pain level and pain variation) can be used to categorize pain patterns based on one-year registrations. Previous studies have typically used clusters [23], trajec-tories [24] or pattern recognition [3, 25] to categorize
Table 3Correlation matrix between the eight constructed variables of low back pain (LBP) in Dphacto,N= 842 (p< 0.001)
Accumulated LBP Mean LBP Median LBP LBP >2 LBP >4 LBP =0 Standard Deviation Variation span
Accumulated LBP 1 - - -
-Mean LBP 0.99 1 - - -
-Median LBP 0.97 0.98 1 - - - -
-LBP > 2 0.94 0.93 0.91 1 - - -
-LBP > 4 0.92 0.92 0.89 0.81 1 - -
-LBP = 0 −0.81 −0.81 −0.79 −0.80 −0.57 1 -
-Standard deviation 0.42 0.42 0.31 0.38 0.32 −0.42 1
-Variation span 0.43 0.43 0.33 0.40 0.32 −0.46 0.96 1
Table 4Distribution of baseline demographics in the four generated categories of low back pain in Dphacto,N= 842 Low intensity
Low variation
Low intensity High variation
High intensity High variation
High intensity Low variation
n= 287 (34 %) n= 216 (26 %) n= 182 (22 %) n= 157 (19 %)
n % % % %
Age (years), mean (SD) 842 45 (9) 44 (10) 46 (9) 47 (9)
Gender 842
Male 430 36 27 20 18
Female 412 32 24 24 20
Sector 842
Manufacturing 602 35 26 22 18
Cleaning 164 30 23 24 23
Transport 76 37 30 14 18
Position 842
Blue-collar 693 32 25 22 21
White-collar 149 44 30 19 7
Seniority 816
0–5 years 178 34 29 19 17
5–10 years 192 33 30 20 16
10–20 years 220 35 22 26 17
> 20 years 226 34 23 20 23
Workabilitya 842
9–10 468 43 26 19 12
8 211 29 25 24 22
0–7 163 15 26 26 33
Physical strain at worka 813
1–3 224 42 29 18 11
4–7 415 35 24 21 20
8–10 174 22 25 28 25
BMI (kg/m2) 842
< 25 306 36 26 18 20
25–30 320 35 25 22 18
> 30 216 30 26 26 18
Back enduranceb 842
= > 90 sec 326 45 28 16 11
46–89 sec 89 27 38 17 18
11–45 sec 124 33 28 19 20
< 10 sec 303 25 18 30 27
LBP intensity baseline 837
0 257 61 27 7 5
1–4 295 36 28 20 15
5–7 175 11 25 30 34
8–10 110 2 18 47 33
Demographical distribution of the four categories of LBP: (1)‘Low Pain Level and low Pain Variation’, (2)‘Low Pain Level and high Pain Variation’, (3)‘High Pain Level and high Pain Variation’and (4)‘High Pain Level and low Pain Variation’
SDstandard deviation,BMIbody mass index,LBPlow back pain
a
High workability and low physical strain at work is preferable
b
Table 5Baseline predictors for chronic low back pain (LBP) in Dphacto,N= 842
Model 1 Model 2 Model 3
Demographic factors n OR (95 % CI) P-value OR (95 % CI) P-value OR (95 % CI) P-value
Age (years) 842 1.03 (1.00–1.05) 0.01 1.03 (1.01–1.05) 0.01 1.01 (0.99–1.04) 0.29
Gender 842
Male 430 REF REF REF
Female 412 1.14 (0.81–1.61) 0.46 1.08 (0.76–1.54) 0.65 1.17 (0.75–1.83) 0.49
Sector 842
Manufacturing 602 REF REF REF
Cleaning 164 1.36 (0.89–2.08) 0.25 1.25 (0.79–1.98) 0.46 1.05 (0.63–1.77) 0.83
Transport 76 1.06 (0.57–1.96) 0.75 1.04 (0.55–1.98) 0.83 0.97 (0.47–2.01) 0.89
Position 842
Blue-collar 693 REF REF REF
White-collar 149 0.30 (0.16–0.57) <.01 0.30 (0.16–0.56) <.01 0.46 (0.21–0.99) <0.05
Seniority 816
0–5 years 178 REF REF REF
5–10 years 192 0.91 (0.53–1.58) 0.41 0.88 (0.51–1.52) 0.60 0.92 (0.50–1.68) 0.54
10–20 years 220 0.96 (0.57–1.62) 0.57 0.85 (0.50–1.45) 0.45 0.90 (0.49–1.64) 0.45
> 20 years 226 1.38 (0.84–2.27) 0.06 1.13 (0.66–1.93) 0.30 1.34 (0.72–2.48) 0.14
Workability 842
9–10 469 REF REF REF
8 211 2.11 (1.37–3.23) 0.62 2.11 (1.38–3.25) 0.59 1.70 (1.06–2.71) 0.68
0–7 163 3.65 (2.37–5.60) <.01 3.61 (2.34–5.56) <.01 2.41 (1.49–3.89) <0.01
Physical strain at work 813
1–3 224 REF REF REF
4–7 415 2.05 (1.26–3.34) 0.25 2.06 (1.27–3.37) 0.22 1.17 (0.64–2.12) 0.93
8–10 174 2.74 (1.59–4.72) <.01 2.69 (1.55–4.67) <.01 1.41 (0.72–2.77) 0.29
BMI (kg/m2) 842
< 25 306 REF REF REF
25–30 320 0.91 (0.61–1.36) 0.80 0.90 (0.60–1.34) 0.80 0.73 (0.46–1.15) 0.96
> 30 216 0.90 (0.58–1.41) 0.79 0.88 (0.56–1.38) 0.72 0.54 (0.32–0.90) <0.05
Back endurance 842
= > 90 sec 326 REF REF REF
46–89 sec 89 1.82 (0.96–3.47) 0.95 1.80 (0.94–3.43) 0.99 1.56 (0.78–3.12) 0.91
11–45 sec 124 2.10 (1.20–3.68) 0.50 2.05 (1.17–3.61) 0.48 1.76 (0.93–3.35) 0.48
< 10 sec 303 3.03 (1.97–4.68) <.01 2.81 (1.80–4.39) <.01 1.92 (1.16–3.19) 0.14
LBP intensity baseline 837
0 257 REF REF REF
1–4 295 3.12 (1.76–5.84) 0.14 3.26 (1.74–6.10) 0.19 3.28 (1.71–6.27) 0.57
5–7 175 9.06 (4.86–16.88) <.01 9.24 (4.95–17.27) <.01 7.85 (4.11–14.99) <.01
8–10 110 8.44 (4.32–16.50) <.01 8.40 (4.29–16.46) <.01 6.52 (3.19–13.33) <.01
and describe pain categories. These methods all differ from the factor analysis used in the present study as they typically define theoretically based definitions of the dif-ferent categories, to classify individuals. The factor ana-lysis is an easily conducted statistical approach based on data from the study population, which in this case pro-vided theoretically sound classifications of the popula-tion based on the repetitive measurements of LBP.
The present study is conducted among a working popu-lation with no pre-specified assumptions of LBP intensity level. Previous studies on the course of LBP have typically been conducted on patient populations, who are diag-nosed, based on pain intensity at baseline and subse-quently have received treatment during the follow-up period [26]. Thus patients in these studies are, compared to the present study, pre-classified by having initial pain high enough to seek professional care. Moreover, the pa-tients receive treatment, which together with the regres-sion towards the mean provide a strong hypothesis that their pain intensity level will decrease during the follow-up, thereby providing a template for a pattern based clas-sification. This is not comparable to the present study, which is novel in describing LBP over a longer period in a working population with a large variety of LBP. As the workers do not have a common starting point or follow a specific pattern of development over time, a different ap-proach was needed to properly classify the working popu-lation and identify the workers that may be at risk of aggravating towards chronic LBP. The Visual Pain Map-ping, formed by the two LBP dimensions; pain level and pain variation, potentially seems to be a useful tool for this categorization and description of the workers in a selected population based on their LBP intensity ratings.
Baseline predictors for chronic LBP
Workers, with the baseline descriptive characteristics of high LBP intensity, low work ability or were blue-collar workers, had a significantly increased risk (model 3) of presenting with a chronic pain pattern in the one-year prospective follow-up. This corresponds well with known risk factors in the literature [27–29]. Moreover, in contrast to what was expected, we found a tendency of a decrease in risk with higher BMI. This association was significant for high BMI (>30) in model 3. No differ-ences between the BMI groups were found regarding gender, age, seniority, work ability, physical strain in work, baseline LBP, gender, sector or position. Only back endurance tended to a difference with longer endurance in the low BMI group (133 s.) then in the high BMI group (69 s.). Since a high endurance could be supposed to protect from pain this difference does not offer an ex-planation for the higher risk of LBP in the low BMI group. Surprisingly, we found no clear indication of gen-der or seniority being a risk factor.
Strengths and limitations
A main strength of this study with repetitive pain mea-sures is the novelty in the choice of population of workers distinguished from the literature mainly con-ducted among patients. Furthermore, the high response rates in this study ensure a reliable picture of the natural course of low back pain, as an essential premise for a correct classification.
A limitation to this type of analyses is the highly skewed data towards no or low pain creating a floor ef-fect of the data. This prevents a true normal distribution of the two factors and an even distribution of the workers in the 4 categories. The cut-points between high and low pain level and variation are, as previously de-scribed, statistically founded based on the actual popula-tion and not relying on theoretical pain intensity considered clinically important based on other popula-tions as often used in previous studies.
A limitation of the data on LBP in this study is that only intensity of LBP is recorded with no registration of dur-ation [30]. It is therefore not possible to determine whether the reported LBP consists of multiple single pain events or one (or more) coherent periods. Furthermore, the variation within the month is also not investigated, which potentially could influence the assessment of LBP [31]. We therefore recommend future studies to also col-lect data on duration of pain and with an even higher fre-quency than the monthly recordings of this study.
Practical implications
This study is explorative in the search to investigate characteristics of the time-pattern of LBP from repetitive measurements of LBP over one year in a working popu-lation. The presented novel method is easy to apply on repetitive data and is especially suited for use in both re-search and by practitioners working with prevention of LBP in the field. Future studies using frequent measure-ments of LBP are however required for documenting the time-pattern of LBP and predictors for chronic LBP in working populations. The Visual Pain Mapping is easy to apply on repetitive data and is especially suited for use by clinicians working with prevention of LBP in the field.
Prospectively, a next step could be to analyse if the chronic pain category has a predictive validity with re-spect to sickness absence and premature dropout from the labour market.
Conclusion
ability, low BMI, and being a blue-collar worker. More studies using frequent measurements of LBP are re-quired for further documenting the time-pattern of LBP and predictors for chronic LBP in working populations.
Abbreviations
DPhacto:Danish physical activity cohort with objective measurements; LBP: Low back pain
Acknowledgement
We would like to thank the entire DPhacto research group, personnel who contributed to the data collection, especially Dorte Ekner and Klaus Hansen, and the data managers at NRCWE for handling of the huge amount of text message data. We would also like to thank all 15 workplaces that participated in the study and‘3F’and‘Falck Healthcare’for excellent collaboration in the data collection for the DPhacto cohort.
Funding
The study was partly financed by a grant from the Danish government (Satspulje).
Availability of data and material
The datasets generated during and/or analysed during the current study are available from the corresponding author on reasonable request.
Authors’contributions
AH and MBJ designed the DPhacto study. AH, MBJ, KS and JLO discussed the content and the statistical analyses of the present paper. HB and JOL performed all statistical analyses. JLO was responsible for drafting the manuscript especially with support from AH and KS. All authors have read and commented on the draft and approved the final version of the manuscript.
Competing interests
The authors declare that they have no competing interests.
Consent for publication “Not applicable”.
Ethics approval and consent to participate
The study is an analysis of the Danish Physical Activity Cohort with Objective Measurements (DPhacto). DPhacto was evaluated by The Research Ethics Committee of The Capital Region of Denmark (H-2-2012-011) and the Danish Data Protection Agency, and the protocol is described in details in the ref [19] included in the paper.
Author details 1
The National Research Centre for the Working Environment (NRCWE), Lersø Parkalle 105, 2100 Copenhagen Ø, Denmark.2University of Southern Denmark, Campusvej 55, 5230 Odense M, Denmark.
Received: 18 January 2016 Accepted: 21 October 2016
References
1. Bevan S, Quadrello T, McGee R, Mahdon M, Vavrovsky A, Barham L. Fit For Work? Musculoskeletal Disorders and the Swedish Labour Market. 2009. http://www.fitforworkeurope.eu/Website-Documents/ffw_Sweden151009b. pdf.
2. Dunn KM, Hestbaek L, Cassidy JD. Low back pain across the life course. Best Pract Res Clin Rheumatol. 2013;27:591–600.
3. Kongsted A, Leboeuf-Yde C. The Nordic back pain subpopulation program– individual patterns of low back pain established by means of text messaging: a longitudinal pilot study. Chiropr Osteopat. 2009;17:11. 4. Lidgren L. The Bone and Joint Decade 2000–2010. Editorial. Bull World
Health Organ. 2003;81(9).
5. Rubin DI. Epidemiology and risk factors for spine pain. Neurol Clin. 2007;25: 353–71.
6. Hartvigsen J, Leboeuf-Yde C, Lings S, Corder EH. Review Article: Is sitting-while-at-work associated with low back pain? A systematic, critical literature review. Scand J Public Health. 2000;28:230–9.
7. Leboeuf-Yde C. Body weight and low back pain. A systematic literature review of 56 journal articles reporting on 65 epidemiologic studies. Spine. 2000;25:226–37.
8. Leboeuf-Yde C. Smoking and low back pain. A systematic literature review of 41 journal articles reporting 47 epidemiologic studies. Spine. 1999;24: 1463–70.
9. Thiese MS, Hegmann KT, Garg A, Porucznik C, Behrens T. The predictive relationship of physical activity on the incidence of low back pain in an occupational cohort. J Occup Environ Med. 2011;53:364–71.
10. Kent PM, Keating JL. Can we predict poor recovery from recent-onset nonspecific low back pain? A systematic review. Man Ther. 2008;13: 12–28.
11. Wai EK, Roffey DM, Bishop P, Kwon BK, Dagenais S. Causal assessment of occupational bending or twisting and low back pain: results of a systematic review. Spine J. 2010;10:76–88.
12. Kuorinka I, Jonsson B, Kilbom A, Vinterberg H, Biering-Sørensen F, Andersson G, et al. Standardised Nordic questionnaires for the analysis of musculoskeletal symptoms. Appl Ergon. 1987;18:233–7.
13. Miranda H, Gold JE, Gore R, Punnett L. Recall of prior musculoskeletal pain. Scand J Work Environ Health. 2006;32:294–9.
14. Axén I, Bergström G, Bodin L. Using few and scattered time points for analysis of a variable course of pain can be misleading: an example using weekly text message data. Spine J. 2014;14:1454–9.
15. van den Hoogen HJM. On the course of low back pain in general practice: a one year follow-up study. Ann Rheum Dis. 1998;57:13–19.
16. Johansen B, Wedderkopp N. Comparison between data obtained through real-time data capture by SMS and a retrospective telephone interview. Chiropr Osteopat. 2010;18:10.
17. Axén I, Bodin L, Kongsted A, Wedderkopp N, Jensen I, Bergström G. Analyzing repeated data collected by mobile phones and frequent text messages. An example of Low back pain measured weekly for 18 weeks. BMC Med Res Methodol. 2012;12:105.
18. Jørgensen M, Korshøj M, Lagersted-Olsen J, Villumsen M, Mortensen O, Skotte J, et al. Physical activities at work and risk of musculoskeletal pain and its consequences: protocol for a study with objective field measures among blue-collar workers. BMC Musculoskelet Disord. 2013; 14:213.
19. Ahlstrom L, Grimby-Ekman A, Hagberg M, Dellve L. The work ability index and single-item question: associations with sick leave, symptoms, and health–a prospective study of women on long-term sick leave. Scand J Work Environ Health. 2010;36:404–12.
20. Borg E, Kaijser L. A comparison between three rating scales for perceived exertion and two different work tests. Scand J Med Sci Sports. 2006;16:57–69.
21. Biering-Sørensen F. Physical measurements as risk indicators for low-back trouble over a one-year period. Spine. 1984;9:106–19.
22. Von Korff M, Ormel J, Keefe FJ, Dworkin SF. Grading the severity of chronic pain. Pain. 1992;50:133–49.
23. Macedo LG, Maher CG, Latimer J, McAuley JH, Hodges PW, Rogers WT. Nature and determinants of the Course of Chronic Low Back Pain Over a 12-Month Period: A Cluster Analysis. Phys Ther. 2014;94:210–21. 24. Verkleij SPJ, Hoekstra T, Rozendaal RM, Waarsing JH, Koes BW, Luijsterburg
PAJ, et al. Defining discriminative pain trajectories in hip osteoarthritis over a 2-year time period. Ann Rheum Dis. 2012;71:1517–23.
25. Axén I, Bodin L, Bergström G, Halasz L, Lange F, Lövgren PW, et al. Clustering patients on the basis of their individual course of low back pain over a six month period. BMC Musculoskelet Disord. 2011;12:99. 26. Von Korff M, Saunders K. The course of back pain in primary care. Spine.
1996;21:2833–7. 2839.
27. da Costa BR, Vieira ER. Risk factors for work-related musculoskeletal disorders: a systematic review of recent longitudinal studies. Am J Ind Med. 2010;53(3):285–323.
28. Yildirim Y, Gunay S, Karadibak D. Identifying factors associated with low back pain among employees working at a package producing industry. J Back Musculoskelet Rehabil. 2014;27(1):25–32.
29. Driscoll T, Jacklyn G, Orchard J, Passmore E, Vos T, Freedman G, et al. The global burden of occupationally related low back pain: estimates from the Global Burden of Disease 2010 study. Ann Rheum Dis. 2014; 73:975–81.
an occupational setting: an exploratory analysis. Scand J Work Environ Health [Internet]. 2016. Available from: http://www.sjweh.fi/show_abstract. php?abstract_id=3584. Accessed 25 Oct 2016.
31. Jespersen T, Jørgensen MB, Hansen JV, Holtermann A, Søgaard K. The relationship between low back pain and leisure time physical activity in a working population of cleaners - a study with weekly follow-ups for 1 year. BMC Musculoskelet Disord. 2012;13:28.
• We accept pre-submission inquiries
• Our selector tool helps you to find the most relevant journal
• We provide round the clock customer support
• Convenient online submission
• Thorough peer review
• Inclusion in PubMed and all major indexing services
• Maximum visibility for your research
Submit your manuscript at www.biomedcentral.com/submit