Available online on www.ijpsr.com 637 IJPSR (2011), Vol. 2, Issue 3 (Research Article)
Received on 08 November, 2010; received in revised form 10 January, 2011; accepted 02 February, 2011
ANALYTICAL METHOD DEVELOPMENT AND VALIDATION FOR THE SIMULTANEOUS ESTIMATION OF PIOGLITAZONE AND GLIMEPIRIDE IN TABLET DOSAGE FORM BY RP-HPLC
Ravi Sharma*1, Gagan Sharma 1, Darpan Chopra 1 and Pavan Kumar Jain 2
Choksi Laboratories Limited 1, Manoramaganj, Indore, Madhya Pradesh, India Shri Ramnath Singh College of Pharmacy 2, Gormi, Bhind, Madhya Pradesh, India
ABSTRACT
A simple reverse phase liquid Chromatographic method has been developed and subsequently validated for simultaneous determination of Pioglitazone and Glimepiride in combination. The separation was carried out using a mobile phase of phosphate buffer (pH-4.5): Acetonitrile (45:55) v/v and using methanol as diluent. The column used was Inertsil ODS (250 mm x 4.6 mm i.d., 5μm) with flow rate of 1 ml/min using UV detection at 225 nm. The described method was linear over a concentration range of 5-50µg/ml and 5-25 µg/ml for the assay of Pioglitazone and Glimepiride respectively. The retention times of Pioglitazone and Glimepiride were found to be4.6 and 7.7min respectively. Results of analysis were validated statistically and by recovery studies. The results of the study showed that the proposed RP-HPLC method is simple, rapid, precise and accurate, which is useful for the routine determination of Pioglitazone and Glimepiride bulk drug and in its pharmaceutical dosage form.
Keywords:
Pioglitazone, Glimiperide, Simultaneous Estimation,
RP-HPLC
Correspondence to Author:
Mr Ravi Sharma
Available online on www.ijpsr.com 638
INTRODUCTION: Pioglitazone (PIO) is a
thiazolidinedione antidiabetic agent. Chemically Pioglitazone 1 is [(+) - 5- [[4- [ (5-ethyl- 2-pyridinyl) ethoxy] phenyl] methyl] - 2, 4-] thiazolidinedione monohydrochloride. It is not official in BP, USP, EP and IP. Literature surveys revealed method of analysis for pioglitazone and glimepiride in single dosage form by HPLC. Glimepiride (GLI) 2 is a sulfonyl urea antidiabetic agent. Chemically glimepiride is 1- [[p- [2- (3- ethyl-4- methyl- 2- oxo- 3- pyrroline- 1- carboxamido) ethyl] phenyl] sulfonyl] - 3- (trans- 4- methylcyclohexyl) urea. It is official in BP 3, USP 4 but not official in IP till 2007. Pioglitazone and Glimepiride in combined tablet dosage form 5 are available in the market.
This paper presents the method for estimation of Pioglitazone and Glimepiride as two component dosage form was developed on RP-HPLC 6-7. The statistical treatment of the assay of both the components reveals that these methods are precise, robust, rugged and accurate 8-9. So far, no method has been reported for estimation of PIO and GLI in combined dosage form has less retention time by HPLC, hence we attempted to develop a simple, accurate, and economical analytical method. This paper describes validated RP-HPLC for simultaneous estimation of PIO and GLI in combination, using phosphate buffer (pH 4.5) and Acetonitrile (45:55) v/v and using methanol as diluent. The column used was Inertsil ODS (250 mm x 4.6 mm i.d., 5μm) with flow rate of 1 ml /min using UV detection 10-11 at 225 nm. Experimental:
Chemicals, reagents and Instrumental Conditions: Standard bulk drug sample Pioglitazone and Glimepiride were provided by Ranbaxy Laboratories Ltd., Dewas (M.P.), in the month of May, 2010. Tablets of combined dosage form were procured from the local market. All other reagents used were of HPLC grade. Chromatographic
separation was performed on a Shimadzu LC-20 AT HPLC (Double pump). Wavelength of detection 10-11 chosen was 225nm. A reverse phase Inertsil ODS (250 mm x 4.6 mm i.d., 5μm) column was used for the analysis. The mobile phase comprised of a mixture of phosphate buffer (pH-4.5) and Acetonitrile (45:55) v/v and using methanol as diluent with a flow rate of 1ml/min. The injection volume was 10 μL.
Preparation of working standard solutions, and sample solution: A standard solution of PIO (sol-1) was prepared, by taking 150 mg of PIO was transferred to 50ml volumetric flask and 25ml of diluent was added and sonicated to dissolve, then was made up to the mark with the diluent. A standard solution of GLI (sol-2) was prepared, by taking 20 mg of GLI was transferred to 100ml volumetric flask and 50ml of diluent was added and sonicated to dissolved, then was made up to the mark with the diluent. A standard mixed solution of PIO and GLI (100 ml) was prepared, by taking 5ml of each solution, accurately weighed, in separate 100-ml volumetric flasks. They were dissolved in mobile phaseand then the volumewas made up to the mark to get PIO-150 μg/ml, GLI-20μg/mL. For test solution 20 tablets were taken and weighted, powdered and triturated well. A quantity of tablet powder equivalent to average weight was mixed with methanol (50ml) and the volume made up to 100ml to get final test solution of 150:20 μg/ml. For each drug, appropriate aliquots were pipetted and were filtered through a 0.45μm Teflon filter. Method validation:
Linearity: The developed method has been
Available online on www.ijpsr.com 639 concentration of the drug solution. Calibration
curves of PIO and GLI were obtained by plotting the peak area ratio versus the applied concentrations of PIO and GLI. The linear regression coefficients were found to be 0.9854 and 0.9926for PIO and GLI respectively.
Precision: Repeatability of the method was checked by injecting replicate injections of the solution 150μg/mL and 20μg/mL of PIO and GLI respectively and the% RSD was found to be 1.01% and 1.31%. For showing method precision six preparation of sample is prepared at 100% of nominal concentration was prepared by same analyst and injected in duplicate. The average area
thus obtained is used to calculate the assay of all six preparations. After calculation of assay %RSD of all six assays is calculated and found to be 1.01% and 1.31% for pioglitazone and glimepiride respectively.
[image:3.612.53.559.288.690.2]Accuracy: Accuracy of the method was tested by carrying out recovery studies at different spiked levels. The estimation was carried out as described earlier. At each level, three determinations were performed and results obtained. The amounts recovered and the values of percent recovery were calculated, results are shown in Table 1 and Table 2.
TABLE 1: RECOVERY STUDIES OF PIO (n=6)
Std 157.6 mg in to 50ml 5 ml in to 100 ml
Potency 99.6%w/w
Test X mg in to 50ml 5 ml in to 100 ml
Std Area 1845869 1845670 Avg. 1845766 Factor 0.9072 Test Area Amount Added Amount Recovered % Recovery
50% 998591 77.05 77.03 100.0
50% 987899 76.21 76.14 100.1
50% 985323 76.01 75.82 100.3
100% 1892136 145.97 147.84 98.7
100% 1890544 145.84 146.74 99.4
100% 1889536 145.77 144.87 100.6
150% 2897581 223.53 225.96 98.9
150% 2896537 223.45 224.84 99.4
150% 2890859 223.01 222.96 100.0
Mean 99.71
SD 0.6344
%RSD 1.0
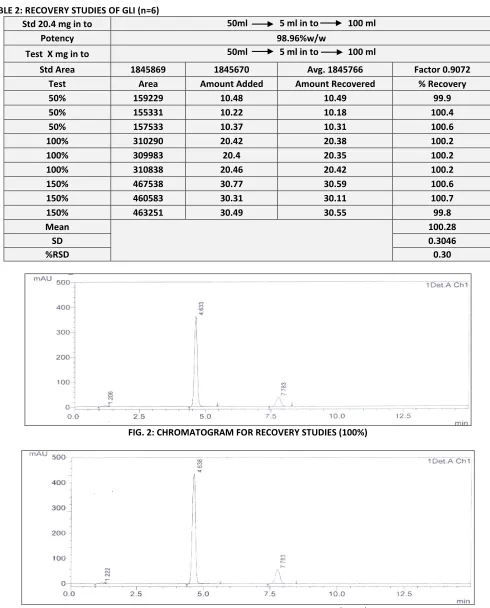
Available online on www.ijpsr.com 640 TABLE 2: RECOVERY STUDIES OF GLI (n=6)
Std 20.4 mg in to 50ml 5 ml in to 100 ml
Potency 98.96%w/w
Test X mg in to 50ml 5 ml in to 100 ml
Std Area 1845869 1845670 Avg. 1845766 Factor 0.9072 Test Area Amount Added Amount Recovered % Recovery
50% 159229 10.48 10.49 99.9
50% 155331 10.22 10.18 100.4
50% 157533 10.37 10.31 100.6
100% 310290 20.42 20.38 100.2
100% 309983 20.4 20.35 100.2
100% 310838 20.46 20.42 100.2
150% 467538 30.77 30.59 100.6
150% 460583 30.31 30.11 100.7
150% 463251 30.49 30.55 99.8
Mean 100.28
SD 0.3046
%RSD 0.30
[image:4.612.58.548.68.676.2]FIG. 2: CHROMATOGRAM FOR RECOVERY STUDIES (100%)
Available online on www.ijpsr.com 641 Specificity: The specificity of the method was
checked for the interference of impurities in the analysis of a blank solution (without any sample) and then a drug solution of 20 μg/mL was injected into the column, under optimized chromatographic conditions, to demonstrate the separation of both PIO and GLI from any of the impurities, if present. As there was no interference of impurities and also no change in the retention time, the method was found to be specific and also confirmed with the results of analysis of formulation.
Robustness: To determine the robustness of the method, experimental conditions such as the composition of the mobile phase, pH of the mobile phase, and flow rate of the mobile phase were altered and the chromatographic characteristics were evaluated. No significant change was observed.
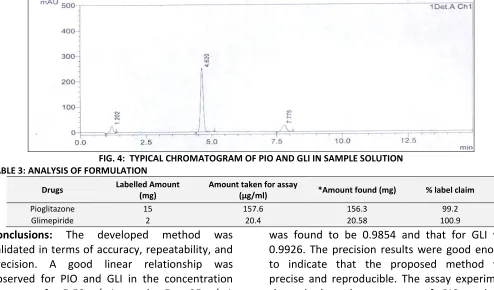
[image:5.612.55.549.379.669.2]Analysis of Formulation: Twenty tablets of PIO and GLI in combination were weighed, their average weight was determined, and finally they were crushed to a fine powder. The tablet powder equivalent to 150mg of PIO and 20mg of GLI was weighed and transferred to a 100mL volumetric flask, first dissolved in 50mL of mobile phase, and then the volume was made up to the mark with the mobile phase. The content was ultrasonicated for 20 min for complete dissolution. The solution was then filtered through a 0.45μm. The selection of the mixed sample solution for analysis was carried out by the optimization of various dilutions of the tablet dosage form, considering the label claim. The results of tablet analysis (n= 6) were found to be 99.2 and 100.9 for PIO and GLI respectively. From the typical chromatogram of PIO and GLI was found that the retention time of PIO was 4.6 min and GLI was 7.7 min. The results analysis is shown in Table 3.
FIG. 4: TYPICAL CHROMATOGRAM OF PIO AND GLI IN SAMPLE SOLUTION TABLE 3: ANALYSIS OF FORMULATION
Drugs Labelled Amount
(mg)
Amount taken for assay
(μg/ml) *Amount found (mg) % label claim
Pioglitazone 15 157.6 156.3 99.2
Glimepiride 2 20.4 20.58 100.9
Conclusions: The developed method was
validated in terms of accuracy, repeatability, and precision. A good linear relationship was observed for PIO and GLI in the concentration ranges of 5-50μg/mL and 5- 25μg/mL respectively. The correlation coefficient for PIO
Available online on www.ijpsr.com 642 from the interference of excipients. This
demonstrated that the developed HPLC method was simple, linear, precise, and accurate, and could be conveniently adopted for the routine quality control analysis of PIO and GLI simultaneously, from its pharmaceutical formulations and bulk drug.
REFERENCES:
1. Weetman SC: Martindale the Complete Reference.
Pharmaceutical Press, Edition 35th: 1: 2006.
2. Budarvari S: et al., the Merck Index. An encyclopedia of Chemicals, Drugs and Biologicals. Merck Research Laboratory, Division of Merck and Co. Inc, Whitehouse Station NJ, Edition 14: 2006.
3. British pharmacopoeia. Licensing division HMSO,
Norwich. 2003, 357
4. USP 23/NF18. General Chapter <1225>, Validation of compendial methods. suppl. 10, Rockville, MD, United States Phramacopoeial Convention, 1995:5059-5062. 5. Banker GS: Drug Products. Modern Pharmaceutics.
Marcel Dekker Inc, New York, Edition 4, 1989:1.
6. Sethi PD: Quantitative Analysis of Drugs in
Pharmaceutical formulations, CBS Publishers and Distributors, New Delhi, Edition 3, 2003:1.
7. Valcarcel M: Analytical Chemistry and Quality. Principles of Analytical Chemistry, Springer (India) Private Limit, New Delhi, 2000: 2, 310-311.
8. International Conference on Harmonization, (ICH) Q2A: Text on Validation of Analytical Procedures, 1995 9. International Conference on Harmonization, (ICH) Q2B:
Validation of Analytical Procedures: Methodology, 1996. 10. Pavia DL, Lampman GM and Kriz GS: Ultraviolet Spectroscopy. Introduction to Spectroscopy, Harcourt College Publishers, Edition 3, 2001: 353-358.
11. Sharma BK: Spectroscopy. Instrumental Methods of Chemical Analysis, Goel Publishing House, Meerut, Edition 22, 2002:49-54.