Full Length Research Article
STUDY ON MENOPAUSAL SYMPTOMS AMONG WOMEN RESIDING IN URBAN AND RURAL AREAS
*
Savita, Nidhi Sagar and Jasbir Kaur
College of Nursing, DMC&H, Ludhiana, India
ARTICLE INFO ABSTRACT
Background: Menopausal symptoms are experienced by almost every woman during their menopausal transitions. Menopausal symptoms are categorized into physical and psychological menopausal symptoms. It includes, night sweats, hot flushes, unusual tiredness, depression, mood swings, loss of sexual urge, frustration and other behavioural changes are also seen. The objectives of the study were to assess and compare the menopausal symptoms, and its association with selected socio-demographic variables among women residing urban and rural areas of district Ludhiana, Punjab. A comparative study was conducted on 100 women residing in urban and rural areas of district Ludhiana who had achieved menopausal within last 1 year. Convenience sampling technique was used to draw the sample. Structured 5 point Likert scale was used to assess the menopausal symptoms among urban and rural women residing in district Ludhiana, Punjab. Present study revealed that mean age of menopause in urban women was 49.78 years whereas in rural women was 48.28 years. Regarding menopausal symptoms (as per physical symptoms) most of the women residing in urban and rural areas experienced unusual tiredness (81% and 84% respectively) whereas as per psychological symptoms, most of women in urban area experienced depression (52%) and in rural area most of women experienced mood swings and forgetfulness (70%). The factors like menopausal history, lifestyle pattern were found to be significant whereas age, menstrual history, BMI were found to be non-significant. It has been concluded that menopausal symptoms were more prevalent among rural women than urban, association of lifestyle pattern and menopausal history was found statistically significant.
Copyright © 2015 Savita, Nidhi Sagar and Jasbir Kaur. This is an open access article distributed under the Creative Commons Attribution License, which permits unrestricted use, distribution, and reproduction in any medium, provided the original work is properly cited.
INTRODUCTION
Women’s health has been a global concern for many decades. Under current demographic trends menopausal and post menopausal health has emerged as an important concern in India, owing to improved economic conditions, rapid life style changes and increased longevity. With the increasing life expectancy a women spends almost 1/3rd of life in menopause. In developing countries the mean age of menopause is 44-45 yrs. Menopausal symptoms are those symptoms that women experience during the menopause transition and after menopause, like hot flushes, breast tenderness, decrease in libido and other body problems.Studies show that exercises may ease feelings of stress, anxiety and depression. Yoga, in particular, has also been linked to bring improvements in menopausal symptoms including hot flushes and sleep disturbances.
Statement of the problem
A comparative study to assess the menopausal symptoms among women residing in urban and rural areas of District Ludhiana, Punjab.
*Corresponding author: Savita, Nidhi Sagar, College of Nursing, DMC&H, Ludhiana, India.
Objectives of the study
To assess the menopausal symptoms among women residing in urban and rural areas
To compare menopausal symptoms among women residing in urban and rural areas
To find out association of menopausal symptoms among women residing in urban and rural areas with selected socio demographic characteristics.
MATERIALS AND METHODS
Research design: A comparative research design was used in the study.
Research setting: This study was conducted in the urban settings of Haibowal kalan and rural settings of Alamgir village of district Ludhiana, Punjab.
Sample: Menopausal women residing in urban settings of Haibowal kalan and rural settings of Alamgir village of district Ludhiana, Punjab.
Sample size: The sample size was 100, (50) women from rural area and (50) women from urban area.
ISSN: 2230-9926
International Journal of Development Research
Vol. 5, Issue, 11, pp. 5987-5992, November,2015
DEVELOPMENT RESEARCH
Article History:
Received 22nd August, 2015
Received in revised form 26th September, 2015
Accepted 13th October, 2015 Published online 30th November, 2015
Key Words:
Sampling technique: Convenience sampling technique was adopted for this study
Description of tool: The tool consisted of two parts
Part 1- It included sociodemographic and clinical profile of menopausal women like age, education, occupation, monthly income, life style, dietary habits, Menopausal history, Body Mass Index (BMI).
Part 2- It consisted of 5 point likert scale to assess the menopausal symptoms.
Ethical consideration: It was a comparative study and hence did not include any intervention on subjects verbal consent was taken from all the subjects. They were assured that their responses would be kept confidential.
[image:2.595.96.502.335.555.2]RESULTS
Table No. 1 describes the socio demographic profile of urban and rural menopausal women (50 urban & 50 rural).
It revealed that more than half of the subject i.e. 28(56%) in urban area and 34(68%) in rural area were in age group of 45-50 years. As per education, nearly half of the subjects 23(46%) had elementary education in urban area, whereas more than half of the subjects 27(54%) were illiterate in rural area. According to occupation, most of the subjects both in urban area 44(88%) and in rural area 47(94%) were non-working respectively. As per monthly family income, more than half of the subject 26(52%) had family income > Rs. 10000 per month in urban area, whereas, nearly half of the subjects 24(48%) had family income Rs. ≤5000 per month in rural area. According to lifestyle, most of the subjects in urban area 35(70%) and more than half of the subjects in rural area 30(60%) were moderate workers. Regarding dietary habits, most of the subjects both in urban area 40(80%) and in rural area 42(84%) were vegetarian. Hence, it can be concluded that both the group were homogenous as per age, occupation
dietary habits and lifestyle. Table No. 2 describes clinical profile of urban and rural menopausal women (50 urban and 50 rural). Regarding menstrual history 44(88%) of menopausal women in urban area and 39(78%) in rural area had regular menstruation. Related to menopausal history, equal number of subject i.e. 39(78%) had natural menopause in both urban and rural area.
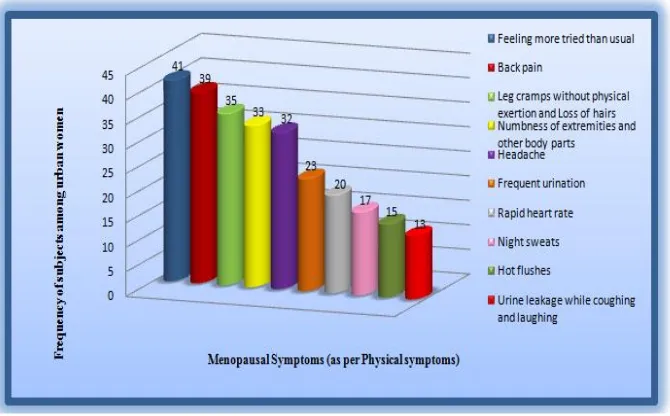
Furthermore about B.M.I 39(78%) of menopausal women in urban and 31(62%) in rural area were overweight. Hence, it can be concluded that the both groups were homogenous in terms of menstrual history, menopausal history and B.M.I. Figure 2(a) reveals the distribution of physical symptoms among urban women. In urban areas, maximum number of subjects (41) felt more tired than usual followed by 39 had back pain. Whereas minimum number of the subjects (15) experienced hot flushes followed by 13 subjects had urine leakage while coughing and laughing. Figure 2(b) reveals the distribution of psychological menopausal symptoms among urban women.
It depicts maximum number of subjects (26) felt more depressed than usual followed by half of subjects (25) experienced frequent mood changes, whereas least number of subjects (10) experienced trouble in concentration followed by only 2 felt worried about not able to bear up and not able to satisfy her husband.
Figure 3(a) depicts distribution of menopausal symptoms as per physical symptoms among rural women. Most of the subjects (42) experienced more tiredness than usual whereas only 19 had frequent urination. Figure 3(b) depicts the distribution of menopausal symptoms as per psychological symptoms among rural women. It reveals maximum number of subjects (35) forgot things more easily than usual whereas only 2 women felt worried about not able to bear up and satisfy her husband. Table No. 4 and figure 4 show
Section-1 Frequency and percentage distribution of urban and rural menopausal women as per their socio-demographic profile
N=100
Socio demographic profile Urban (n=50) f (%) Rural (n=50) f (%) Total (%) χ2 statistics
Age (in years) 45-50 51-55 28 (56) 22 (44) 34 (68) 16 (32) 62 38
χ2 =1.152
df=1 p=0.21NS
Education Illiterate Elementary Secondary Graduate & Above
09 (18) 23 (46) 04 (08) 14 (28) 27 (54) 18 (36) 02 (04) 03 (06) 36 41 06 17
χ2=17.3
df=3 p=0.0004* Occupation Working Non-working 06 (12) 44 (88) 03 (06) 47 (94) 09 91
χ2=1.09
df=1 p=0.29NS
Monthly Family Income (in Rs.) ≤5000 5001-10000 ˃10000 13(26) 11(22) 26(52) 24(48) 17(34) 09(18) 37 28 35
χ2=12.8
df=2 =0.0015NS
Lifestyle Sedentary Moderate Heavy 09 (18) 35 (70) 06 (12) 11 (22) 30 (60) 09 (18) 20 65 15
χ2=1.18
df=2 p=0.55NS
Dietary habits Vegetarian Non-vegetarian 40(80) 10(20) 42(84) 08(16) 82 18
χ2=0.27
df=1 p=0.60NS
comparison of menopausal symptoms among urban and rural women. It reveals that most of the subjects 46(92%) in urban area followed by 41(82%) in rural area had mild menopausal symptoms whereas least number of subjects 09(18%) among rural area followed by 04(08%) among urban area had moderate menopausal symptoms.
Table No.5 describes the association of socio demographic variables (age, lifestyle, menstrual history, menopausal history and BMI) with the severity of menopausal symptoms among women residing in urban and rural areas. As per age, in the age group of 45-50 years 25(50%) women residing in urban area on the other hand 27(54%) of women residing in rural area had mild menopausal symptoms. As per lifestyle more than half 33(66%) of moderately working residing in urban area whereas nearly half 24(48%) of women residing in rural
area had mild menopausal symptoms. Regarding menstrual history 41(82%) of women had regular menstrual history residing in urban area whereas more than half 33(66%) of women residing in rural area had mild menopausal symptoms. According to menopausal history 38(76%) women had natural menopause residing in urban area.
[image:3.595.110.471.173.273.2]On the other hand 33(66%) of women residing in rural area had mild menopausal symptoms. Regarding BMI 35(70%) of women with overweight residing in urban area whereas half 25(50%) of women residing in rural area had mild menopausal symptoms. Hence, it can be concluded that lifestyle and menopausal history was found to be statistically significant at p≤0.05.
Table 2. Frequency and percentage distribution of urban and rural menopausal women as per their Clinical profile
N=100 Clinical Profile Urban (n=50) f (%) Rural (n=50) f (%) Total (%) χ2 statistics
Menstrual history Regular Irregular 44 (88) 06 (12) 39 (78) 11 (22) 83 17
χ2 =1.77
df=1 p=0.183NS
Menopausal history Natural Surgical 39 (78) 11 (22) 39 (78) 11 (22) 78 22
χ2 =0.00
df=1 p=1NS
BMI Normal Overweight 11 (22) 39 (78) 19 (38) 31 (62) 30 70
χ2 =3.04
[image:3.595.99.479.326.361.2]df=1 p=0.08NS NS: Non-significant
Table 4. Comparison of menopausal symptoms (as level of severity) among urban and rural women
N=100 Severity menopausal symptoms Urban (n=50) f(%) Rural (n=50) f(%) Total (%) χ2 Statistics
MILD MODERATE 46 (92)
04 (08)
41 (82) 09 (18)
87 13
χ2 =2.21 df=1 p=0.137NS
[image:3.595.45.538.432.641.2]NS=Non-significant: Yates correction applied
Table 5. Association of socio-demographic variables with severity of menopausal symptoms among urban and rural women
N=100
Socio-demographic variables Severity of menopausal symptoms (Urban) Mild Moderate
χ2 statistics Severity of menopausal symptoms (Rural)
Mild Moderate
χ2 statistics
Age (in years) 45-50 51-55 25 21 3 1
χ2 =0.63
df=1 =0.42NS 27 14 7 2
χ2 =0.48
df=1 p=0.48NS Lifestyle Sedentary work Moderate work Heavy work 8 33 5 1 2 1
χ2 =0.97 df=2 p=0.61NS 10 24 7 1 6 2
χ2 =6.15 df=2 p=0.04* Menstrual history Regular Irregular 41 5 3 1
χ2 =0.69
df=1 p=0.40NS 33 8 6 3
χ2 =0.82
df=1 p=0.36NS Menopausal history Natural Surgical 38 8 1 3
χ2 =7.11
df=1 p=0.0075* 33 8 6 3
χ2 =0.82
df=1 p=0.36NS BMI Normal Overweight 11 35 0 4
χ2 =1.22
df=1 p=0.26NS 17 25 2 6
χ2 =0.68
df=1 p=0.40NS
Figure 1. Mean age of menopause among women residing in urban and rural area
Figure 2(a). Frequency distribution of menopausal symptoms (as per physical symptoms) among urban women
[image:4.595.129.464.285.493.2] [image:4.595.127.470.540.723.2]DISCUSSION
In present study the 82% of the menopausal women had mild and 18% had moderate level of severity of menopausal symptoms in rural area whereas 92% of women had mild, and 8% had moderate level of severity of menopausal symptoms in urban area. It reveals that menopausal symptoms were more prevalent among rural women. This study is contradictory to study conducted by Sagdeo M.M. & Arora Dimple (2011) reported that, all menopausal symptoms were more in urban women as compared to rural cases. The findings of this study are contradicting to present study.
Conclusion
It has been concluded that menopausal symptoms were more prevalent among rural women than urban and lifestyle pattern and menopausal history were found statistically significant.
Acknowledgement: Authors extend their sincere and heartfelt thanks from core of their heart to their beloved parents, teachers and friends who supported them financially and mentally thorough out the course of their research study.
Conflict of interest: None
Source of funding: Self
Ethical consideration: A written permission for conducting the study was taken from ethical committee of DMC Hospital, Ludhiana as well as Principal, DMC, College of Nursing, Ludhiana, before starting the study. An informed written consent was obtained from each subject.
REFERENCES
Madhukumar Suwarna, Gaikwad Vaishali and D Sudeepa. A Community Based Study on Perceptions about Menopausal
Figure 3(a). Frequency distribution of menopausal symptoms (as per physical symptoms) among rural women
[image:5.595.111.479.57.257.2] [image:5.595.108.483.313.522.2]Symptoms and Quality of Life of Post Menopausal Women in Bangalore Rural. International Journal of Health
Sciences and Research June 2012;2(3):49-56.
Making menopause easier, Accessed from http://www.indiatogether.org/2006
Sagdeo M.M. and Arora Dimple. Menopausal Symptoms: A comparative Study in Rural and Urban Women. Journal of
medical education & research Jan-March 2011; 13(1):
23-26. Available at http://www.jkscience .org Shaw’s Textbook of Gynaecology Menopausal 2002
World Health Organization. Research on the menopausal in the 1990s: Report of a WHO Scientific Group. World
Health Organ Technical Report Sept 1996.