8279
THE EFFECTS OF ICT COMPETENCIES AND WEBSITE
DESIGN ON E-SERVICE WEB PORTAL INFORMATION
QUALITY IN SAUDI UNIVERSITIES
1 MOHAMMED AL MASARWEH
1Management Information System, Collage of Business in Rabigh, King Abdulaziz University, Saudi
Arabia.
E-mail: [email protected]
ABSTRACT
The rapid improvement of the Internet over the past two decades has offered immense opportunities to state and private sector organizations to improve their electronic services (e-services), and in Saudi Arabia there has been a major drive to promote e-services provision by universities. This study examines the relationship between information quality for e-service web portals and the factors of ICT competence and website design in Saudi universities using an online survey administered to 1327 undergraduate students from different programs and faculties in six major universities. The main results of this research indicate a significant relationship between information quality and both ICT competencies and website design. Contrary to research expectations, the effect of ICT competencies and website design on information quality did not differ according to program types. Furthermore, the findings confirm that gender moderates the effect of ICT competencies and website design on information quality. Similarly, the findings reveal some differences in the suggested relationships according to the academic level.
Keywords: E-services, Website design, Web portals, Information quality, ICT competence, Saudi Arabia, Universities.
1. INTRODUCTION
Universities pioneered the development and use of the Internet and they have spearheaded the provision of administrative services by electronic means (i.e. e-services) to students and other stakeholders, particularly in facilitating contact between students and tutors and among students themselves. The main aim of universities in adopting e-services is to provide all related information and educational data to students to facilitate service deliver (i.e. students’ educational attainment) and outreach with other stakeholders (e.g. business partnerships and alumni contacts) [1]. E-services are integrated in different systems such as e-learning systems, financial systems, registration systems, and library services [2], in order to support educational information and management issues to students, which can satisfy student needs remotely and assist in meeting quality requirements in both the educational and administrative dimensions, for students and
universities. The underlying impetus of e-services is to facilitate more efficient and effective communication and capabilities [3].
8280 Nedeva and Zlatev (2013) concluded that the richer organizations might provide better e-services to their users [2]. This will indicate the gap in providing the e-services to the students in different universities with different levels of income (i.e. richer university can provide better e-services to their students than universities with limited budgets). The main challenges to e-service provision in developing countries are those related to the costs of hardware, software and personnel associated with implementing and maintaining E-Systems, including the cost of developing and maintaining an e-service portal providing required information quality [6].
Cappielloet and Strong defined information quality as the capability of a system to gather information and data in order to meet user needs and requirements [7,8]. Cappielloet concluded that the concept of information and data quality is multi-dimensional, and Caro noted that there is a limited research related to the user understandability of information and data quality and, more specifically, the understanding of the variables of retrieval, user and web portal categories [7,9]. Moreover, based on user perceptions, the goal of the web portal is to increase the quality of finding and retrieving formation and data that can meet user needs and expectations [10].
This research explores the impacts of ICT competence and website design on the information quality of Saudi universities’ web portals, relative to specific demographic and academic factors.
2. RESEARCH BACKGROUND
2.1. Research on E-Service Quality of Website
Several studies have defined e-service portals as tools to access information, people and applications in useful and expedient ways. Furthermore, several studies have defined portals as the main way for students and staff to collect and utilize comprehensive information relating to general administrative and academic services, as well as university-related personal and financial information [2,11,12]. More technically, Daigle and Cuocco clarified the adaption of e-service portals in the universities to support the internet and web management by customizing the information content [13], improving information transfer between users [14,15]. This improves the systematization of educational information and administrative processes in universities. Administrative process include registrations, financial statues, pay tuition, research database and
e-learning gateway [16]. E-service portals provide users fast, customized services and give universities tangible commitments with users, which improve the usability of e-services portals in order to increase the user satisfaction and experience [17].
Many researchers have devised and tested models to measure the factors of e-service quality such as compensation, fulfilment, responsiveness, efficiency, contact, reliability, privacy, website design, reliability, security, customer service, tasks, intercommunication, trust, response time and interaction [18-20].
2.2. Research on Information Quality in E-Services Web Portals
The Technology Acceptance Model [21] enables comprehension of the main factors in the adoption and use of information technology systems by relating user behavior and attitudes to experiential factors such as the perceived ease-of-use and utility of the technology, which in this case is university e-services portals. User satisfaction is strongly based on the intrinsic quality of the web portal (i.e. in enabling access to required services), which includes both technical and user-friendly aspects (e.g. the latter includes aesthetics and vocabulary etc.), relative to user needs, attitudes and tastes. The quality of information accessed via the portal is characterized by factors such as transaction quality, content, safety, service interaction quality, and usability [22], as well as the accuracy, comprehension, timeliness, reliability, relevance, and appropriate format of information [23].
Moreover, many other models have conducted to determine the information quality of web portal that evaluate user attitudes, especially ease of use and usefulness [9, 10, 24-26]. Based on previous literature, there are nearly 20 factors to determine the information quality of web portal, the most important of which are related to presentation, understandability, conciseness, timeliness, relevancy, accuracy, accessibility, and completeness. This research has adopted these factors to determine the user attitude on information quality of web portals used in Saudi universities.
2.3. ICT Competences and Web Portals
8281 services offered by universities to online e-service portals due to their greater accessibility and more convenient ease of use [28, 29]. Students’ increasing ICT competence has driven the adaptability of web portals and many studies have explored the relationship between ICT competence and information quality. Based on these studies the factors of perceived and actual ease-of-use of web portals were identified as the most important factors in successful adoption, especially interface design relative to ICT competence and user experience [12, 29-33].
2.4. Research on Website Design
One of the main components of e-service systems is website design [34,35]. Website design is the key interface, which provides users access to use the internet and the e-services web portal. Earlier researchers understood website elements in terms of response time, interaction styles, consistency of the interface and mapping and metaphors [36], while more recent studies identify specific variables of website design impacts, such as usability, information design, performance, navigation design, site content, and interactivity [37,38]. Furthermore, other researchers have concluded that user satisfaction is significantly associated with the usability and design of the website [38]. In this research a number of these components have been selected for testing to measure the relationship between the website design and information quality for e-services portals in Saudi universities.
Finally, the most of the literature review have been tested the ICT competence and its effects
on information quality, however, this paper has taken both ICT competence and website design to test the effect on information quality
3. RESEARCH METHODOLOGY
The methodology for this study is based on a quantitative questionnaire. The quantitative methodology is employed to inspect the information quality of e-services web portals as perceived by students enrolled in Saudi universities in order to explore the relationships between e-services web portal information quality and both ICT competence and website design, with quantitative approach being particularly appropriate to explore the impacts of demographic and academic factors. An online survey was used in order to outline and analyze numerical data and draw conclusions and results. The following sections explain the research model, hypotheses, sampling and data screening procedures.
3.1 Research Model
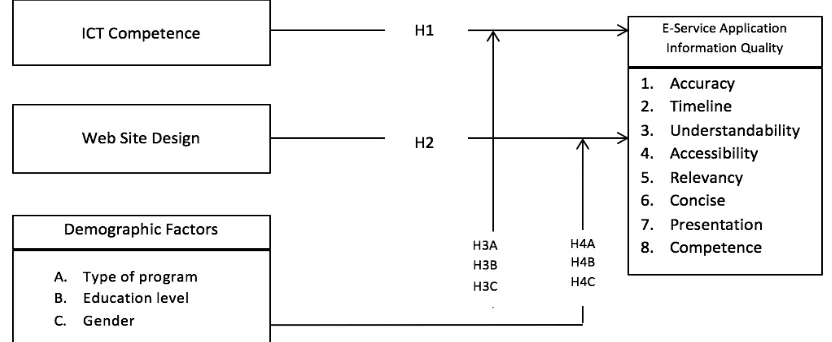
[image:3.612.105.521.527.698.2]In this research the model (Figure 1) was designed based on the common variables identified from previously literature. It comprises four main parts: ICT competence [27], website design [38], information quality variables [10] and demographic factors [39].
8282 3.2. Research Hypotheses
The following hypotheses were tested to examine the effects of ICT competence and website design on information quality:
H1: There is a significant relationship between ICT competence and information quality in Saudi universities.
H2: There is a significant relationship between website design and information quality in Saudi universities.
H3: There is a significant relationship between ICT competence and information quality in Saudi universities due to demographic characteristics.
H4: There is a significant relationship between website design and information quality in Saudi universities due to demographic characteristics.
3.3. Sub-Hypotheses
H3A: There is a significant relationship between ICT competence and information quality in Saudi universities due to program type.
H3B: There is a significant relationship between ICT competence and information quality in Saudi universities due to gender.
H3C: There is a significant relationship between ICT competence and information quality in Saudi universities due to academic year level.
H4A: There is a significant relationship between website design and information quality in Saudi universities due to program type.
H4B: There is a significant relationship between website design and information quality in Saudi universities due to gender.
H4C: There is a significant relationship between website design and information quality in Saudi universities due to academic year level.
3.4. Sampling
An online questionnaire was published and distributed to six universities in Saudi Arabia by emailing the survey link to students through their lecturer in these universities. The target respondents comprised students from several academic levels. The collected responses were 1327, which were later screened and examined for incomplete responses and credibility. In this research thus obtained 1204 (with a rate 91%) usable responses after removing (123) (with a rate 9%) responses for the reason of incomplete or unreliable responses.
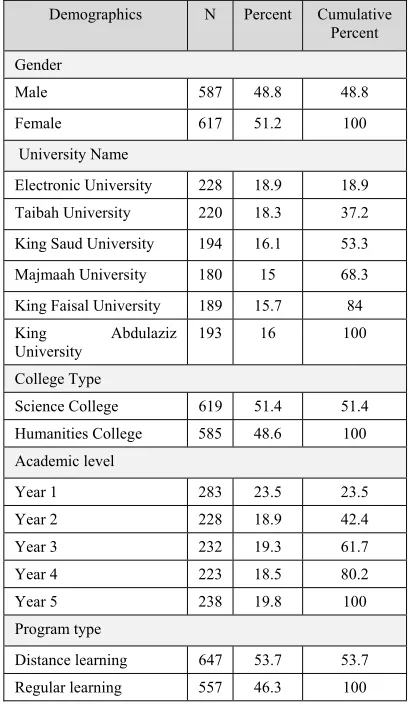
[image:4.612.315.519.357.709.2]The demographic characteristics of the sample are described in Table 1. It can be seen that the responses were fairly distributed by gender among males (49%) and females (51%). Similarly, the responses were also distributed roughly equally among science and humanity colleges. With regard to the program type, about 54% of the responses were from students registered in distance learning programs and about 46% of the responses were from students registered in the regular program. In terms of academic level, about 24% of responses came from students in the first year of undergraduate study (i.e. the first level), while the rest of the responses are distributed equally among students from the second, third, fourth, and fifth levels. Similar responses were received from the six universities, varying from 15% to 19%. This descriptive information suggests that most of the respondents had sufficient experience and knowledge to participate in the survey and to offer reliable data.
Table 1: Descriptive statics of demographic variables
Demographics N Percent Cumulative
Percent
Gender
Male 587 48.8 48.8
Female 617 51.2 100
University Name
Electronic University 228 18.9 18.9
Taibah University 220 18.3 37.2
King Saud University 194 16.1 53.3
Majmaah University 180 15 68.3
King Faisal University 189 15.7 84
King Abdulaziz
University
193 16 100
College Type
Science College 619 51.4 51.4
Humanities College 585 48.6 100
Academic level
Year 1 283 23.5 23.5
Year 2 228 18.9 42.4
Year 3 232 19.3 61.7
Year 4 223 18.5 80.2
Year 5 238 19.8 100
Program type
Distance learning 647 53.7 53.7
Regular learning 557 46.3 100
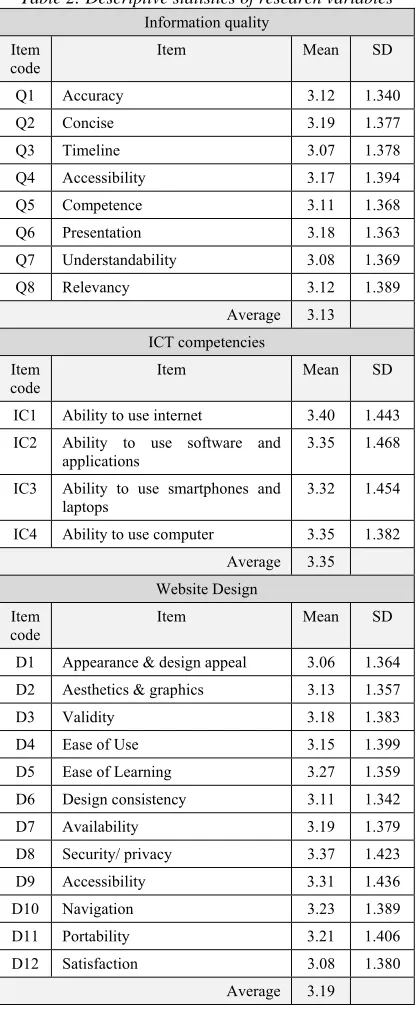
8283 The descriptive statics of the research variables and their items are presented in Table 2, which shows that the level ICT competencies, website design, and information quality are moderate, with average scores of 3.13, 3.35, and 3.19 respectively; the standard deviation (SD) of each item is also shown.
Table 2: Descriptive statistics of research variables Information quality
Item code
Item Mean SD
Q1 Accuracy 3.12 1.340
Q2 Concise 3.19 1.377
Q3 Timeline 3.07 1.378
Q4 Accessibility 3.17 1.394
Q5 Competence 3.11 1.368
Q6 Presentation 3.18 1.363
Q7 Understandability 3.08 1.369
Q8 Relevancy 3.12 1.389
Average 3.13
ICT competencies Item
code
Item Mean SD
IC1 Ability to use internet 3.40 1.443
IC2 Ability to use software and
applications
3.35 1.468
IC3 Ability to use smartphones and
laptops 3.32 1.454
IC4 Ability to use computer 3.35 1.382
Average 3.35
Website Design Item
code
Item Mean SD
D1 Appearance & design appeal 3.06 1.364
D2 Aesthetics & graphics 3.13 1.357
D3 Validity 3.18 1.383
D4 Ease of Use 3.15 1.399
D5 Ease of Learning 3.27 1.359
D6 Design consistency 3.11 1.342
D7 Availability 3.19 1.379
D8 Security/ privacy 3.37 1.423
D9 Accessibility 3.31 1.436
D10 Navigation 3.23 1.389
D11 Portability 3.21 1.406
D12 Satisfaction 3.08 1.380
Average 3.19
3.5 Data Screening
Data screening processes are engaged to include the assessment of normality, multicollinearity, and outliers prior to data analysis, in order to render subsequent inferences more valid. Screening was applied in order to confirm that the regression assumptions are attained and that the data is suitable for regression analysis. With regard to normality, level of data’s Skewness and Kurtosis were estimated for each variable, revealing values below the threshold of the absolute value of 2. This suggests that the data is normally distributed [40].
Variance inflation factor (VIF) was used to inspect multicollinearity. VIF values should be less than the threshold value of 5 to ensure that multicollinearity is not an issue [40]. The results indicated that the VIF values varied between 1.22 and 1.67, which are less than the cut-off value of 5. Therefore, this indicates that the proposed model has no multicollinearity issues.
Finally, the researcher examined if there were outlier observations and the extent to which any particular observation was far away from the normal distribution of the samples [40], utilizing Z standard score for this purpose. Typically, Z score is considered as an outlier if it is above the edge of 4 [40]. The results indicate that none of the observations were identified as an outlier, as the Z scores were below 4. Therefore, outliers are not an issue in this study.
These results confirm that the data can validly be used in regression analyses.
4. DATA ANALYSIS AND DISCUSSION
8284 constructs, and involves several moderating variables.
Two-steps analysis approach was followed to examine the research model, as recommended by Hair [41]. The first step is to assess the measurement model and the second step is to estimate the structure model. In the measurement model, the reliability and validity of the measurements is assessed. However, all variables in this study are constructed as formative constructs, because the relationship between indicators and their postulated construct is cause-and-effect, and we expect no covariance between indicators of a certain construct. According to the rule of thumb, the quality of the formative constructs is determined through content validity, multicollinearity, and weights [46].
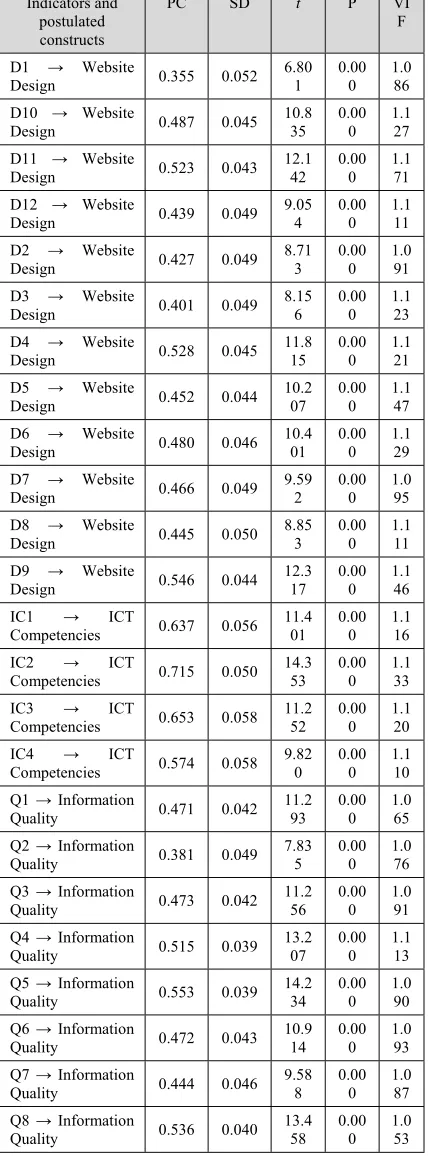
In this study content validity was ensured during the early stage of instrument development, wherein the constructs and their items were discussed with several experts in this area of research who ensured that content-semantic of items is a precise content meaning for the constructs. Moreover, Variance Inflation Factors (VIFs) were estimated to further validate the items of the construct. VIFs should be less than 5, as recommended by Hair [41]. As shown in Table 3, the VIF values are less than 2, which suggests that multicollinearity is not an issue in this study. Finally, we assessed the weight of each indicator on their postulated construct and its significance level.
According to the rule of thumb, formative indicators should be weighted sufficiently and significantly on their postulated construct [41]. As shown in Table 2, all indicators’ weights were greater than 0.1 and they are significant at 0.000, implying that our formative measurement model is valid. Since all the figures above are satisfactory, we make sure that the measurement model is suitable for testing the conceptual model.
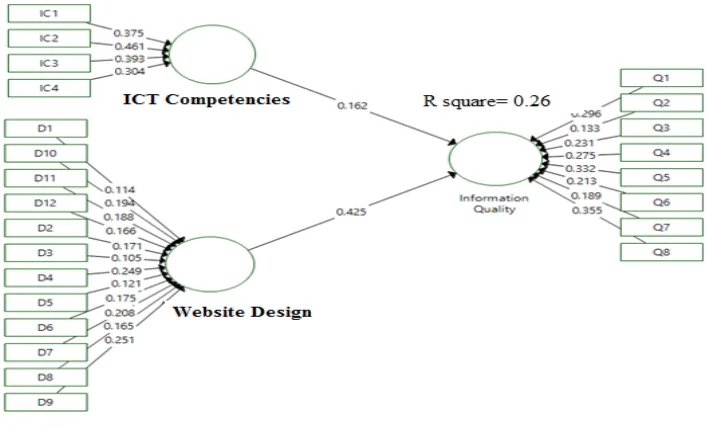
[image:6.612.106.459.466.680.2]Subsequently, the structural model was assessed with the suggested hypotheses based on the estimation of path coefficients (PC), which index the weight of each indicator, and their significance levels. The model was estimated using PLS bootstrapping procedures with 500 resamples. The result of PLS bootstrapping is presented in Table 4 and depicted in Figure 1. The result shows that the relationship between ICT competencies and information quality is positive and significant (β = 0.162, t = 5.63, p < 0.00), providing support for H1: as users’ ICT competencies increase, information quality increases too. The results also show a positive and significant relationship between website design and information quality (β = 0.425, t = 15.0, p < 0.00), which provides support for H2: a good website design is associated with higher information quality. The suggested model explains about 0.26 of the variance in information quality, as indicated by the R2.
8285
Table 3: PLS bootstrapping results for outer model Table 4: Hypothesis testing (direct effect) based on the
PLS bootstrapping results
Finally, the research model assumes that the effect of ICT competencies and website design differ according to the type of program, educational level, and gender, as stated by H3A, H3B, H3C, H4A, H4B, and H4C. Since all of these variables are categorical, moderation effect was analyzed using PLS Multi-Group Analysis (PLS- MGA). The PLS-MGA method is an important non-parametric test suggested by Sarstedt, Henseler, and Ringle [44] to compare group-specific bootstrapping PLS-SEM results. This method compares the standardized coefficients and their error across groups. According to Sarstedt [47], a specific PLS PC is significantly different among groups if the percentage (P-value of a comparison between two groups) smaller than 0.05 and higher than 0.95. A percentile less than 0.05 indicates that the PLS bootstrapping results of group 1 are greater than those of group 2. Meanwhile, a percentile higher than 0.95 suggests that the PLS bootstrapping results of group 2 are greater than those of group 1. PLS-MGA was run three times, as the suggested model contains three moderators, including program type, gender, and academic year. Table 5 compares the results of the regular and distance program, indicating that the effect of ICT competencies (H3A) and website design (H4A) on information quality do not significantly differ according to program types. Consistent with our prediction, the results in Table 6 (comparing male and female) indicate that the effect of ICT competencies (H3B) and website design (H4B) on information quality do significantly differ according to gender. These results suggest that the effect of ICT competencies on information quality is stronger for males than for females (P-value = 0.008). Meanwhile, the results show that the effect of website design on information quality is stronger for females than for males (P-value =0.98).
Indicators and postulated constructs
PC SD t P VI
F
D1 → Website
Design 0.355 0.052
6.80 1 0.00 0 1.0 86 D10 → Website
Design 0.487 0.045
10.8 35 0.00 0 1.1 27 D11 → Website
Design 0.523 0.043
12.1 42 0.00 0 1.1 71 D12 → Website
Design 0.439 0.049 9.054 0.000 1.111
D2 → Website
Design 0.427 0.049
8.71 3 0.00 0 1.0 91 D3 → Website
Design 0.401 0.049
8.15 6 0.00 0 1.1 23 D4 → Website
Design 0.528 0.045 11.815 0.000 1.121
D5 → Website
Design 0.452 0.044
10.2 07 0.00 0 1.1 47 D6 → Website
Design 0.480 0.046
10.4 01 0.00 0 1.1 29 D7 → Website
Design 0.466 0.049 9.592 0.000 1.095
D8 → Website
Design 0.445 0.050
8.85 3 0.00 0 1.1 11 D9 → Website
Design 0.546 0.044
12.3 17 0.00 0 1.1 46
IC1 → ICT
Competencies 0.637 0.056 11.401 0.000 1.116
IC2 → ICT
Competencies 0.715 0.050
14.3 53 0.00 0 1.1 33
IC3 → ICT
Competencies 0.653 0.058
11.2 52 0.00 0 1.1 20
IC4 → ICT
Competencies 0.574 0.058
9.82 0 0.00 0 1.1 10 Q1 → Information
Quality 0.471 0.042
11.2 93 0.00 0 1.0 65 Q2 → Information
Quality 0.381 0.049
7.83 5 0.00 0 1.0 76 Q3 → Information
Quality 0.473 0.042
11.2 56 0.00 0 1.0 91 Q4 → Information
Quality 0.515 0.039
13.2 07 0.00 0 1.1 13 Q5 → Information
Quality 0.553 0.039
14.2 34 0.00 0 1.0 90 Q6 → Information
Quality 0.472 0.043
10.9 14 0.00 0 1.0 93 Q7 → Information
Quality 0.444 0.046
9.58 8 0.00 0 1.0 87 Q8 → Information
Quality 0.536 0.040 13.458 0.000 1.053
Variable PC SD t P
Website
Design 0.425 0.028 15.087 0.000
ICT
[image:7.612.316.537.121.189.2] [image:7.612.85.299.128.708.2]8286 Table 5: Structural relationship and hypothesis testing
across different program types (regular vs distance)
Regular vs Distance
PC Differen
ces
P-Value*
Variables
Website Design →
Information Quality 0.036 0.262a
ICT Competencies →
Information Quality 0.044 0.757
* P-values below 0.05 and higher than 0.95 indicate significance
Table 6: Structural relationship and hypothesis testing
across genders (male vs female)
Male vs Female
PC Differe
nces
P-value
Variables
Website Design →
Information Quality 0.144 0.008a
ICT Competencies →
Information Quality 0.139 0.988
* P-values below 0.05 and higher than 0.95 indicate significance
Finally, Table 7 shows a series of comparisons of the effect of ICT competencies and website design on information quality according to academic level (per year). The results indicate that the effect of website design (H4C) on information quality differs significantly between students in the third and fifth year, whereby the effect is stronger for students in the fifth year. Meanwhile, the effect of ICT competencies (H3C) on information quality differs significantly between students in the first and third year, whereby the effect is stronger for students in the third year.
Table 7: Structural relationship and hypothesis testing
across academic levels
PC Differences Variables
Webs
ite
Desi
gn →
Information
Quality
ICT
Competen
ci
es
→
Information
Quality
1Y vs
2Ya 0.02 0.6
* 0.06 0.73
1Y vs
3Y 0.13 0.09 0.19 0.96 1Y vs
4Y
0.059 0.233 0.123 0.897
1Y vs 5Y
0.046 0.756 0.038 0.662
2Y vs
3Y 0.14 0.07 0.13 0.89 2Y vs
4Y 0.076 0.179 0.063 0.739 2Y vs
5Y 0.03 0.66 0.02 0.41 3Y vs
4Y
0.07 0.75 0.07 0.26
3Y vs 5Y
0.17 0.97 0.15 0.07
4Y vs
5Y 0.11 0.91 0.09 0.19 1Y= academic year 1; 2Y= academic year 2; 3Y= academic year 3; 4Y= academic year 4; 5Y= academic
year 5
* Values in bold represent P-values for PC differences. P-values below 0.05 and higher than 0.95
indicate significance
5. CONCLUSION
8287 the users with more experience of using the internet, applications and technology devices such as PCs and smartphones. On the other hand, the results for the second hypothesis showed that there is a positive and significant relationship between website design and e-services web portal information quality. This finding implies that a good website design is associated with high information quality. This means that the website design components has a direct effect on information quality, which can increase the user usability and satisfaction of the website.
Contrary to research expectations, the effect of ICT competencies and website design on information quality do not differ according to program types (H3A, H3B). Meanwhile, the findings confirm that gender does moderate the effect of ICT competencies and website design on information quality (H3B, H4B). Furthermore, the male in this research were spent more attention in using the ICT competence such as Internet, smartphone and applications more than the female, which effects the use and access the e-services web portal in university for information quality. On the other hand the female were spent more attention on website design of university e-services web portal and application to access information, which effect the information quality more than the male. Similarly, the findings reveal some differences in the suggested relationships according to the academic level (H3C, H4C). This indicted that the students in fifth year have spent more attention to website design according to e-services web portal for information quality more than the students in third year. As well as the students in third year have spent more attention in ICT competence in using e-service web portal more than the first year, which effect the information quality.
A summary of the hypotheses testing is shown below in Table 8. It should be noted that while all hypotheses were supported by the results, there are nuances in the findings, as reported in the previous section.
This research has successfully measured the relationships between them. tested variables and the information quality of e-service portals in Saudi universities. Further studies are needed to find out other factors that can have a direct impact and to compare these results with other (non-Saudi) contexts.
Table 8: Summary of hypotheses testing
Hypothesis Verification
H1: There is a significant relationship between ICT competence and information quality in Saudi universities.
✔
H2: There is a significant relationship between website design and information quality in Saudi universities.
✔
H3: There is a significant relationship between ICT competence and information quality in Saudi universities due to demographic characteristics.
✔
H3A: There is a significant relationship between ICT competence and information quality in Saudi universities due to program type.
✔
H3B: There is a significant relationship between ICT competence and information quality in Saudi universities due to gender.
✔
H3C: There is a significant relationship between ICT competence and information quality in Saudi universities due to academic year level.
✔
H4: There is a significant relationship between website design and information quality in Saudi universities due to demographic characteristics.
✔
H4A: There is a significant relationship between website design and information quality in Saudi universities due to program type.
✔
H4B: There is a significant relationship between website design and information quality in Saudi universities due to gender.
✔
H4C: There is a significant relationship between website design and information quality in Saudi universities due to academic year level.
8288 REFERENCES
[1] Sutarso, Y., & Suharmadi, A. Promotion of technology-based services: A case study of e-service quality at a University in Indonesia. International Journal of Business and Information, (2011), 6(1), 112-133.
[2] Nedeva, V., & Zlatev, Z. Quality of the Services Provided By a University Web Portal. Applied Researches in Technics, Technologies and Education, (2013), 1(3), 173-180.
[3] Kim-Soon, N., Abd Rahman, & Ahmed, M. E-Service Quality in Higher Education and Frequency of Use of the Service. International Education Studies, (2014), 7(3). doi:10.5539/ies.v7n3p1.
[4] Yang, C. C. Establishment and Applications of the Integrated Model of Service Quality Measurement. Managing Service Quality: An International Journal, (2003), 13(4), 310-324. http://dx.doi.org/10.1108/0960452031048472 5
[5] Vratskikh, I., Al-Lozi, M., & Maqableh, M. The Impact of Emotional Intelligence on Job Performance via the Mediating Role of Job Satisfaction. International Journal of Business and Management, (2016), 11, 69-91. https://doi.org/10.5539/ijbm.v11n2p69 [6] Bringula, R. P., & Basa, R. S. Factors
Affecting Faculty Web Portal Usability. Educational Technology & Society, (2011), 14(4), 253-265.
[7] Cappielloet, C., Francalanci, C., & Pernici, B. Data Quality Assessment from the User’s Perspective. International Workshop on Information Quality in Information Systems (IQIS2004) (2004), (pp. 68-73). Paris: ACM. [8] Strong, D., Lee, Y., & Wang, R. Data Quality
in Context. Communications of the ACM,
(1997), 40(5), 103-205.
https://doi.org/10.1145/253769.253804 [9] Caro , A., Calero, C., Caballero, I., & Piattini,
M. Towards a Data Quality Model for Web Portals. The Second International Conference on Web Information Systems and Technologies (WEBIST 2006), (2006), (pp. 325-331). Setúbal, Portugal.
[10] Wang, R. Y., & Strong, D. M. Beyond Accuracy: What Data Quality Means to Data Consumers. Management Information
Systems, (1996), 12(4), 5-33.
https://doi.org/10.1080/07421222.1996.11518 099
[11] Abdulhamid, S. M., & Ismaila, I. Design Evaluation Of Some Nigerian University Portals: A Programmers Point Of View. Computer Science And Telecommunications (Gesj), (2010), 5(28), 21-28. Retrieved From Https://Arxiv.Org/Ftp/Arxiv/Papers/1402/140 2.1241.Pdf
[12] Khwaldeh, S.M., Al-Hadid, I. and Masa’deh, R.E., The association between e-services web portals information quality and ICT
competence in the Jordanian
universities. Asian Social Science, 2017, 13(3), p.156.
[13] Daigle, S. L., & Cuocco, P. M. 'Portal Technology Opportunities, Obstacles, and Options: A View from the California State University' . In Web Portals and Higher Education,Technologies to Make IT Personal. In R. N. Katz, & &. Associates, Web Portals and Higher Education Technologies to Make IT Personal (2002), (pp. 109-123). Jossey-Bass, A Wiley Company.
[14] Katz, R. N., & Associates. Web Portals and Higher Education: Technologies to Make IT Personal. Jossey-Bass, A Wiley Company. Reprinted by permission of John Wiley & Sons. (2002).
[15] Kidwell, J., Vander Linde, K., & Johnson, S. Applying Corporate Knowledge Management Practices in Higher Education. Educause Quarterly, (2000), pp. 28-33.
[16] Pena-Bandalaria, M. d. Impact of ICTs on Open and Distance Learning in a Developing Country Setting: The Philippine experience. The International Review of Research in Open and Distributed Learning, (2007), 8(1). [17] Zeithaml, V. A. Guru view. Managing Service
Quality, special issue on service excellence, (2002), 12(3), 135-138.
[18] Btoush, H. M., Qteishat, M., Siddiqi, J., & Akhgar, B. Users’Evaluation of Public E- Services: Jordanian context. The 2011 world congress in computer science computer engineering and applied computing. Las Vegas; Nevada, USA. (2011).
[19] Loiacono, E. T., Watson, R. T., & Goodhue, D. L. WebQual™: A Measure of Web Site Quality. Georgia: University of Georgia. (2000).
[20] [20] Wolfinbarger, M. F., & Gilly, M. C. comQ: Dimensionalizing, Measuring and Predicting Quality of the E-tail Experience. Marketing Science Institute. (2002).
8289 Information Technology. MIS Quarterly,
(1989), 13(3), 319–340.
https://doi.org/10.2307/249008
[22] Tate, M., Evermann, J., Hope, B., & Barnes, S. Perceived Service Quality in a University Web Portal: Revising the E-Qual Instrument. the 40th Annual Hawaii International Conference on System Sciences (p.147).
(2007), IEEE.
https://doi.org/10.1109/hicss.2007.431
[23] Barnes, S., & Videgen, R. Data Triangulation in Action: Using Comment Analysis to Refine Web Quality Metrics. 13th European Conference on Information System (pp. 92-103). Regensburg: Germany. (2005).
[24] Chen, L.-S., & Chang, P.-C. Identifying Crucial Website Quality Factors of Virtual
Communities. The International
MultiConference of Engineers and Computer Scientists 2010 (pp. 487-492). Kowloon, Hong Kong: Newswood Limited. (2010).
[25] [25] Knight, S.-a., & Burn , J. Developing a Framework for Assessing Information Quality on the World Wide Web. Informing Science Journal, (2005), 8(5), 159-172.
[26] Redman, T. Data Quality: The field guide. Boston: Digital Press. (2000).
[27] Oluwatobi, O., & Yemisi, B. Influence of Information Technology Competence and
Demographic Characteristics on
Undergraduate Student’s Perception of E-Portal. International Journal of Scientific and Research Publications, (2014). 4(6).
[28] Smith, S. M. The Four Sources of Influence on Computer Self-Efficacy. Delta PI Epsilon, (2001), 43(1), 27-39.
[29] Abu-Al-Aish, A., & Love, S. Factors Influencing Students’ Acceptance of M-Learning: An Investigation in Higher Education. The International Review of Research in Open and Distributed Learning,
(2013), 14(5).
https://doi.org/10.19173/irrodl.v14i5.1631 [30] Callum, K. M., Jeffrey, L., & Kinshuk.
Factors Impacting Teachers’ Adoption of Mobile Learning. Journal of Information Technology Education: Research, (2014), 13,
141-162. Retrieved from
http://www.jite.org/documents/Vol13/JITEv13 ResearchP141-162MacCallum0455.pdf [31] Dennis, A., Wixom, B. H., & Tegarden, D.
Systems Analysis and Design with UML Version 2.0: An Object-Oriented Approach. John Wiley & Sons. (2009).
[32] Lu, X., & Viehland , D. Factors Influencing the Adoption of Mobile Learning. ACLS 2008, (p. 56). (2008).
[33] Park, Y., & Chen, J. V. Acceptance and adoption of the innovative use of smartphone. Industrial management & Data systems,
(2007), 107(9), 1349-1365.
https://doi.org/10.1108/02635570710834009 [34] Chen, S-J. and Chang, T-Z. “A descriptive
model of online shopping process: some empirical results”, International Journal of Service Industries Management, (2003), Vol. 14 No. 5, pp. 556-69.
[35] Rowley, J. An analysis of the e-service literature: towards a research agenda. Internet research, 2006, 16(3), pp.339-359.
[36] Nielsen, J. Usability Engineering. Morgan Kaufmann, NewYork. 1993.
[37] Cyr, D. Modeling web site design across cultures: relationships to trust, satisfaction, and e-loyalty. Journal of Management Information Systems, 2008, 24(4), pp.47-72. [38] Palmer, J.W., Web site usability, design, and
performance metrics. Information systems research, 2002, 13(2), pp.151-167.
[39] Saunders, M. N., Lewis, P., & Thornhill, A. Research Methods for Business Students. Pearson. (2009).
[40] Hair, J. F., Black, W. C., Babin, B. J., & Anderson, R. E. Multivariate Data Analysis (7th editio). Upper Saddle River, NJ: Prentice Hall. (2010).
[41] Hair, J. F., Hult, J. G. T. M., Ringle, C. M., & Sarstedt, M. A Primer on Partial Least Squares Structural Equation Modeling (PLS-SEM). SAGE Publications. (2014a).
[42] Ringle, C. M. A Critical Look at the Use of PLS-SEM in MIS Quarterly. MIS Quarterly, 36(1).
[43] Hair, J. F., Ringle, C. M., & Sarstedt, M. (2011). PLS-SEM : Indeed a Silver Bullet. Journal of Marketing Theory and Practice, (2012), 19(2), 139–151.
[44] Henseler, J., Hubona, G., & Ray, P. A. Using PLS path modeling in new technology research: updated guidelines. Industrial Management & Data Systems, (2016), 116(1), 2–20. http://doi.org/10.1108/IMDS-09-2015-0382
[45] Garson, G. D. Partial Least Squares: Regression & Structural Equation Models. (2016).
8290 emerging tool in business research. European Business Review, (2014b), 26(2), 106–121. http://doi.org/10.1108/EBR-10-2013-0128 http://doi.org/10.2753/MTP1069-6679190202 [47] Sarstedt, M., Henseler, J., & Ringle, C. M.
Multigroup analysis in partial least squares (PLS) path modeling: Alternative methods and empirical results. Advances in International Marketing, (2011), 22(June 2014), 195–218.