4353
UNDERSTANDING CONSUMER BEHAVIOUR TOWARDS
UTILIZATION OF ONLINE FOOD DELIVERY PLATFORMS
Dr CHETAN PANSE1,Dr SAHILESH RASTOGI2, Ms ARPITA SHARMA3, NAMGAY DORJI4
1Associate Professor,SIBM Pune, Symbiosis International (Deemed University) (SIU), India
2Professor, SIBM Pune, Symbiosis International (Deemed University) (SIU), India
3 Assistant Professor, SIBM Pune, Symbiosis International (Deemed University) (SIU), India
4 Associate Lecturer, Gedu College of Business Studies, Royal University of Bhutan, Gedu, Bhutan
E-mail: 1[email protected], 2[email protected], 3[email protected],
ABSTRACT
The main purposes of this study are to provide a comprehensive relationship between consumer attitudes toward online food ordering. This study adopted quantitative research with primary data collected through a questionnaire with online food delivery platforms and customer based on their knowledge, attitudes, perspectives, and needs of online food delivery services. In this research paper, the reserachers examined the growth of food aggregator industry. Researchers also have examined the business model these companies follow and its effect on the conventional restaurant business in India.
This study aims at the behaviour of customers towards online food delivery platforms that are fast changing the food retailing landscape across India. Hence, the study focuses on exploring the drivers of consumer behaviour towards online food delivery apps.
The study identifies a research model having seven independent variables and two dependent variables. The independent variables comprise of, Control, Credibility, Convenience, Ease of Informativeness, Technology Anxiety, need for Interaction and Pleasure. The dependent variables comprise of consumer satisfaction and consumer intentions. Partial Least Squares (PLS) analysis using Smart PLS software is carried out to test the significance of the model.
The outcome shows that factors like Convenience, Control, Technology Anxiety & Ease of Information significantly affect Consumer Satisfaction, which in-tern significantly affect the Consumer Intentions, while Convenience also significantly affect the Consumer Intentions.
Keywords: Food delivery platform; Credibility; Convenience; Informativeness; Technology Anxiety; PLS
1. INTRODUCTION
Food delivery has become a very competitive market in India. The revenue of online Food Delivery (restaurant to consumers and platform to consumer) is in the tune of $5867 m in 2017 as reported in FICCI report (1) Revenue in the online platform to consumer delivery is only 5 % of total online Food Delivery. Growth of total online food Delivery in 2017 is 26 %, whereas the growth of the online
4354 In the first decade of the 21st century, there has been a Paradigm shift in the Retail Industry. This is because internet based applications came into existence, which has further helped in growing e-retail industry considerably. The entire landscape of retailing has changed from physical retailing to the e-retailing industry. The second decade of the 21st century witnessed the use of smartphones by the common people hence the M-shopping as the new phenomena in online purchasing. It was possible because of user-friendly mobile apps working with the help of 4G / Wi-Fi technology. This phenomena of mobile retailing and use of smart technology has received a lot of attention from the researchers all
over the world (2) (3, 4).
2. LITERATURE REVIEW
As per the report of FICCI (2017), food expenditure holds the largest retail consumption in the ever-growing Indian society. Indian food services market in India (organised and unorganised) is estimated to grow at the rate of 10% over the next five years to reach up to rupees 5,52, 000 crores (1).
Online food delivery industry has grown in India post-2010. This was possible because of the
use of the internet and various technological apps which would give flexibility, interactivity and personalization. It has become a very useful tool for not only communication, entertainment but education as well as electronic trade (5).
In the food industry, online food delivery platforms such as Swiggy, Zomato and Foodpanda have established themselves. They provide a complete food ordering and delivering solution system. It provides a single window for ordering from a wide range of hotels and restaurants, and they have their exclusive fleet of delivery personnel to pick up and deliver food to the customers. These
services are very popular with the millennial population as it reduces the time and effort that is spent on shopping (5).
[image:2.612.114.494.315.517.2]The business model for food aggregator (Refer Figure 1) is similar to taxi aggregators or hotel aggregators. The only difference in food aggregator is, they have a tie-up with many restaurants and food chain hotels who are willing to provide food on demand. Food aggregator has a user-friendly mobile app and also has to provide for physical logistics of the food. They employ delivery executives with a condition of having two wheelers
4355 driving license and preferably owing two-wheelers for this purpose.
The business model for food aggregators like Swiggy, Zomato and Foodpanda work specifically on discount given to the consumer to attract them. More of the consumers more is business. They have tied up with a chain of restaurants to provide food on request. These food aggregators have given a digital platform in the form of user-friendly mobile application which has brought restaurants close to the consumers (6).
2.1 The infancy stage (2014 - 2016)
The entry of food Tech startups around 2013 -14 brought the paradigm shift to the operations of the Indian food industry. Everyone thought that growing disposable income and increase in the young and working population coupled with increasing internet penetration and rising smartphone users and events such as cricket IPL league would drive India's food-tech market. However, 2015 was a period of turmoil for them as several startups had to shut down. The situation got better in 2017 as tech companies fine-tuned their business model to suit the Indian customers (7).
2.2 The consolidation stage (2017- 2019):
This consolidation phase saw many mergers and acquisitions during this period. Two predominant models, restaurant marketplaces and cloud kitchen evolved during this time. This stage is also marked by a reduction in delivery costs and increased penetration in the existing market (7).
2.3 Expansion & customization (2019, onwards):
The food tech industry saw a lot of investment during this time. The focus is now on expansion and bringing personalization to retain repetitive consumers such as membership clubs, loyalty programs. This also includes offering special concessions to customers’ birthdays & anniversaries (7).
Food aggregators have the following distinct advantages of the conventional food service provider.
1. First and foremost is that they are less expensive than the conventional service providers, in fact, they give additional discounts for the repetitive customers; thereby making them accessible even to the middle & lower middle classes.
2. They offer convenience to the consumers by placing technology at the centre of it. The mobile app, connected the consumers (i.e. demand side) with the restaurants (i.e. supply side). The food aggregator app acts like a demand-supply matching mechanism that makes a profit by providing the physical delivery of food. All they had to do is to tie- up with various restaurants & integrate them into the system & customer would be in their system, whenever they download the app (8).
3. They offer time flexibility; their services are available whenever a consumer wants the order & wherever he wants it. They also offer various payment options, including cashless payments or cash on delivery options to choose from, whichever is suitable to consumer.
4. The food ordering mobile app is equipped with real-time GPS based order tracking. The consumer can track the delivery boy and help him to find the exact address.
5. The mobile ordering app has loyalty points to offer to consumers. This encourages the consumer to frequently use the app & order with more discounts.
6. Customer support is available 24/7 to consumers to connect the executives in case of complaints or to answer their queries (9).
The low-cost conditions, convenience and flexibility, have been the biggest value creation for these food aggregators.
4356
2.4 Effects on Restaurants:
Positive: When customers are happy, this app can help restaurants develop customer loyalty, increase profitability & venture into a new market segment. If restaurants have heavy turnout, this app helps them to gain the consumer rather than losing out because of the long waiting time. If restaurants have low turnout, this app may give them new customers & business as ordering food online is much more comfortable and less expensive than dining out.
Apps promote restaurants on their behalf. So listing at the app is beneficial to restaurants as increases business, helps in brand building, & promotion increases customer base, and reduces cost (11).
Negative: The fine dines outlook is mainly on ambience & taste while ordering food on the mobile app; the outlook is only on price & convenience (9).
Zomato, Food Panda, Uber eat, Justeat, Swiggy are some of the companies in this segment. Some of the big brands own their fleet for logistical services like KFC, Dominoes, Fasos, Pizza Hut.
2.5 Cloud kitchen:
It is also called as a delivery-only restaurant. It essentially involves small eateries, sharing a kitchen facility from where deliveries can be made easily. It helps brands by being closer to customers and by bringing down the cost of setting up a cooking facility. They can take orders for food aggregators to deliver the food. Two reasons have been primarily responsible for the rise of cloud kitchens: the pain of setting up and operating a restaurant and the arrival of technology that has led to an explosion in home deliveries. These outlets can be 300-1,200 sq ft and serve a radius of 3-10 km. Since these units don’t need to cater to diners on site, they can be set up in cheaper locations.
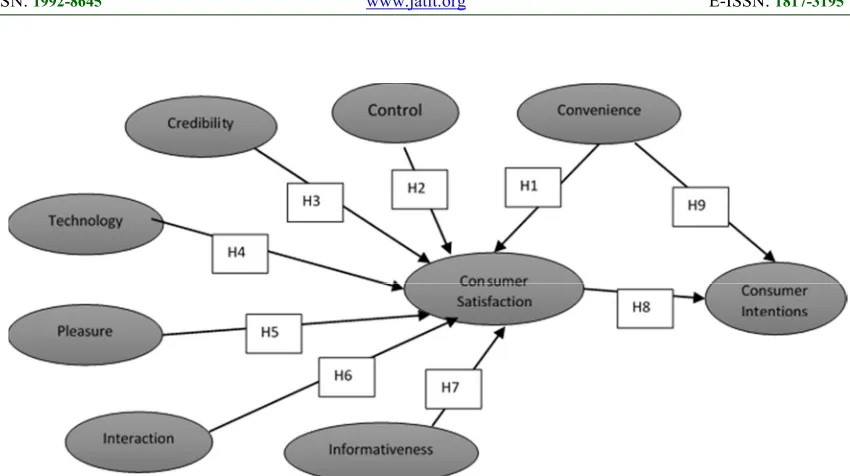
2.6 Conceptual Model and Hypotheses Development:
While building a conceptual model, consumer satisfaction is taken as a predictive element to which convenience, control, credibility, technology, pleasure, interaction and informativeness act as an antecedent, while the
outcome is consumer satisfaction and consumer intentions. The researchers also would like to test that convenience has a positive relationship with consumer intention.
Considering the literature review, the conceptual model was proposed as shown. (Refer Fig 2). The research model in this study will examine the statistical significance of the variables on the outcome. Based on the research model, the following are the research hypotheses postulated in the context of food delivery platforms in India.
The technological advances in online food delivery system improve productivity & profitability of the system. This has led the restaurants to grow the business from time to time (12).
Technology acceptance model (TAM) to study the acceptance of online food ordering apps, suggests that the attitude towards online food app is basically because of usefulness & ease of ordering process & is varies according to the innovativeness of information technology and trust on e-commerce (13).
Sethu & Bhavya Saini 2016, analysed students perception, behaviour and satisfaction towards online food ordering and delivery applications. The study highlights that ease of use of application and availability of the internet all the time to visualise the food at any given point are the main reasons for accepting the apps (14).
Sheryl E. Kimes 2011, distinguishes users & non-users of the online food ordering apps based on convenience and perceived control, non-users have high uncertainty towards the use of new technology, and they need personal attention (15).
The online food ordering Process is convenient, easy to use and efficient and is expected to become better day by day (16).
4357 The researchers have considered the following nine components for study. Therefore, the following hypotheses are proposed
1.Convenience: Convenience is the ease of use where consumer-initiates the transaction at his convenient time from the comfort of home.
H1. The convenience as ease of use has a positive relationship with Consumer satisfaction toward online food delivery platforms (17) (18).
2.Control: This is one of the important factors that contributed to consumer pull for online content. Consumers are the one who decides when, where, what, and how much they will buy and feel that they are in complete control of the online food delivery platform (19) (20).
H2. Perceived control of decision making has a positive relationship with Consumer satisfaction towards the online food delivery platforms.
3.Credibility: Credibility is the level of reliability of the information and how accurate and updated the information is, (3). Online food delivery system credibility stands for reliability of food options available, the choice of restaurants and the prices of it (21).
H3. The credibility of reliability and quality of information has a positive relationship with consumer satisfaction towards online food delivery platforms.
4.Technology Anxiety: Consumer faces some anxiety while dealing with technology apps & monetary transactions (15) (24).
H4. Technology anxiety has a negative relationship with consumer satisfaction toward online food delivery platforms.
5.Pleasure: It’s a hedonic experience with the app for service that makes the consumer feel good (22). The components of pleasure are enjoyable excitement and surprise to the use the app and technology (23).
H5. Pleasure as the feel-good factor has a positive relationship with consumer satisfaction towards online food delivery platforms.
4358
H6. Need for interaction has a positive relationship with Consumer satisfaction toward online food delivery platforms
7. Informativeness: The app can provide food information and interesting information on the product (26). It also refers to the degree of usability and effectiveness of the information. The app can provide upgraded information which will help the assistant consumer in making the decisions (15).
H7. Informativeness as information and its effectiveness have a positive relationship with consumer satisfaction towards online food delivery platforms.
8.Satisfaction: It is the outcome of the service of online ordering and the quality of the service that the consumer gates (27) (28).
H8. Consumer satisfaction has a positive relationship with consumer intention towards online food delivery platforms
9.Consumer Intention: It is the informational response which results from the satisfaction which acts as the stimulus for the recurring use of the app. The informational response is a total of the components such as awareness, interest, and desire converted into action. (29) (30).
H9. Convenience has a positive relationship with consumer intentions.
3. RESEARCH METHOD
The current study applies a quantitative exploratory approach and analyze and explain the relationships among and between independent and dependent variables through hypothesis testing.
Based on the literature review, the conceptual model was suggested. An online questionnaire was developed to capture the responses of the consumer. The questionnaire was divided into two parts, in a first part the demographic details of the respondents were captured (with ten questions such as Age, Education, Gender etc.) and in second part questions based on the construct were asked (with 11 questions). The 5 points Likert scale was used from strongly disagree (1) through to strongly agree (5) to capture the responses of the consumer. An online link was created of the questionnaire using Google form & was emailed/sent on what’s app groups. Since the subject study was related to online food ordering, the response also was taken using an online survey.
[image:6.612.98.523.78.316.2]The focus of the study was to understand the online food shopping behaviour of the consumers. The respondents were asked to remember online food mobile application, which they had used while purchasing something from and
4359 while completing the entire questionnaire for that application. A set of 170 responses was found to be complete and usable. The descriptive analysis was carried out of the data. The qualified respondents were current users of mobile online food shopping (41% female, 51% below the age of 30, 92% with post-graduation education).
3.1 Sample Size: The target population for this study was consumers in India who preferred the online food delivery food platform, which is infinite. A convenience sample collection method was used to collect the data. The data of 170 responses were collected. According to Cohen, 1992 using the tables of sample size selection, since we have seven independent variables, 80 sample size will be sufficient to achieve a statistical power of 80% for predicting R square value of at least 0.25 at 5% probability error. This sample size exceeds the recommended minimum for similar studies (31).
4. THE DESCRIPTIVE ANALYSIS
The first part of analysis includes about analysis of background information of the respondents. The responses of the consumer about the usage of mobile app were tabulated and analyzed to understand their behaviour.
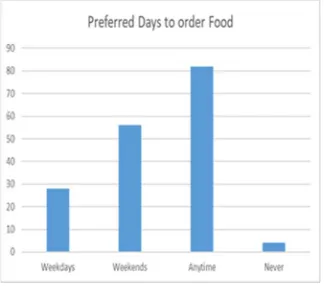
A. Preferred days for order through online food delivery platforms.
[image:7.612.346.523.107.243.2]The chart shows that majority of respondents prefer to order food as and when they need it. It is not on weekdays or weekends specifically, but they prefer to use this app anytime they want to have food.
Figure 3: Preferred Days to Order Food
[image:7.612.126.288.546.689.2]B. Preferred mode of payment
Figure 4: Preferred Mode of Payment
4360 digital payment option, they would still prefer to pay
on cash after the food delivery.
4.1 PLS Measurement Analysis
Recently, partial least square structural modelling methodology has got acceptance from the research community, especially in social science
research (32). This is called a 2nd generation procedure because here Measurement (Outer model) and Structural model (Inner Model) are analyzed simultaneously unlike in Co-variance based SEM, which is 1st generation statistical procedure.
Covariance-based regression will fail if there is multicollinearity among predictors. PLS regression will work in such cases. Also, it is suited
if we have a more complex model where predictors
have more variables than observations. In the past Covariance-based, SEM was more prominent. However, recent research supports the use of partial least square SEM as it has many advantages as given below (33).
The PLS SEM approach is better than
Co-variance SEM approach where:
[image:8.612.91.523.141.322.2]1. There are no distribution assumptions about the data set.
Figure 5: The Research Model
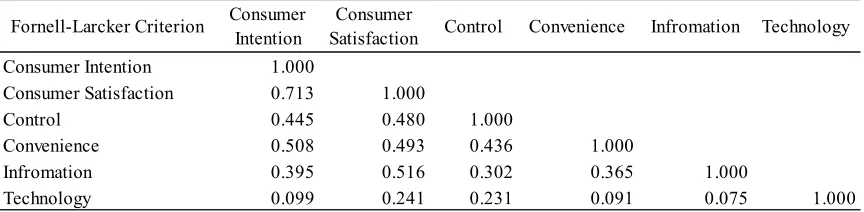
Table 1: Fornell –Larcker criterian
Consumer Intention 1.000
Consumer Satisfaction 0.713 1.000
Control 0.445 0.480 1.000
Convenience 0.508 0.493 0.436 1.000
Infromation 0.395 0.516 0.302 0.365 1.000
Technology 0.099 0.241 0.231 0.091 0.075 1.000
Infromation Technology Fornell-Larcker Criterion Consumer
Intention
Consumer
[image:8.612.95.527.487.593.2]4361
2. All numerical data were collected using Nominal, Ordinal Interval and Ratio measures.
3. Co-relation among the observed variable
is very high
4. Having a complex model to test
5. A relatively smaller sample size of the data set.
Therefore, the PLS analysis using Smart PLS was carried out for the present study.
4.2 The Measurement Model:
In PLS analysis, the systematic evaluation follows a two-step process, Measurement Model (outer model) evaluation & Structural Model (inner model) evaluation. The measurement model is evaluated using Reliability, Convergent validity and Discriminant validity since we have used reflective measurement model.
4.2.1 Convergent Validity:
It is the extent to which a measure correlates positively with an alternative measure of the same construct.
Since for each of the latent variable, there
is only one indicator, the values of internal consistency reliability indicators, i.e. Composite Reliability and Cronbach Alpha value as well as Convergent Validity in the form of Loading and AVE, are 1.
4.2.2. Farnell & Larcker criteria for discriminant validity:
The discriminant validity test indicates that each construct is different from others. It is confirmed by comparing AVE is greater than the
squired correlation between the construct and each of the other constructs on the model. This highlights that each construct is different from others. The table 1 shows that the indicator value for each of the indicator is less than the SQRT of AVE (Average Variance Extracted) of each of the indicator. That shows that the criteria for discriminant validity are met with, and each of the indicators is distinctly different than each other (34). (Refer to Table 1).
4.3 The Structural Equation Model:
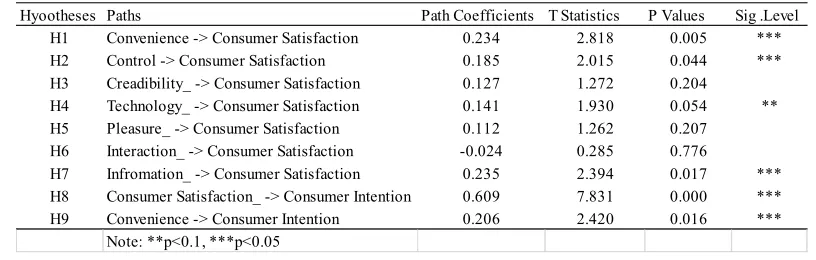
Table 2: Hypotheses Tested
Hyootheses Paths Path Coefficients T Statistics P Values Sig .Level
H1 Convenience -> Consumer Satisfaction 0.234 2.818 0.005 ***
H2 Control -> Consumer Satisfaction 0.185 2.015 0.044 ***
H3 Creadibility_ -> Consumer Satisfaction 0.127 1.272 0.204
H4 Technology_ -> Consumer Satisfaction 0.141 1.930 0.054 **
H5 Pleasure_ -> Consumer Satisfaction 0.112 1.262 0.207
H6 Interaction_ -> Consumer Satisfaction -0.024 0.285 0.776
H7 Infromation_ -> Consumer Satisfaction 0.235 2.394 0.017 ***
H8 Consumer Satisfaction_ -> Consumer Intention 0.609 7.831 0.000 ***
H9 Convenience -> Consumer Intention 0.206 2.420 0.016 ***
Note: **p<0.1, ***p<0.05
Endogenous latent variable
R Square
Q² (=1-SSE/SSO)
Consumer Intention
0.541
0.502
[image:9.612.118.526.187.317.2]Consumer Satisfaction
0.447
0.382
4362 A structural (inner) model evaluation is done to see the role of the independent variable to the dependent variable in the model through R2 value and through
Q2 value, which talks about predictive relevance of
the model.
The table shows path Coefficients and their ‘t’ statistics. As shown in Table 2, hypotheses Convenience & Consumer satisfaction, Control & Consumer satisfaction, Informativeness & Consumer satisfaction, and Convenience & Consumer satisfaction are statistically significant. The hypothesis Technology & Consumer satisfaction are statistically significant at the 10% level.
Other hypotheses like Credibility and Consumer satisfaction, Pleasure & Consumer satisfaction, Interaction & Consumer satisfaction are not statistically significant.
The R2 valueof thedependent variable in
the model shows how much independent variable can explain the variance of the dependent variable. In the R2 table, the R2 value is 0.541 for consumer
intentions, and the R2 value is 0.447 for consumer
satisfaction shows that the independent variable has a moderate effect on the dependent variable.
Geisser developed the Q2 test to access the
predictive relevance of the endogenous constructs. This test is an indicator of how well-observed values are reproduced by the model and its parameter estimates. The Q2 value for consumer intention is
0.502, and for consumer satisfaction is 0.382 shows that the model has got high predictive relevance (35). (Refer to Table 3)
5. HYPOTHESES TESTING AND DISCUSSION
Hypothesis testing is done by analyzing the significance of path coefficients in the Partial Least Square analysis. If the p-value of the path Coefficient is < 0.05 (5%), then the null hypothesis can be rejected. Which means that independent variables have a significant effect on the dependent variable (Refer figure 5).
H1. The convenience as ease of use has a positive relationship with Consumer satisfaction toward online food delivery platforms.
Table 2 shows a positive impact with a path coefficient of 0.234 with the p-value 0.005 (p<0.05). Thus the null hypothesis is rejected, and the alternative hypothesis H1 is accepted. In conclusion, it can be stated that there is a statistically significant and positive impact of the convenience on consumer satisfaction. Further, it means that consumers used online food app because it is convenient for them to order the food.
H2. Perceived control of decision making has a positive relationship with Consumer satisfaction towards the online food delivery platforms.
Table 2 shows a positive impact with a Path coefficient of 0.185 with the p-value 0.044 (p<0.05). Thus the null hypothesis is rejected and the alternative hypothesis H2 is accepted. In conclusion, it can be stated that perceived control has a statistically significant and positive relationship with consumer satisfaction. It further means that the consumer feels that they are in complete control and charge while using the online food delivery app.
H3: Credibility of reliability and quality of information has a positive relationship with consumer satisfaction towards online food delivery platforms.
Table 2 shows a path coefficient of 0.127 and p-value of 0.204 (p>0.05). Thus the null hypothesis is accepted, which means that this relationship is not statistically significant. It further means that the consumers are ready to experiment with and not worried about the credibility of the information while using online food delivery app.
H4. Technology anxiety has a negative relationship with consumer satisfaction toward online food delivery platforms.
4363
H5. Pleasure as the feel-good factor has a positive relationship with consumer satisfaction towards online food delivery platforms.
Table 2 shows a path coefficient of 0.112 and p-value of 0.207 (p>0.05). Thus the null hypothesis is accepted, which means that this relationship is not statistically significant. It further means that pleasure as a feel-good factor does not affect the use of the online food delivery app.
H6. Need for interaction has a positive relationship with Consumer satisfaction toward online food delivery platforms.
Table 2 shows a path coefficient of -0.024 and p-value of 0.776 (p>0.05). Thus the null hypothesis is accepted, which means that this relationship is not statistically significant. It further means that the need for interaction as a factor does not affect the use of the online food delivery app.
It could be because of the frequency and repeated use of the mobile app that has diminished the feel-good factor and the need for interaction.
H7. Informativeness as information and its effectiveness have a positive relationship with consumer satisfaction towards online food delivery platforms.
Table 2 shows a positive impact with a Path coefficient of 0.235 with the p-value 0.017 (p<0.05). Thus the null hypothesis rejected and the alternative hypothesis H7 accepted. In conclusion, it can be stated that informativeness has a statistically significant and positive relationship with consumer satisfaction. It further means that the consumer feels that they get quick and visual food information while using the online food delivery app.
H8. Consumer satisfaction has a positive relationship with the consumer intentions of online food delivery platforms.
Table 2 shows a positive impact with a Path coefficient of 0.608 with the p-value 0.000 (p<0.05). Thus the null hypothesis is rejected and the alternative hypothesis H8 is accepted. In conclusion, it can be stated that consumer satisfaction has a statistically significant and positive relationship with consumer intentions. The very high path coefficient shows that there is a strong effect of consumer
satisfaction on consumer intentions of the use of online food delivery app.
H9. Convenience has a positive relationship with consumer intentions.
Table 2 shows a positive impact with a Path coefficient of 0.207 with the p-value 0.016 (p<0.05). Thus the null hypothesis is rejected and the alternative hypothesis H9 is accepted. In conclusion, it can be stated that convenience has a statistically significant and positive relationship with consumer intentions.
Table 3 shows consumer intentions with the R2 value of 0.541 and Q2 value of 0.502. This
concludes that convenience and consumer satisfaction plays a very important role in consumer intentions, which results in frequent and repetitive use of the online food delivery app.
6. CONCLUSION
The study shows that there is going to be a huge demand for mobile food delivery applications in the coming future. People use mobile applications to deliver food to them not only because it saves on time, but it is convenient. Also, they have a feeling of control over technology as they can order food that they want, right at the place they want. Also, people experienced the satisfaction of using mobile technology and having the informativeness at the fingertips.
Technology is affecting business in almost every sphere. The gap between consumer expectations and their fulfilment is being reduced with the help of Emerging Technologies. It is that disruptive force which has brought a Paradigm shift in the business model to serve customers in the manner that was unthinkable before. In the last decade, India has witnessed the exponential growth in internet access as well as in the number of smartphone users. Technology convergence of Mobile phones and internet access has caused significant shifts in consumer awareness, outlook, expectations and their buying behaviour (7).
4364 products, services and experience. Due to the changing young consumers' lifestyle and rising of disposable income, there has been a consumer change among Indian consumers to buy food online (7).
Food aggregators like Zomato, Swiggy has done very well during sports events such as IPL and other such events. The average number of daily orders on food platforms have jumped by 18.2% from pre-IPL days to IPL days. IPL, which is India’s biggest Cricket League hosts at least one match every day from 8 p.m. to 11 p.m. on weekdays and from 4 p.m. on weekends for 50 days. During IPL 2018, snackable items like ice creams, french fries and pizza witnessed a 50% increase in order. Chicken biriyani, Paneer butter masala, Pav bhaji and Samosa are some of the top 10 dishes ordered during IPL season (36).
This further also suggests that convenience is a major contributing factor which also affects significantly to consumer satisfaction and consumer intention to buy the food online.
Food aggregators are a relatively new phenomenon to India, as Swiggy has started its operations in 2014 in India. However, it will continue to grow at a rapid rate in the coming future. Food aggregators are the creators of consumer change among consumers that is going to decrease the propensity of dining out. Technology is disrupting the market with the advent of user-friendly food aggregator apps in ordering. These developments are set to revolutionize home delivery with a faster availability of food at home or office (1).
7. LIMITATIONS & FUTURE SCOPE
One of the limitation that was faced by the researcher while conducting this study was it is solely based on the opinion of the consumers collected through an online survey and on their accurate and honest response. Moreover, survey participants may possess certain attributes that differ from those in other parts of the world. Future research may use more diversified random sampling to verify the dimensions developed in this study. Regarding the methods which were used by the researcher to investigate the study, it is suggested that future studies use both quantitative and qualitative methods to enhance the results of the field.
REFERENCES
[1].Jaisani L, Shukla A, Malik R. Indian Food Services Industry: Engine for Economic Growth & Employment, A Report for Unlocking Growth Opportunities. New Delhi: FICCI; 2017.
[2]. Bitner MJ, Brown SW, Meuter ML. Technology infusion in service encounters. Academy of Marketing Science. 2000;28(1):138-49.
[3]. Kelman HC, Hovland CI. " Reinstatement" of the communicator in delayed measurement of opinion change. The Journal of Abnormal and Social Psychology. 1953;48(3):327.
[4]. Curran JM, Meuter ML. Self-service technology adoption: comparing three technologies. Journal of Setrvices Marketing. 2005;19(2):103-13.
[5]. Koyuncu C, Lien D. E-commerce and consumer's purchasing behaviour. Applied Economics. 2003;35(6):721-6.
[6]. Bhushan R. Food aggregators like Swiggy, Zomato making consumers discount addicts Mumbai: The Economic Times; 2019 [
[7]. Jaisani L, Godbole P, Sharma A, Nag S, Malik R, Malhotra D, et al. The Changing landscape of the retail food service industry. New Delhi: FCCI & PwC; 2018.
[8]. Muralidhar SH. How Ola Disrupted Taxi Services in India? Review of Management,. 2016;6(3-4):5-17.
[9]. Gupta M. A Study on Impact of Online Food delivery app on Restaurant Business. International Journal of Research and Analytical Reviews. 2019;6(1):889-93.
[10]. Kar S, Shrivastava A. Rethinking customer experience: Zomato, Swiggy focus on training delivery staff in soft skills Mumnai: The Economic Times; 2019 [
[11]. Saxena A, editor An Analysis of Online Food Ordering Applications in India: Zomato and Swiggy2019; Ghaziabad, India: International Journal of Research in Engineering, IT and Social Sciences.
[12]. Leong WH. Food Ordering System Using Mobile Phone: UTAR; 2016.
[13]. Alagoz SM, Hekimoglu H. A study on tam: analysis of customer attitudes in online food ordering system. Procedia-Social and Behavioral Sciences. 2012;62:1138-43.
4365 Finance and Social Sciences (AP16Malaysia Conference; 2016.
[15]. Kimes SE. Customer perceptions of electronic food ordering. Cornell Hospitality Report. 2011;11(10):6-15.
[16]. Chavan V, Jadhav P, Korade S, Teli P. Implementing Customizable Online Food Ordering System Using Web Based Application. International Journal of Innovative Science, Engineering & Technology. 2015;2(4):722-7.
[17]. Morganosky MA, Cude BJ. Consumer response to online grocery shopping. International Journal of Retail & Distribution Management. 2000;28(1):17-26.
[18]. Yeo VCS, Goh S-K, Rezaei S. Consumer experiences, attitude and behavioral intention toward online food delivery (OFD) services. Journal of Retailing and Consumer Services. 2017;35:150-62.
[19]. Korgaonkar P, Wolin LD. Web usage, sdvertising and shopping: relationship patterns. Internet Research. 2002;12(2):191-204. [20]. Janda S, Trocchia PJ, Gwinner KP. Consumer
perceptions of Internet retail service quality. International Journal of Service Industry Management. 2002;13(5):412-31.
[21]. Rutsaert P, Regan Á, Pieniak Z, McConnon Á, Moss A, Wall P, et al. The use of social media in food risk and benefit communication. Trends in Food Science & Technology. 2013;30(1):84-91.
[22]. Batra R, Ahtola OT. Measuring the hedonic and utilitarian sources of consumer attitudes. Marketting Letters. 1991;2(2):159-70.
[23]. Overby JW, Lee E-J. The effects of utilitarian and hedonic online shopping value on consumer preference and intentions. Journal of Business research. 2006;59(10-11):1160-6.
[24]. Bross A, Gender and information and communication technologies (ICT) anxiety: Male self-assurance and female hesitation. Journal of Cyber Psychology & Behavior, 8(1), 21-31.
[25]. O'Brien HL, Toms EG. What is user engagement? A conceptual framework for defining user engagement with technology. Journal of the American society for Information Science and Technology. 2008;59(6):938-55. [26]. Ducoffe RH. How consumer assess the value
of advertising? Journal of Current Issues & Research in Advertising. 1995;17(1):1-18.
[27]. Shiau W-L, Luo MM. Factors affecting online group buying intention and satisfaction: A social exchange theory perspective. Computers in Human Behavior. 2012;28(6):2431-44.
[28]. Zhou L, Dai L, Zhang D. Online shopping acceptance model-A critical survey of consumer factors in online shopping. Journal of Electronic commerce research. 2007;8(1).
[29]. Belch GE. Belch., MA 2004. Advertising and Promotion: An Integrated Marketing Communications Perspective. New York McGraw-Hill 連結. 2011.
[30]. Wen I. Factors affecting the online travel buying decision: a review. International Journal of Contemporary Hospitality Management. 2009;21(6):752-65.
[31]. Cohen J. A power primer. Psychological bulletin. 1992;112(1):155.
[32]. Ken Kwong-Kay W. TECHNICAL NOTE: Mediation analysis, categorical moderation analysis, and higher-order constructs modeling in Partial Least Squares Structural Equation Modeling (PLS-SEM): A B2B Example using SmartPLS. Marketing Bulletin. 2016;26:1-22. [33]. Ali F, Rasoolimanesh SM, Sarstedt M, Ringle
CM, Ryu K. An assessment of the use of partial least squares structural equation modeling (PLS-SEM) in hospitality research. International Journal of Contemporary Hospitality Management. 2018;30(1):514-38.
[34]. Chin WW. How to write up and report PLS analyses. Handbook of partial least squares: Springer; 2010. p. 655-90.
[35]. Chin WW. The partial least squares approach to structural equation modeling. Modern methods for business research. 1998;295(2):295-336.
[36]. Sarkar J. Food delivery apps score big in IPL Mumbai: The Economics Times; 2019