1891
BEHAVIOR ANALYSIS OF THE USE OF E-LEARNING
USING UTAUT MODEL APPROACH
(CASE STUDY: STMIK MIKROSKIL)
1ZULPA SALSABILA, 2EDI ABDURACHMAN, 2SOPHYA HADINI MARPAUNG
Information Systems Management Department, BINUS Graduate Program-Master of Information Systems Management, Bina Nusantara University
Jakarta, 11480, Indonesia
E-mail: 1[email protected], 2[email protected], 3[email protected]
ABSTRACT
E-learning has become one of the factors that needed by universities to be able to compete and survive. Electronic learning (e-learning) using Internet and digital technologies to create experience in educating others. E-Learning in STMIK Mikroskil used to help students and lecturers in teaching and learning process. This study uses the UTAUT (Unified Theory of Acceptance and Use of Technology) model. The aim is to analyze the tendency of users of e-learning systems at STMIK Mikroskil Medan, by testing whether Behavioral Intention and Behavior to Use a technology are influenced by Performance Expectancy, Effort Expectancy, Social Influence, and Facilitating Conditions. These four factors are moderated by gender, experience, and voluntary factors. Questionnaire data were collected from 346 active students and analyzed by structural equation modeling (SEM) using AMOS 24. The results of this study showed Performance Expectation Factors, Effort Expectation Factors, Social Influence Factors had a positive effect on Behavioral Intention, Facilitating Conditions Factors had a positive effect on Use Behavior, Behavioral Intention has a significant influence on Use Behavior. Gender does not have a moderating effect that affects the factors of Performance Expectation and Effort Expectancy on Behavioral Intention, but Gender has a moderating effect that affects Social Influence factors towards Behavioral Intention. Experience does not have a moderating effect that influences Business Expectancy factors on Behavioral Intention. However, experience has a moderating effect that influences Social Influence factors that have a positive effect on Behavioral Intention. Experience also has a moderating effect that affects the Facilitating Conditions factor for Use Behavior. Voluntariness has a moderating effect that affects Social Influence factors towards Behavioral Intention.
Keywords: E-Learning, Performance Expectancy, Effort Expectancy, Social Influence, Facilitating Conditions, Unified Theory of Acceptance and Use of Technology (UTAUT)
1. INTRODUCTION
E-learning has become one of the factors needed by universities to be able to compete and survive. Electronic learning (e-learning) is the use of Internet and digital technologies to create experience in educating others. The use of technology especially e-learning is now widely used as a tool in the lecture process to facilitate students in absorbing lecture material.
Through e-learning, students can get lecture material, collect assignments, work on online quizzes, get notifications about deadlines for collecting assignments / quizzes, interact and discuss with fellow students and lecturers at E-Learning forums through the internet, anytime and where just without being limited by space and time.
This study wants to prove whether e-learning can improve the efficiency of student learning in other words students expect by using e-learning to be useful for their learning activities. And this study
also wants to prove whether students tend to use the e-learning system because e-learning is easy to use and understand, also to prove whether there is an influence of the surrounding environment which causes students to tend to use e-learning. Then is the influence of the availability of resources or facilities needed for elearning making students tend to use e-learning in their e-learning activities.
1892 Performance Expectancy, Effort Expectancy, Social Influence, and Facilitating Conditions. Fourth these factors are moderated by gender, age, experience and voluntary factors using
2. LITERATURE REVIEW
E-Learning system is a form of distance education that uses electronic media as a medium for delivering material and communication between instructors and students. E-Learning is learning method through the internet, its components are presented in many formats, experience-based learning arrangements, and community networks of learners, also involved developers and experts. E-Learning provides rapid learning by reducing costs, increasing access to teaching and learning, and clear accountability for all users involved in the learning process [2]. E-Learning facilitates interaction between students with material / subject matter and with lecturers / instructors / teachers [2].
The Unified Theory of Acceptance and Use of Technology (UTAUT) was developed by Venkatesh, et al. (2003). UTAUT is a combination to perfect eight other behavioral theories in explaining user acceptance of information systems. Eight theories and models of behavioral information systems are [1]:
1. Theory of Reasoned Action (TRA) by Fishbein and Ajzen (1975).
2. Technology Acceptance Model (TAM) by Davis et al. (1989).
3. Motivational Model (Motivational Model or MM) by Davis et al (1992).
4. Planning Behavior (Theory of Planned Behavior or TPB) by Ajzen (1991). Combined TAM and TPB Models (a Model Combaining the Technology Acceptance Model and the Theory of Planned Behavior or TAM + TPB) by Taylor and Todd (1995).
5. Combined TAM and TPB Models (a Model Combaining the Technology Acceptance Model and the Theory of Planned Behavior or
TAM+TTPB) by Taylor and Todd (1995). Model of PC (Model of PC Utilization or MPCU) Utilization by Thompson et al. (1991). 6. Innovation Diffusion Theory (IDT) by Moore
and Benbasat (1991).
7. Social Cognitive Theory by Compeau and Higgins (1995).
[image:2.612.332.526.527.687.2]The following is the UTAUT model can be seen in the picture below:
Figure 1. UTAUT Model
The UTAUT model has four main variables that play an important role as factors that directly determine the intention to behave and use behavior, namely Performance Expectancy, Effort Expectancy, Social Influence and Facilitating Conditions. The UTAUT model also has four moderator variables, namely gender, age, experience and voluntariness of use, these four moderator variables can influence the weakness of the main variables that link behavioral intention and use behavior [1], [3], [4], [5], [6 ], [7].
This research was conducted to analyze the trends of system users using the UTAUT Model. This model is used to test whether behavioral intentions and behavior to use a technology are influenced by Performance Expectancy, Effort Expectancy, Social Influence, and Facilitating Conditions. Fourth these factors are moderated by gender factors, experience seen from the semester of how many students to determine how long to use E-Learning and volunteer use.
.
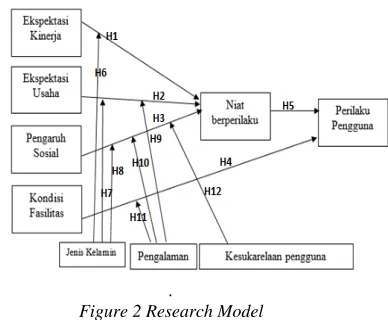
Figure 2 Research Model
The following is an explanation of the variables in UTAUT:
1893 Performance Expectancy is the level of individual trust that the use of an existing system can help them to get a benefit that can help simplify their work [8].
2. Effort Expectancy
Effort Expectancy is defined as the level of ease of use of the system that can help reduce the effort (energy and time) of the individual in completing the work. The ease of use can lead to feelings of interest in a person that the system has usefulness and creates a sense of comfort when using it [8].
3. Social Influence
Social Influence is defined as the degree to which the environment influences prospective users to use new technology, the greater the interest that arises in individuals to use information technology because of strong environmental influences [8].
4. Facilitating Conditions
Facilitating Conditions are a reminder of individual beliefs about infrastructure and supporting facilities owned by companies or organizations available to support the use of existing systems [8].
5. Intention to behave
The intention to behave or intention to use information technology is defined as the level of desire of users to utilize existing systems continuously with the assumption that they have access to information. The UTAUT model proves that usage intention is directly influenced by Performance Expectancy, Effort Expectancy and Social Influence [8].
6. Use Behavior
Use Behavior is defined as the intensity or frequency of users in using information technology. Use Behavior depends on the impression of the user on the system offered. The system will be used if the user is interested in using and has confidence that the technology provides benefits in helping his work, can be used easily and the presence of social influences from the surrounding environment [6].
7. Gender
Gender is a variable that states the gender of the user.
8. Experience
Experience is a variable that states the level of user experience using the system.
9. Voluntariness of use
Voluntariness of use a variable that states the level of volunteerism of users using the system.
3. METHOD
This research follows the following stages:
1) Identify and formulate the problem to be studied
2) Conduct relevant theory studies 3) Designing a Research Model
4) Arrange Questions in the Questionnaire 5) Collecting Data
6) Perform Statistical Analysis 7) Discussion of Results 8) Conclusions & Suggestions
Conduct relevant theoretical studies to find relationships between variables and build a research model. The following relationship is found
1) Performance Expectation factor (EK) has a positive effect on Behavioral Intention (NB). The more trusted the use of the existing system can help them to get a benefit that can help facilitate the work more intend to use the system. The relationship between these two variables is supported by research findings [7], [6], [9], [10], [5], [3], [11], [12], [4], [13]. 2) Effort Expectancyfactors (EU) have a positive
effect on Behavioral Intention (NB) The more students feel easy in using the e-learning system, the more benefits students can receive until the greater the student's intention to be more likely to use the e-learning system. The results of this study are supported by various studies such as research [14], [9], [10], [12]. 3) Social Influence (PS) factors have a positive
effect on Behavioral Intention (NB). The stronger the Social Influence of people in the environment around students to use the elearning system, the more likely students are to use the e-learning system. The results of this study are supported by various studies such as research [6], [14], [9], [10], [3], [12], [13]. 4) Facilitating Condition (KF) factor has a positive
effect on Use Behavior (PP). The more students feel confident that the infrastructure and supporting facilities possessed to access the e-learning system are supported and available very well by Mikroskil, will affect students' behavior to want to use these facilities to access the e-learning system. The results of this study are supported by various studies such as research [7], [6], [14], [9], [3], [11], [12], [4], [13].
5) Behavioral Intention (NB) has a significant influence on Use Behavior (PP)
1894 assumption that they have access to information. The results of this study are supported by various studies such as research [10], [11].
6) Gender has a moderating effect that affects the Performance Expectation (EK) factor on Behavioral Intention (NB). Sex differences have a significant influence on trust in the use of the existing system can help them to get a benefit that can help facilitate the work more intend to use the system. The results of this study are supported by various studies such as research [10].
7) Gender has a moderating effect that influences the Effort Expectation (EU) factor on Behavioral Intention (NB). Sex differences have a significant influence on the feeling of ease in using the system with many acceptable benefits until the greater the intention of students to be more likely to use the system. The results of this study are supported by various studies such as research [10].
8) Gender has a moderating effect that affects the Social Influence (PS) factor on Behavioral Intention (NB). Gender differences have a significant influence on social influence from people in the environment around students to use the system, the more likely the user intends to use the system. . The results of this study are supported by various studies such as research [10].
9) Experience has a moderating effect that influences the factors of Effort Expectancy (EU) on Behavioral Intention (NB). Experience differences have a significant effect on the feeling of ease in using the system with many benefits that can be accepted until the user tends to use the system. The results of this study are supported by various studies such as research [10].
10) Experience has a moderating effect that influences Social Influence (PS) factors that have a positive effect on Behavioral Intention (NB). Differences in experience have a significant influence on social influence from people in the environment around students to use the system, the more likely the user intends to use the system. The results of this study are supported by various studies such as research [10].
11) Experience has a moderating effect that affects the Facilitating Condition (KF) factor for Use Behavior (PP). Experience differences have a significant influence on the belief in the infrastructure and supporting facilities
possessed to access the e-learning system supported and available very well by Mikroskil, will affect students' behavior to want to use these facilities to access the system. The results of this study are supported by various studies such as research [10].
12) Volunteerism has a moderating effect that affects the Social Influence (PS) factor on Behavioral Intention (NB). The difference in Voluntariness has a significant influence on the Social Influence of people in the environment around students to use the system with the more likely the user intends to use the system. The results of this study are supported by various studies such as research [10].
Hypothesis to be tested in this study are:
H1 :Performance Expectation Factor (EK) has a positive effect on Behavioral Intention (NB) H2 : Effort ExpectancyFactor (EU) has a positive effect on Behavioral Intention (NB)
H3 : Social Influence Factor (PS) has a positive effect on Behavioral Intention (NB)
H4 : Facilitating Conditioning Factors (KF) have a positive effect on Use Behavior (PP)
H5 : Behavioral Intention (NB) has a significant influence on Use Behavior (PP)
H6 : Gender has a moderating effect that affects the Performance Expectation (EK) factor on Behavioral Intention (NB).
H7 : Gender has a moderating effect that influences the Effort Expectancy(EU) factor on Behavioral Intention (NB).
H8 : Gender has a moderating effect that affects the Social Influence (PS) factor on Behavioral Intention (NB).
H9 : Experience has a moderating effect that influences the Effort Expectancy(EU) factor on Behavioral Intention (NB).
H10 : Experience having a moderating effect that affects Social Influence (PS) factors has a positive effect on Behavioral Intention (NB).
H11 : Experience has a moderating effect that affects the Facilitating Condition (KF) factor for Use Behavior (PP).
H12 : Volunteerism has a moderating effect that affects the Social Influence (PS) factor on Behavioral Intention (NB)
1895 and Information Management, aims to obtain proportional samples. Data analysis in this study uses the SEM (modelStructural Equation Modeling)with the AMOS 24 application. Structural
Equation Modellling (SEM) is a combination of two
separate statistical methods namelyfactor
analysisdeveloped in psychology and psychometrics
and simultaneous equation models (simultaneous equation modeling) developed in econometrics [15]. Questionnaire questions are divided into 2 parts, namely:
1. Questions about identity of the respondent related to department, class, gender, how long have you used e-learning, voluntariness. 2. Statement about research variables with a total
[image:5.612.314.519.82.444.2]of 28 items which include 5 points of Performance Expectancy statement , 4 items of Effort Expectancy statement , 4 items of Social Influence statement, 6 items of Facilitating Conditions statement, 5 items of Behavioral Intention statement, 4 items of Use Behavior statement. Details of the questionnaire statement can be seen in Table 1.
Table 1 Details of Question on Questionnaire
Performance Expectancy
1. With E-learning I will achieve better learning goals
2. With E-learning can improve the efficiency of my learning
3. With E-learning it can be useful for my learning activities
4. With E-learning can improve my competence
5. With E-learning can improve my academic achievement
Effort Expectancy
1. E-learning is easy to use 2. E-learning is easy for me
3. E-learning easily facilitates learning 4. Use of E-learning is easy to understand
Social Influence
1. People who are important to me think I have to use E-learning
2. My lecturer has helped me to use E-learning.
3. I use E-learning because people around me use it.
4. Not using E-learning will miss other people
Facilitating Condition
1. I have the resources needed to use E-learning.
2. I have the knowledge needed to use E-learningE-learning
3. Allcontents are easy to understand
4. All facilities available in E-learning are easy to use
5. Internet access is available at work 6. Internet access is available at home
Behavioral Intention
1. I intend to use E-learning so on 2. I will use E-learning in my learning
3. E-learning will be used for academic
related purposes
4. E-learning will be used to improve my competency
5. E-learning will be used continuously in each lesson
Use Behavior
1. Using E-learning is a good idea 2. Learning is more interesting by using E-learning
3. I am willing to use E-learning during my studies.
4. I have no problem providing resources in the form of funds and time to use E-learning
4. RESULTS AND DISCUSSION
The population in this study consisted of 2561 active students, who majored in Informatics, Information Systems, and Information Management. Total of 346 questionnaires can be analyzed using AMOS. Based on the data collected. Based on data from questionnaires that have been received, the following are the results of the presentation of the characteristics of respondents based on Department, Force, Gender, Experience, voluntariness.
Table 2 Demographics of students surveyed
Department
Informatics Enginering
(TI) 173 46%
Information Systems (SI) 159 50% Management Information
(MI) 14 14,4%
Class of
2014 82 24%
2015 80 23%
2016 88 25%
[image:5.612.88.516.370.723.2]1896
Gender
Male 241 70%
Female 105 30%
Experience
1-2 Semester 95 28%
3-4 Semester 91 26%
More than 5 semesters 160 46%
Voluntariness
Not voluntary 57 16
Volunteer 289 84
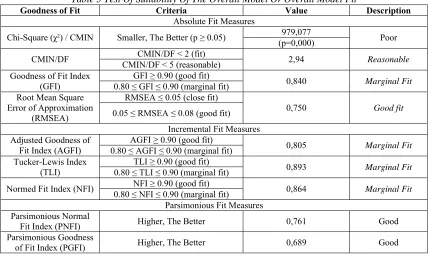
[image:6.612.89.532.54.166.2]The results of the analysis of the size of the measurement test for the suitability of the whole model can be seen in Table 3 [15]
Table 3 Test Of Suitability Of The Overall Model Or Overall Model Fit
Goodness of Fit Criteria Value Description
Absolute Fit Measures
Chi-Square (χ²) / CMIN Smaller, The Better (p ≥ 0.05) (p=0,000) 979,077 Poor
CMIN/DF CMIN/DF < 5 (reasonable) CMIN/DF < 2 (fit) 2,94 Reasonable
Goodness of Fit Index (GFI)
GFI ≥ 0.90 (good fit) 0,840
Marginal Fit
0.80 ≤ GFI ≤ 0.90 (marginal fit) Root Mean Square
Error of Approximation (RMSEA)
RMSEA ≤ 0.05 (close fit)
0,750 Good fit
0.05 ≤ RMSEA ≤ 0.08 (good fit) Incremental Fit Measures Adjusted Goodness of
Fit Index (AGFI)
AGFI ≥ 0.90 (good fit) 0,805
Marginal Fit
0.80 ≤ AGFI ≤ 0.90 (marginal fit) Tucker-Lewis Index
(TLI)
TLI ≥ 0.90 (good fit) 0,893
Marginal Fit
0.80 ≤ TLI ≤ 0.90 (marginal fit)
Normed Fit Index (NFI) 0.80 ≤ NFI ≤ 0.90 (marginal fit) NFI ≥ 0.90 (good fit) 0,864 Marginal Fit
Parsimonious Fit Measures Parsimonious Normal
Fit Index (PNFI) Higher, The Better 0,761 Good
Parsimonious Goodness
of Fit Index (PGFI) Higher, The Better 0,689 Good
According to Table 3, the compatibility test of the overall model or overall model fit is known that the chi-square value is 979,077 and the probability value is 0,000. This shows that the model is not fit when viewed from the chi-square value. But you need to know that the chi-square value is very sensitive to the number of samples. The sample used for 346 is of considerable value, so it is necessary to look for other fit model sizes, such as GFI, AGFI, RMSEA [15].
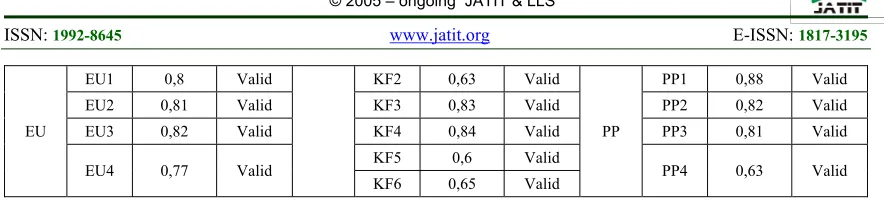
After the overall suitability of the model is good, then the next measurement model is made. This test is done by measuring validity and reliability for each construct. A construct is said to be valid if the value is standardized loading factor ≥ 0.50 and ideally it should be ≥ 0.70. Constructs have good reliability if the value of construct reliability (CR) 70 0.70 and the value of average variance extracted (AVE) ≥ 0.50[15]. The standardized loading factor and the validity test results for each construct include:
Tabel 1 Validity and Reliability Testing
Varia ble
Indica tor
Standar dized Loading
Factor
Descrip tion
Varia ble
Indica tor
Standar dized Loading
Factor
Descrip tion
Varia ble
Indica tor
Standar dized Loading
Factor
Descrip tion
EK
EK1 0,85 Valid
PS
PS1 0,78 Valid
NB
NB1 0,74 Valid
EK2 0,75 Valid PS2 0,77 Valid NB2 0,85 Valid
EK3 0,82 Valid PS3 0,64 Valid NB3 0,81 Valid
EK4 0,78 Valid PS4 0,7 Valid NB4 0,8 Valid
[image:6.612.92.521.219.474.2]1897 EU
EU1 0,8 Valid KF2 0,63 Valid
PP
PP1 0,88 Valid
EU2 0,81 Valid KF3 0,83 Valid PP2 0,82 Valid
EU3 0,82 Valid KF4 0,84 Valid PP3 0,81 Valid
EU4 0,77 Valid KF5 0,6 Valid PP4 0,63 Valid
KF6 0,65 Valid
[image:7.612.88.530.61.161.2] [image:7.612.168.446.235.423.2]Based on the validity test in Table 4, it can be seen 23 indicators has standardized loading factor value equal to or greater than 0.70 and 5 indicators have standardized loading factor value is greater than 0.50. So, it can be concluded that overall the validity of the indicators in the construct is valid. Reliability test results measured using the values construct reliability (CR) and average variance extracted (AVE) can be seen in Table 4.5.
Table 5 Test Results Reliability
CONSTRUCT CR AVE Description
EK 0,93 0,61 Reliable
EU 0,93 0,64 Reliable
PS 0,88 0,52 Reliable
KF 0,91 0,50 Reliable
NB 0,94 0,64 Reliable
PP 0,92 0,62 Reliable
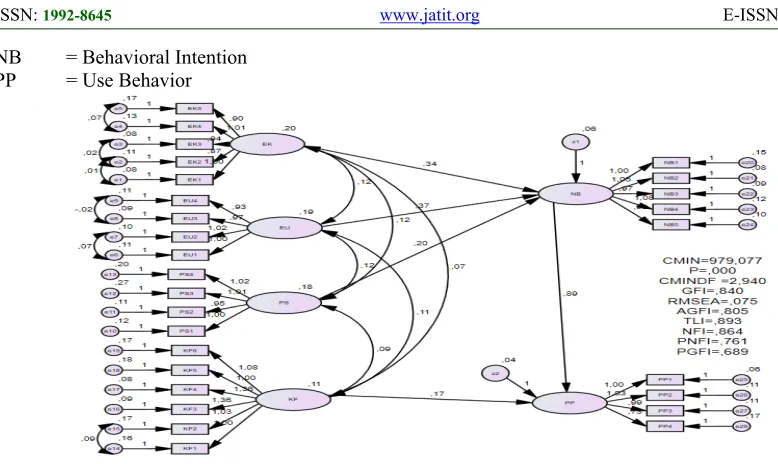
Based on Table 5, the calculation results show that all constructs have a construct reliability (CR) value greater than 0.70 and the value of Average Variance Extracted (AVE) is greater than 0.50. Thus, it can be concluded that each construct is reliable and meets the requirements to enter the next measurement stage. Next, testing the suitability of the structural model (structural model) involves the significance of the coefficient. AMOS output gives the results of estimated coefficients, standard errors, and the value of the critical ratio (CR) for each coefficient. A relationship will be called significant at the 95% confidence level if the value of the critical ratio (CR) ≥ 1.96 or the value probability (p) ≤ 0.05. Thus, it can be concluded that the hypothesis is accepted if the value of CR ≥ 1.96 or p value ≤ 0.05, and vice versa the hypothesis is rejected if the value of CR <1.96 or the value of p> 0.05.
Table 6 shows the results of testing hypotheses that are processed from AMOS Outputs.
Table 6 Hypothesis Test Results
Hypothesis Relationship Estimate S.E. C.R. P Hasil
H1 NB <--- EK 0,3405 0,063 5,4086 *** Accepted
H2 NB <--- EU 0,3713 0,0671 5,5313 *** Accepted
H3 NB <--- PS 0,2003 0,0686 2,9203 0,0035 Accepted
H4 PP <--- KF 0,1731 0,0731 2,3685 0,0179 Accepted
H5 PP <--- NB 0,8938 0,0739 12,0875 *** Accepted
Description:
*** = Probability value smaller than 0.001 EK = Performance Expectancy
1898 NB = Behavioral Intention
[image:8.612.93.482.71.303.2]PP = Use Behavior
Figure 4 Hypothesis Test Results
Furthermore, Testing the SEM moderating model can also be analyzed using a multi group analysis approach to test the compatibility of the structural model (structural model) which involves the significance of the coefficients. AMOS output gives the results of estimated coefficients, standard errors, and the value of the critical ratio (CR) for each coefficient. A relationship will be called significant at the 95% confidence level if the value of the critical
ratio (CR) ≥ 1.96 or the probability value (p) ≤ 0.05. If it is different then there is a significant moderating influence in the model [15]
In this study there are 3 moderating variables namely Gender Variables, Experience Variables, Voluntariness Variables. Table 7 Shows the Results of Model Regression Analysis with Moderation of Gender processed from AMOS Outputs.
Table 7 Results of Model Regression Analysis with Gender Moderation
Relationship Gender Estimate S.E. C.R. P Result
NB <--- EK Male 0,3725 0,0803 4,6368 *** Significant
Female 0,3056 0,103 2,966 0,003 Significant
NB <--- EU Male 0,3867 0,0747 5,1795 *** Significant
Female 0,3118 0,1433 2,1761 0,0295 Significant
NB <--- PS Male 0,1484 0,0699 2,1245 0,0336 Significant
Female 0,4127 0,2131 1,9373 0,0527 Not significant
PP <--- KF Male 0,2234 0,0819 2,7267 0,0064 Significant
Female -0,0443 0,1622 -0,2729 0,785 Not significant
Conclusions from the testing of the Regression Analysis Model with Gender Moderation can be seen in Table 8.
Table 8 Results of Model Regression Analysis with Moderation of Gender
HYPOTHESES DESCRIPTION
H6: Gender has a moderating effect that affects Performance Expectation factors (
EK) on Intention to Behavior (NB) REFUSED
H7: Gender has a moderating effect that influences the factor of Effort
Expectancy(EU) on Intimate Intention (NB). REFUSED
H8: Gender has a moderating effect that influences the Social Influence (PS) factor
[image:8.612.137.476.475.589.2]1899
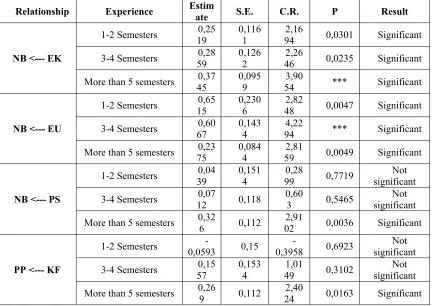
[image:9.612.92.524.175.481.2]Table 9 shows the results of model regression analysis with experience moderation which is processed from AMOS output.
Table 9 Results of Regression Analysis Model with Moderation Experience
Relationship Experience Estimate S.E. C.R. P Result
NB <--- EK
1-2 Semesters 19 0,25 0,1161 94 2,16 0,0301 Significant
3-4 Semesters 59 0,28 0,1262 46 2,26 0,0235 Significant
More than 5 semesters 45 0,37 0,0959 54 3,90 *** Significant
NB <--- EU
1-2 Semesters 15 0,65 0,2306 48 2,82 0,0047 Significant
3-4 Semesters 67 0,60 0,1434 94 4,22 *** Significant
More than 5 semesters 75 0,23 0,0844 59 2,81 0,0049 Significant
NB <--- PS
1-2 Semesters 39 0,04 0,1514 99 0,28 0,7719 significant Not
3-4 Semesters 12 0,07 0,118 0,603 0,5465 significant Not
More than 5 semesters 0,326 0,112 02 2,91 0,0036 Significant
PP <--- KF
1-2 Semesters 0,0593 - 0,15 0,3958 - 0,6923 significant Not
3-4 Semesters 57 0,15 0,1534 49 1,01 0,3102 significant Not
More than 5 semesters 0,269 0,112 24 2,40 0,0163 Significant
The conclusion of the test results of Model Regression Analysis with Moderation Experience can be seen in table 10.
Table 10 Results of Model Regression Analysis with Experience Moderation
HYPOTHESES DESCRIPTION
H9: Experience has a moderating effect that influences the Effort Expectation (EU) factor on
Behavioral Intention (NB). REFUSED
H10: Experience having a moderating effect that affects the Social Influence (PS) factor has a positive
effect on Behavioral Intention (NB). ACCEPTED
H11: Experience has a moderating effect that affects the Facilitating Condition (KF) factor for Use
Behavior (PP). ACCEPTED
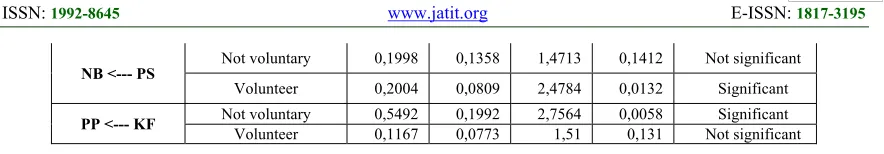
Table 11 Shows the Results of Model Regression Analysis with Moderation of voluntariness processed from AMOS Output.
Table 11 Results of Model Regression Analysis with Moderation of voluntariness
Relationship Voluntariness Estimate S.E. C.R. P Result
NB <--- EK Not voluntary 0,3886 0,1799 2,1603 0,0308 Significant
Volunteer 0,345 0,0681 5,0651 *** Significant
NB <--- EU Not voluntary 0,2439 0,1573 1,5511 0,1209 Not significant
1900
NB <--- PS Not voluntary 0,1998 0,1358 1,4713 0,1412 Not significant
Volunteer 0,2004 0,0809 2,4784 0,0132 Significant
PP <--- KF Not voluntary 0,5492 0,1992 2,7564 0,0058 Significant
Volunteer 0,1167 0,0773 1,51 0,131 Not significant
[image:10.612.89.531.72.149.2]Conclusions from the testing of Model Regression Analysis with Moderation of voluntariness can be seen in Table 12.
Table 12 Results of Model Regression Analysis with Moderation of voluntariness
HYPOTHESES DESCRIPTION
H12 : voluntariness has a moderating effect that influences the Social Influence (PS) factor on Behavioral
Intentions (NB) ACCEPTED
5. CONCLUSIONS
The use of technology has become one of the factors needed by universities to be able to compete and survive. Electronic learning (e-learning) is the use of Internet and digital technologies to create experience in educating others. E-Learning is used in lectures at STMIK Mikroskil to help students and lecturers in the teaching and learning process. This study uses the UTAUT (Unified Theory of Acceptance and Use of Technology) model. The aim is to analyze the tendency of users of e-learning systems at STMIK Mikroskil Medan, by testing whether Behavioral Intention and behavior to use a technology are influenced by Performance Expectancy, Effort Expectancy, Social Influence, and Facilitating Conditions. These four factors are moderated by gender, experience, and risk factors.
Questionnaire data were collected from 346 active students and analyzed by structural equation modeling (SEM) using AMOS 24. The results of this study showed Performance Expectation Factors, Effort ExpectancyFactors, Social Influence Factors had a positive effect on Behavioral Intention, Facilitating Conditions Factors positively influenced Use Behavior, Behavioral Intention has a significant influence on Use Behavior. Gender does not have a moderating effect that affects the factors of Performance Expectation and Effort Expectancyon Behavioral Intention, but Gender has a moderating effect that affects Social Influence factors towards Behavioral Intention. Experience does not have a moderating effect that influences Business Expectancy factors on Behavioral Intention. However, experience has a moderating effect that influences Social Influence factors that have a positive effect on Behavioral Intention. Experience also has a moderating effect that affects the Facilitating Conditions factor for Use Behavior. Voluntariness has a moderating
effect that affects Social Influence factors towards Behavioral Intention.
REFERENCES
[1] V. Venkatesh, M. G. . Morris, G. B. . Davis, and F. D. . Davis, “User Acceptance of Information Technology : Toward a Unified View, MIS Q,” Int. J. Comput. Sci. Appl., vol. 27, no. 3, pp. 425–478, 2003.
[2] G. B. Sulistyo, “Efektivitas Penggunaan E-Learning Moodle Sebagai Media Pembelajaran Terhadap Nilai Siswa di SMK Ma â€TM Arif Kota Mungkid,” J. Bianglala Inform., vol. 1, pp. 40–49, 2013.
[3] T. Handayani and Sudiana, “Analisi Penerapan Model UTAUT Terhadap Perilaku Pengguna Sistem Informasi (Studi Kasus: Sistem Informasi Akademik Pada STTNAS Yogyakarta,” Pros. Semin. Nas. ReTII ke-10, pp. 688–696, 2015.
[4] H. P. Yueh, J. Y. Huang, and C. Chang, “Exploring factors affecting students’ continued Wiki use for individual and collaborative learning: An extended UTAUT perspective,” Australas. J. Educ. Technol., vol. 31, no. 1, pp. 16–31, 2015.
[5] E. Hartati, “Analisis Sistem Penerapan E-Learning Dengan Menggunakan Metode UTAUT ( Unified Theory of Acceptanced Use of Technolog ) ( Study Kasus : STMIK XYZ ),” vol. 8, no. 1, pp. 13–18, 2017. [6] T. Thomas, L. Singh, and K. Gaffar, “The
utility of the UTAUT model in explaining mobile learning adoption in higher education in Guyana,” … J. Educ. …, vol. 9, no. 3, pp. 71–85, 2013.
1901 Pendaftaran Online (E-Health) Berdasarkan Unified Theory Of Accepptance And Use Of Technology (UTAUT),” J. Adm. Kesehat. Indones., vol. 5, pp. 72–81, 2017.
[9] R. K. J. Bendi and S. Andayani, “Analisis Perilaku Penggunaan Sistem Informasi Menggunakan Model UTAUT,” vol. 2013, no. November, pp. 277–282, 2013.
[10] N. A. Farabi, “Analisis Penerapan Sistem informasi ZISW Dengan Menggunakan Metode UTAUT,” Indones. J. Comput. Inf. Technol., vol. 1, no. 2, pp. 71–79, 2016. [11] R. (Moh’d T. Masa’deh, A. Tarhini, A. Bany
Mohammed, and M. Maqableh, “Modeling Factors Affecting Student’s Usage Behaviour of E-Learning Systems in Lebanon,” Int. J. Bus. Manag., vol. 11, no. 2, p. 299, 2016. [12] O. B. Ayoade, “Factors influencing students
’ behavioural intention to adopt and use mobile learning in higher educational institutions in Nigeria : An example of Ekiti State University , Ado-Ekiti,” Int. J. Emerg. Technol. Adv. Eng., vol. 5, no. 4, pp. 307– 313, 2015.
[13] N. Ain, K. Kaur, and M. Waheed, “The influence of learning value on learning management system use : An extension of UTAUT2,” 2015.
[14] D. Destaningrum, Suprapto, and N. H. Wardani, “Analisis Faktor Penerimaan Pengguna E-Learning SMA Negeri di Kota Blitar Menggunakan Model Unified Theory of Acceptance and Use of Technology ( UTAUT ),” J. Pengemb. Teknol. Inf. dan Ilmu Komput., vol. 2, no. 2, pp. 723–732, 2018.
[15] I. Ghozali, Model Persamaan Struktural: Konsep dan Aplikasi Dengan Program
AMOS 24. Semarang: Badan Penerbit