1266
1SU-YEON KIM, 2SANG HOON LEE
1School of Computer and Information Engineering, Daegu University, Korea
2Department of Computer and Information Engineering, Daegu University, Korea
E-mail: 1[email protected], 2[email protected]
ABSTRACT
In this study, we designed an advertisement recommendation framework taking into account the interests of users through utilizing their user profiles, preferences and responses to contents and advertisements. This is to address the issue on advertisement nuisance to users when using a content service that has advertisements before or during a content viewing. This kind of marketing strategy of content providers aims to generate more revenues, however, on the user’s side, it does not give any convenience which turned out to be a customer unfriendly attribute. Therefore, the purpose of this study is to extract user’s preference and behavior information and place it in the middle of content viewing to minimize the user’s negative approach towards advertisement serving its purpose and maximizing its effectiveness.
Keywords: Multi-Layered Ads Recommendation, User Preference, Content-Based Filtering, Collaborative Filtering, RFM Analysis
1. INTRODUCTION
Recently, the global mobile and internet advertising market is constantly growing. Mobile ad investments are expected to drive gains, representing 62.5% of digital ad costs [1]. Digital’s growth is primarily due to advertiser’s high interest in mobile ad formats and this has led to the increase of prices because of the growing competition for mobile ad space. The mobile ad spending worldwide was increased to 33.6% from 2016, which totally amounted to $142.78 billion this year which is around one-quarter of the media ad spending. In 2017, worldwide digital ad spending will expand to $228.44 billion, which is 19.1% of the total spending. It may be that as digital media markets develop, and as user experiences enhance, advertising spending is becoming more efficient. According to PWC Global E&M report, there are four major factors that have huge impact on the growth of the global entertainment and media (E&M), namely the Internet access, advertising, video, and gaming [2].
Advertisements provided by various broadcasting companies and contents services providers are usually introduced in the middle of video viewing, where it is visible to the viewers, however, many viewers are also anticipated to overlook the introduced advertisements due to lack
of interest. This scenario calls for an urgent action to minimize user’s resistance on advertisement selection and change user’s perception towards the useful information advertisements provide instead of spam.
The present invention relates to a framework that recommends the most suitable advertisment to a user while viewing a specific content based on the following. First, the user population is derived using the content-based filtering based on the content, and the second is the user population based on the advertisement. After extracting the population from the first layer, filtering is performed in the second layer reflecting the user profile and user preference. It is different from existing recommendation system by considering both static information and dynamic information about the user.
2. RELATED WORKS
2.1 Recommendation Techniques
There have been many studies related to recommendation. Several techniques such as content-based filtering, collaborative filtering, and hybrid method combining both techniques have been performed. Content-based filtering (CBF) selects information based on semantic content, whereas collaborative filtering (CF) combines the opinions of other users to make a prediction for a
A MULTI-LAYERED ADS RECOMMENDATION FRAMEWORK
1267 target user [3]. It is expected to be more effective in terms of acceptance of the actual recommendation results.
Content-based filtering methods make recommendations by analyzing the description of the items that have been rated by the user and the description of items to be recommended. CBF system selects and determines items based on the correlation and relationship between the content of the items in the dataset [4]. A variety of algorithms have been proposed for analyzing the content of text documents and finding regularities in this content that can serve as the basis for making recommendations [5].
Collaborative filtering approach is the most popular approach for recommendation systems design. It utilizes a large amount of data collected from user behavior in the past and predicts which items users will like. It does not need to analyze the content of the items. Instead, it relies on the relationship between users and items, which are typically encoded in a rating feedback matrix with each element representing a specific user rating on a specific item [6].
The hybrid recommendation system, which combines content-based filters and collaborative filters, capitalizes on the strengths of each method [7]. Kim et al. (2006) integrated the semantic contents from user profiles and user ratings to calculate user-user similarity [3]. A new Bayesian network model to deal with the problem of hybrid recommendation by combining content-based and collaborative features has been presented [8]. Basilico and Hofmann (2004) proposed a unified approach that systematically integrates all available training information such as past user-item ratings as well as attributes of user-items or users to learn a prediction function [9]. Duzen and Aktas (2016) proposed a hybrid recommender system that utilizes Case-Based Reasoning (CBR) in order to overcome cold-start problem of CF and improve the success rate of the recommender system [10].
As discussed above, recommendation techniques are widely used in various fields including content recommendation for mobile users [11], personalized recommendation model of Internet ads [12], recommending TV programs [13], online shopping recommendation based on analysis of customer opinions [14], articles recommending for researchers [15], book recommendation through contents [4], and music similarity computation [16]. This research proposes a multi-layered method by adding layers reflecting the user’s preference and RFM (recency, frequency, and
monetary) analysis as well as the existing CBF and CF techniques.
2.2 Advertisements Recommendation
Several ranking-based algorithms have been suggested for recommending advertisement keywords. Zhang et al. (2012) proposed a novel algorithm for short-text Web pages advertising keywords recommendation that leverages the contents of Wikipedia which has numerous entities related with a topic linked to each other [17]. A content-biased PageRank is applied to rank the related entities and an advertisement-biased factor is added to recommend high-quality advertising keywords that are relevant to the target Web page. Many approaches during the experiments have been compared and the results show that the proposed method has more substantial improvement in the precision of the recommended keywords on short-text Web pages. The social network platforms learn predictive models that deliver ads to potential customers with personal interests. Li et al. (2016) proposed a context-aware advertising framework that encourages growth with ad click-through rate, taking into account relatively static personal interests and friends’ dynamic news feeds to avoid repetitive ads. When a read action is triggered on a user, online search strategies that found the most relevant ads that matched the first real-time requirements. In addition, a method for quickly identifying a change to a user’s top k ads is proposed. Finally, a hybrid model is proposed combining the advantages of the two methods to analyze the dynamics of news feeds for an appropriate search strategy. Extensive experiments conducted on multiple real-world social network and ad data sets validated the effectiveness and robustness of the hybrid model [18].
2.3 RFM Analysis
1268 The three information sources that make the RFM scores are: a) Recency - The time when the customer had made a purchase with your organization. A customer who recently contacts your organization will probably acknowledge another interaction; b) Frequency - How regularly does this customer make purchases with your organization. It can forecast the schedule of purchases which will be made by the customer in the future; c) Monetary - How much total amount of spending the customer acquired on your organization’s products in the given time period [21].
Chen et al. (2009) proposed an algorithm for discovering RFM sequential patterns from customers’ purchasing data and empirically demonstrated the benefits of using RFM sequential patterns to evaluate the proposed algorithm [22]. RFM analysis techniques are widely used in marketing related fields, including customer lifetime value estimation [21, 23].
A related research of Cho et al. (2012) applies RFM technique in the field of recommendation system. This study presented a recommendation framework which is a new method of applying k-means clustering of item categories based on RFM in u-commerce under ubiquitous computing condition which is required for a real-time accessibility and agility and implemented the
personalized recommendation system [24].
Wei et al. (2010) reviewed the application of RFM model on various fields, aimed to provide a comprehensive review of the model application. In addition, the paper depicted the definition and the scoring scheme of RFM and presented a summary on how RFM model has been effectively applied in a wide variety of areas. Also, the paper described the extended RFM model by means of an introduction of how RFM combines with other variables and models.
3. RESEARCH FRAMEWORK
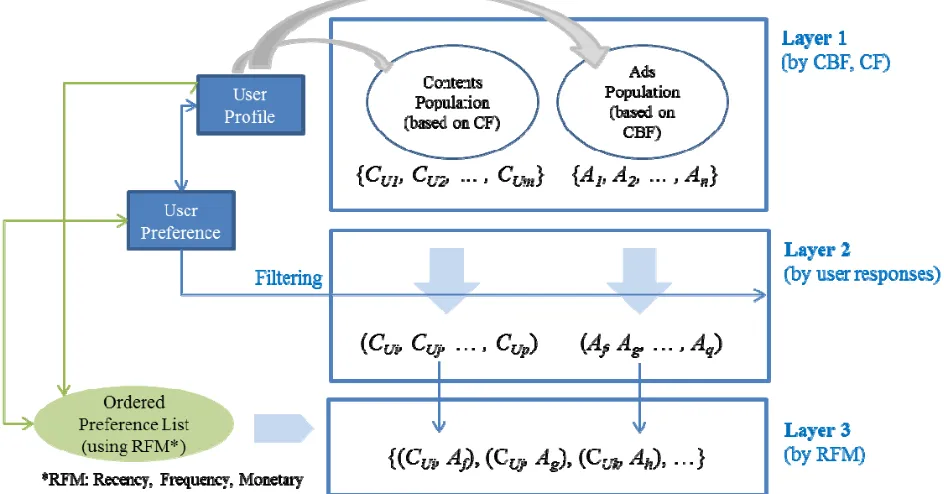
This research proposes a multi-layered recommendation framework as shown in Figure 1, which reflects a) contents population based on CF and advertisements population based on CBF, b) user’s responses, and c) RFM analysis.
[image:3.612.89.561.444.691.2]In the proposed framework, the first layer is a step of generating a population based on universal preference. The second layer is a step of filtering the preference population based on user’s individual behavior. A module for storing user preferences defining the selection criteria of the content and advertisement, and a processor electrically connected to the module performs the following steps.
1269 3.1 Layer 1: Contents/Ads Population Creation
In the first layer, CF-based content population and CBF-based advertisement population are created.
Contents Population based on CF
= {CU1, CU2, … , CUi,, … , CUm} (1)
where
CU1 is the most preferable content of 1st user extracted from similar users based on CF
CUi is the most preferable content of i-th user extracted from similar users based on CF
m is the total number of similar users
based on CF
Ads Population based on CBF
= {A1, A2, … , Aj,, … , An} (2)
where
A1 is the advertisement that matches the user profile and highest ranking based on CBF
Aj is the advertisement that matches the user profile and j-th rank based on CBF
n is the total number of advertisements
that matches the user profile based on CBF
These two populations are the inputs for the next layer of filtering. Each population is generated based on the user profile. In the case of CF-based population, other contents watched by similar users are extracted. The CBF-based population extracts ads that are close to the target audience according to the user profile.
3.2 Layer 2: Filtering Populations
The second layer filters content and ads based on the user’s reaction when the content and the ad are presented. It searches for preferred objects according to individual user statistics managed by content and advertisement and excludes those with low preference.
Content Population after Filtering
= {CUi, CUj, … , CUp} (3)
where
CUi and CUj are selected contents from population of (1) based on user’s response
p is the number of selected contents based
on user’s response
Ads Population after Filtering
= {Af, Ag, … , Aq} (4)
where
Af and Ag are selected advertisements from population of (2) based on user’s response
q is the number of selected advertisements
based on user’s response
3.3 Layer 3: Ordered Preference List Generation
The RFM score can be a basis factor determining user’s behavior on the specific situation and enable the personalized recommendation. The RFM score will be calculated as follows:
RFM score = w1 * RS + w2 * FS + w3 * MS
(5)
where
w1, w2, w3 are weights of each factor
RS: recency score according to the number of
days since the last transaction
FS: frequency score according to the total
number of times user has made transaction within a specific period (e.g. three months)
MS: monetary score according to the total
amount that user has paid for transactions within a specific period
The third layer creates an ordered preference list using the RFM analysis, determines the priorities and recommendation probabilities of the filtered results at layer 2, and calculates recommendation results accordingly.
Ordered Preference List (6) = {(CUi, Af), (CUj, Ag), (CUk,Ah), …}
4. AN ILLUSTRATIVE EXAMPLE
The multi-layer recommendation process has implemented below as a case study.
1270 Table 1: Population Creation
Initial Population (n=1000)
Content Population based on CF CU1, CU2, … ,
CU1000
Ads Population based on CBF A1, A2, … ,
A1000
Population after Filtering (n=100)
Content Population after Filtering CU5, CU20,
… , CU47
Ads Population after Filtering A7, A15, … ,
A78
When the first population is generated, the filtered second set is calculated according to the user’s tendency. The user’s preference can be input to the user's favorite genre, actor, director, etc.
The third step uses the RFM analysis to generate a ranked list of priorities based on the user’s most recent view, the most frequently viewed, and the paid amount of the original contents and advertisements. The RFM score is calculated according to the criteria shown in Table 2-4.
[image:5.612.344.488.105.189.2]Recency score is an indicator of how recently users have watched the contents or ads and set a five-scale threshold as shown in Table 2.
Table 2: Recency Score (RS) Criteria
RS Criteria (days) RS1 > 120 RS2 91 ~ 120 RS3 31 ~ 90 RS4 16 ~ 30 RS5 <= 15
[image:5.612.311.525.398.621.2]Frequency score is an indicator of how often users have watched the contents or ads and set criteria as shown in Table 3.
Table 3: Frequency Score (FS) Criteria
FS Criteria (freq.) FS1 <= 1 FS2 2 ~ 3 FS3 4 ~ 5 FS4 6 ~ 9 FS5 > 9
The Monetary score is an indicator of how much you paid for your contents or ads and set the criteria as shown in Table 4. Here, KRW stands for Korean Won as the Korean currency.
Table 4: Monetary Score (MS) Criteria
MS Criteria (KRW) MS1 < 1,000 MS2 1,000 ~ 5,000 MS3 5,000 ~ 10,000 MS4 10,000 ~ 50,000 MS5 > 50,000
The final score is calculated using Equation (5), using three scores and weights. The weights can be initialized differently according to the ranking that the service provider thinks, is important, which can be adjusted according to the recommendation result and the acceptance rate.
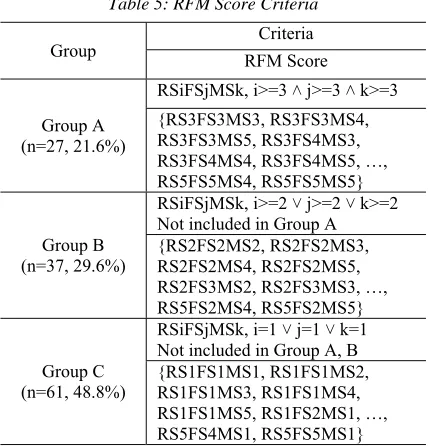
Assuming that the weights for R, F, and M are the same, there are 125 possible combinations. We extract the group A (upper 21.6%) by taking the values of R, F, and M of all three or more. Next, if any one of the weights is 2, it is assigned to group B, which corresponds to 29.6% (cumulative probability 51.2%). Finally, a combination containing a weight of 1 is assigned to group C, which accounts for nearly half (48.8%) of the total. Table 5 shows the indicators for these RFM scores.
Table 5: RFM Score Criteria
Group RFM Score Criteria
Group A (n=27, 21.6%)
RSiFSjMSk, i>=3 ˄ j>=3 ˄ k>=3 {RS3FS3MS3, RS3FS3MS4, RS3FS3MS5, RS3FS4MS3, RS3FS4MS4, RS3FS4MS5, …, RS5FS5MS4, RS5FS5MS5}
Group B (n=37, 29.6%)
RSiFSjMSk, i>=2 ˅ j>=2 ˅ k>=2 Not included in Group A {RS2FS2MS2, RS2FS2MS3, RS2FS2MS4, RS2FS2MS5, RS2FS3MS2, RS2FS3MS3, …, RS5FS2MS4, RS5FS2MS5}
Group C (n=61, 48.8%)
RSiFSjMSk, i=1 ˅ j=1 ˅ k=1 Not included in Group A, B {RS1FS1MS1, RS1FS1MS2, RS1FS1MS3, RS1FS1MS4, RS1FS1MS5, RS1FS2MS1, …, RS5FS4MS1, RS5FS5MS1}
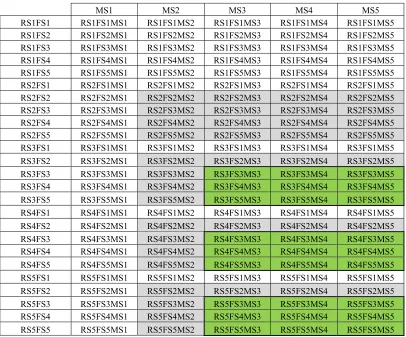
[image:5.612.126.265.433.518.2] [image:5.612.125.266.581.665.2]1271
Table 6: Evaluation Criteria for RFM Score by group
MS1 MS2 MS3 MS4 MS5
RS1FS1 RS1FS1MS1 RS1FS1MS2 RS1FS1MS3 RS1FS1MS4 RS1FS1MS5 RS1FS2 RS1FS2MS1 RS1FS2MS2 RS1FS2MS3 RS1FS2MS4 RS1FS2MS5 RS1FS3 RS1FS3MS1 RS1FS3MS2 RS1FS3MS3 RS1FS3MS4 RS1FS3MS5 RS1FS4 RS1FS4MS1 RS1FS4MS2 RS1FS4MS3 RS1FS4MS4 RS1FS4MS5 RS1FS5 RS1FS5MS1 RS1FS5MS2 RS1FS5MS3 RS1FS5MS4 RS1FS5MS5 RS2FS1 RS2FS1MS1 RS2FS1MS2 RS2FS1MS3 RS2FS1MS4 RS2FS1MS5 RS2FS2 RS2FS2MS1 RS2FS2MS2 RS2FS2MS3 RS2FS2MS4 RS2FS2MS5 RS2FS3 RS2FS3MS1 RS2FS3MS2 RS2FS3MS3 RS2FS3MS4 RS2FS3MS5 RS2FS4 RS2FS4MS1 RS2FS4MS2 RS2FS4MS3 RS2FS4MS4 RS2FS4MS5 RS2FS5 RS2FS5MS1 RS2FS5MS2 RS2FS5MS3 RS2FS5MS4 RS2FS5MS5 RS3FS1 RS3FS1MS1 RS3FS1MS2 RS3FS1MS3 RS3FS1MS4 RS3FS1MS5 RS3FS2 RS3FS2MS1 RS3FS2MS2 RS3FS2MS3 RS3FS2MS4 RS3FS2MS5 RS3FS3 RS3FS3MS1 RS3FS3MS2 RS3FS3MS3 RS3FS3MS4 RS3FS3MS5 RS3FS4 RS3FS4MS1 RS3FS4MS2 RS3FS4MS3 RS3FS4MS4 RS3FS4MS5 RS3FS5 RS3FS5MS1 RS3FS5MS2 RS3FS5MS3 RS3FS5MS4 RS3FS5MS5 RS4FS1 RS4FS1MS1 RS4FS1MS2 RS4FS1MS3 RS4FS1MS4 RS4FS1MS5 RS4FS2 RS4FS2MS1 RS4FS2MS2 RS4FS2MS3 RS4FS2MS4 RS4FS2MS5 RS4FS3 RS4FS3MS1 RS4FS3MS2 RS4FS3MS3 RS4FS3MS4 RS4FS3MS5 RS4FS4 RS4FS4MS1 RS4FS4MS2 RS4FS4MS3 RS4FS4MS4 RS4FS4MS5 RS4FS5 RS4FS5MS1 RS4FS5MS2 RS4FS5MS3 RS4FS5MS4 RS4FS5MS5 RS5FS1 RS5FS1MS1 RS5FS1MS2 RS5FS1MS3 RS5FS1MS4 RS5FS1MS5 RS5FS2 RS5FS2MS1 RS5FS2MS2 RS5FS2MS3 RS5FS2MS4 RS5FS2MS5 RS5FS3 RS5FS3MS1 RS5FS3MS2 RS5FS3MS3 RS5FS3MS4 RS5FS3MS5 RS5FS4 RS5FS4MS1 RS5FS4MS2 RS5FS4MS3 RS5FS4MS4 RS5FS4MS5 RS5FS5 RS5FS5MS1 RS5FS5MS2 RS5FS5MS3 RS5FS5MS4 RS5FS5MS5
Recommendations sorted in descending order according to the RFM final score are presented. Suggested results consist of a pair of contents and related ads, and are shown to the user in priority order. There are two cases in which recommendations are executed: a) when a user wants to watch new content, the system recommends the content based on the preference and related ads to the user, b) while the user watches the content, the system recommends the advertisement that matches the content category.
Table 7 shows the advertisement segments with a bounce rate of 30% or more in a specific time period. This is an interval where the acceptance rate of the advertisement is remarkably low, and additional analysis is required.
[image:6.612.312.526.485.624.2]The important evaluation indicators for ads recommendation are related to ads acceptance such as supply-to-execution ratio (S-E ratio) and interval time/period bounce rate.
Table 7: Ads Exceeding the Bounce Rate Threshold
ID Time Imp Start Comp Skip B.R.
138--- 101 454 413 267 3 40.5
142--- 104 11 5 0 0 100.0
142--- 101 132 122 73 0 44.7
143--- 101 3128 2946 2089 15 32.7
143--- 101 27 26 14 0 48.2
144--- 101 10 9 3 0 70.0
302--- 105 28 4 2 0 92.9
302--- 101 1865 1744 1133 12 38.6
808--- 101 11 9 1 5 45.5
1272 interval bounce rate means the rate at which the ad stops and exits.
[image:7.612.311.519.107.325.2]The lower the interval bounce rate value, the better the acceptance rate of the recommended results. The system has improved after the application of the recommendation algorithm. It is expected that when data is accumulated and feedback on the recommendation results is performed, the performance will gradually improve.
Table 8: Performance Test Results (Web)
Date S-E Ratio IBC_Rate
Before RS 05/21/17 69.34% 29.61% 05/22/17 73.88% 24.62% 05/23/17 74.68% 24.54% 05/24/17 73.72% 28.33%
05/25/17 73.63% 27.40%
05/26/17 66.80% 36.19% 05/27/17 72.55% 26.83%
Average 72.09% 28.22%
After RS 07/21/17 72.55% 25.04%
07/22/17 81.34% 16.07% 07/23/17 71.52% 28.99% 07/24/17 79.77% 18.89%
07/25/17 79.85% 19.08%
07/26/17 77.57% 20.64% 07/27/17 78.31% 20.60%
Average 77.27% 21.33%
[image:7.612.89.287.220.441.2]*Recommender system launched: 06/07/17.
Table 9: Performance Test Results (Windows App)
Date S-E Ratio IBC_Rate
Before RS 05/21/17 65.52% 15.96% 05/22/17 62.88% 14.60% 05/23/17 63.93% 15.44% 05/24/17 64.46% 17.38%
05/25/17 63.47% 15.61%
05/26/17 62.58% 17.07% 05/27/17 63.08% 14.70%
Average 63.70% 15.82%
After RS 07/21/17 65.55% 11.00%
07/22/17 68.00% 9.44%
07/23/17 60.89% 11.48% 07/24/17 65.88% 11.62%
07/25/17 65.30% 11.23%
07/26/17 65.80% 12.48% 07/27/17 64.44% 12.18%
Average 65.12% 11.35%
*Recommender system launched: 06/07/17.
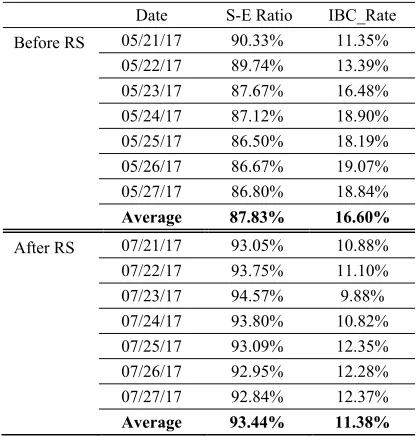
Table 10: Performance Test Results (Android App)
Date S-E Ratio IBC_Rate
Before RS 05/21/17 90.33% 11.35%
05/22/17 89.74% 13.39%
05/23/17 87.67% 16.48%
05/24/17 87.12% 18.90%
05/25/17 86.50% 18.19%
05/26/17 86.67% 19.07%
05/27/17 86.80% 18.84%
Average 87.83% 16.60%
After RS 07/21/17 93.05% 10.88%
07/22/17 93.75% 11.10%
07/23/17 94.57% 9.88%
07/24/17 93.80% 10.82%
07/25/17 93.09% 12.35%
07/26/17 92.95% 12.28%
07/27/17 92.84% 12.37%
Average 93.44% 11.38%
*Recommender system launched: 06/13/17.
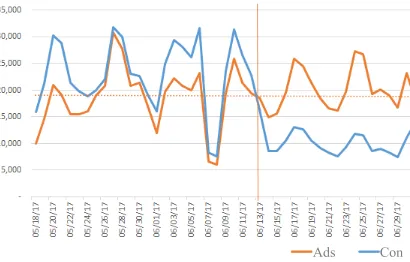
[image:7.612.315.520.460.592.2]Figure 2, 3 and 4 are graphs showing the number of ad plays versus the number of video plays in different environments. The system applying the recommendation algorithm has been in operation since June 7 and 13, 2017, as indicated by a vertical line on the graph. After applying the recommendation algorithm, the ratio of ads execution to contents was continuously increasing as displayed/shown in figure 2 and 3.
Figure 2: Contents-Ads Execution Ratio (Web)
[image:7.612.89.287.475.694.2]1273 Figure 3: Contents-Ads Execution Ratio (Windows
App)
[image:8.612.92.526.71.217.2]In Figure 4, which is an experimental test on the android app environment, the number of ad playbacks does not seem to increase after applying the recommendation system, due to the decreased in number of video playbacks. The ratio of the number of ad plays to the number of video plays increases as shown in Table 10, where the S-E ratio increased from 88.27% to 93.65%.
Figure 4: Contents-Ads Execution Ratio (Android App)
Figure 5, 6, and 7 are indices of the interval bounce rate in the middle of advertising. The interval bounce rate is gradually declining after applying the recommendation system, which means that the acceptance rate of the user is increased.
Figure 5: IntervalBounce Rate (Web)
Figure 6: Interval Bounce Rate (Windows App)
[image:8.612.312.523.283.371.2]In the case of Figure 6, which was executed in the windows app, the IBR temporarily moved up after applying the recommendation system, yet ultimately it entered the stabilization phase. As shown in Table 9, IBR decreased from 15.80% to 10.95% before and after introducing the recommendation system.
Figure 7: IntervalBounce Rate (Android App)
These two indicators represent users’ adoption rates and rejection rates for ads inserted in the middle of contents, and they are very important because they are directly related to the advertising image and profit. As the data accumulates, the accuracy of the recommendation also increases as well as the acceptability level of the users.
4. CONCLUSIONS
Most people have negative notions about the ads they see while watching content such as videos and TV shows. However, it is expected that the advertisement inserted in the middle of content watching will gradually increase not only on cable TV but also public-aired channel broadcasting. If we can provide useful information, rather than spam ads, distributed to all customers, users will be satisfied and that will increase user acceptance rate of the ads and ultimately benefit the service provider.
The purpose of this research is to propose a framework for recommending advertisements inserted in the content that are useful and beneficial to the viewers. To achieve this goal, we apply RFM analysis technique used in marketing as well as traditional recommendation techniques such as content-based filtering and collaborative filtering.
In the first layer we generated a population based on universal preference. The preference population based on user’s individual behavior has
Ads Con
[image:8.612.94.299.359.490.2]1274 been filtered in the second step. In the third layer, RFM analysis technique, which is widely used in marketing field, was applied.
We have implemented the advertisement recommendation system based on the proposed framework of this study together with one of Korea’s largest contents providers. The system recommends advertisements to viewers based on the information content of videos, other similar users’ behavior, user responses to ads, and RFM analysis of the content and ads. Experiments were performed on a plurality of platforms instead of one platform, so that the experimental results could be best generalized. Experiments were conducted through analyzing the behaviors of the users in the Web, Windows App, and Android App environments. As shown in Chapter 4, the performance of the recommendation system is continuously improved as compared to the performance before the recommendation system was introduced.
Since the launch of the recommendation system, key performance indicators have been continuously improving. We are currently working on one of the largest content providers in Korea in relation to this study. The results of the research will be registered as intellectual property rights and will be commercialized in cooperation with broadcasters and contents service providers. This research proposes a multi-layered ads recommendation framework considering user preference and behavior. Practically, it is expected to bring benefits to content service providers, advertising providers, and users.
More in-depth research is required to further enhance the recommendation system, including the determination of recommendation frequency and timing, by analyzing the contents information such as video, sound, and stories in the future.
ACKNOWLEDGMENT
This research was supported by the technology transfer and commercialization program through INNOPOLIS Foundation funded by the Ministry of Science, ICT and Future Planning. (2016DG0005 / Development of Intelligent Content and Advertisement Recommendation Platform)
REFERENCES:
[1] eMarketer Inc., Worldwide Ad Spending: The eMarketer Forecast for 2017, eMarketer Report, 2017.
[2] PWC, Perspectives from the Global Entertainment and Media Outlook 2017-2021, PWC Report, 2017.
[3] Byeong Man Kim, Qing Li, Chang Seok Park, Si Gwan Kim, and Ju Yeon Kim, A new approach for combining content-based and collaborative filters”, Journal of Intelligent Information Systems, Vol. 27, No. 1, 2006, pp.
79-91.
[4] Praveena Mathew, Bincy Kuriakose, and Vinayak Hegde, “Book Recommendation System through content based and collaborative filtering method”, Proceedings of International Conference on Data Mining and Advanced Computing (SAPIENCE),
Ernakulam (India), March 16-18, 2016, pp. 47-52.
[5] Michael J. Pazzani, “A Framework for Collaborative, Content-Based and Demographic Filtering”, Artificial Intelligence Review, Vol. 13, 1999, pp. 393-408.
[6] Wei, J., He, J., Chen, K., Zhou, Y., and Tang, Z., “Collaborative filtering and deep learning based recommendation system for cold start items”, Expert Systems With Applications, Vol.
69, 2017, pp. 29-39.
[7] Mimu Kawai and Shinya Nogami, “A Hybrid Recommender System of Collaborative and Content Based Filtering”, Information, Vol. 19,
No. 6B, 2016, pp. 2177-2183.
[8] Luis M. de Campos, Juan M. Fernández-Luna, Juan F. Huete, and Miguel A. Rueda-Morales, “Combining content-based and collaborative recommendations: A hybrid approach based on Bayesian networks”, International Journal of Approximate Reasoning, Vol. 51, No. 7, 2010,
pp. 785-799.
[9] Justin Basilico and Thomas Hofmann, “Unifying collaborative and content-based filtering”, Proceedings of the twenty-first international conference on Machine learning (ICML), Banff (Canada), July 4-8, 2004, pp.
1-8.
[10]Zafer Duzen and Mehmet S. Aktas, “An approach to hybrid personalized recommender systems”, Proceedings of 2016 International Symposium on INnovations in Intelligent SysTems and Applications (INISTA), Sinaia
(Romania), August 2-5, 2016, pp. 1-8.
1275 model with granularity”, Pervasive and Mobile Computing, Vol. 13, 2014, pp. 85-98.
[12]Ning Zhou, Yongyue Chen, and Huiping
Zhang, “Study on Personalized
Recommendation Model of Internet Advertisement”, Integration and Innovation Orient to E-Society, Vol. 2, 2017, pp. 176-183.
[13]Ana Belén Barragáns-Martínez, Enrique Costa-Montenegro, Juan C. Burguillo, Marta Rey-López, Fernando A. Mikic-Fonte, and Ana Peleteiro, “A hybrid content-based and item-based collaborative filtering approach to recommend TV programs enhanced with singular value decomposition”, Information Sciences, Vol. 180, No. 22, 2010, pp.
4290-4311.
[14]Daofang Chang, Yu Jiang, Cancan Dou, Bixia Yu, and Ting Fang, “Online Shopping Recommendation Based on Customer Comment Analysis and Missing Value Complement”, Journal of Residuals Science & Technology, Vol. 13, No. 6, 2016, pp.
35.1-35.6.
[15]Joeran Beel, Stefan Langer, Marcel Genzmehr, Bela Gipp, Corinna Breitinger, and Andreas Nürnberger, “Research Paper Recommender System Evaluation: A Quantitative Literature Survey”, Proceedings of the International Workshop on Reproducibility and Replication in Recommender Systems Evaluation, Hong
Kong (China), October 12, 2013, pp. 15-22. [16]Du, W., Lin, H., Sun, J., Yu, B., and Yang, H.,
“Content-based Music Similarity Computation with Relevant Component Analysis”,
Proceedings of International Congress on Image and Signal Processing, BioMedical Engineering and Informatics (CISP-BMEI),
Datong (China), October 15-17, 2016, pp. 1043-1047.
[17]Weinan Zhang, Dingquan Wang, Gui-Rong Xue, and Hongyuan Zha, “Advertising Keywords Recommendation for Short-Text Web Pages Using Wikipedia”, ACM Transactions on Intelligent Systems and Technology, Vol. 3, No. 2, 2012, pp.
36:1-36:25.
[18]Yuchen Li, Dongxiang Zhang, Ziquan Lan, and Kian-Lee Tan, “Context-Aware Advertisement Recommendation for High-Speed Social News Feeding”, Proceedings of IEEE International Conference on Data Engineering (ICDE), Helsinki (Finland), May
16-20, 2016, pp. 505-516.
[19]Jan Roelf Bult and Tom Wansbeek, “Optimal Selection for Direct Mail”, Marketing Science,
Vol. 14, No. 4, 1995, pp. 378-394.
[20]Young Sung Cho, Song Chul Moon, In-Bae Oh, Jung-Hoon Shin, and Keun Ho Ryu, “Incremental Weighted Mining based on RFM Analysis for Recommending Prediction in u-Commerce”, International Journal of Smart Home, Vol. 7, No. 6, 2013, pp. 133-144.
[21]Inderpreet Singh and Sukhpal Singh, “Framework for Targeting High Value Customers and Potential Churn Customers in Telecom using Big Data Analytics”,
International Journal of Education and Management Engineering, Vol. 7, No. 1, 2017,
pp. 36-45.
[22]Yen-Liang Chen, Mi-Hao Kuo, Shin-Yi Wub, and Kwei Tang, “Discovering recency, frequency, and monetary (RFM) sequential patterns from customers’ purchasing data”,
Electronic Commerce Research and Applications, Vol. 8, No. 5, 2009, pp. 241-251.
[23]Mahboubeh Khajvand, Kiyana Zolfaghar, Sarah Ashoori, and Somayeh Alizadeh, “Estimating customer lifetime value based on RFM analysis of customer purchase behavior: case study”, Procedia Computer Science, Vol.
3, 2011, pp. 57-63.
[24]Young Sung Cho, Song Chul Moon, Si Choon Noh, and Keun Ho Ryu, “Implementation of personalized recommendation system using k-means clustering of item category based on
RFM”, Proceedings of 2012 IEEE
International Conference on Management of Innovation & Technology (ICMIT), Sanur Bali