IJPSR (2014), Vol. 5, Issue 1 (Research Article)
Received on 28 August, 2013; received in revised form, 15 October, 2013; accepted, 26 December, 2013; published 01 January, 2014
DEVELOPMENT AND VALIDATION OF REVERSE-PHASE HPLC METHOD FOR ESTIMATION OF HAMYCIN AND KETOCONAZOLE IN PHARMACEUTICAL CREAM
Sunil Kumar*1, R.K. Nanda 1, Pritam Kuttepali 2 and S.K. Sharma 2
Department of Quality Assurance Technique, Padm. Dr. D. Y. Patil Institute of Pharmaceutical Science and Research, Pimpri, Pune- 411018, Maharashtra, India
Genpharma International Pvt. Ltd., Bhosari, Pune, Maharashtra, India
ABSTRACT: A simple, accurate rapid and precise RP-HPLC method has been developed and validated for determination of Hamycin and Ketoconazole in Pharmaceutical Cream. The RP-HPLC separation was achieved on Thermosil C-18, (250 mm, 4.6 mm, 5μm) using mobile phase 0.4 % ( v/v) diisopropylamine in methanol (v/v): 0.5% (w/v) Ammonium acetate in distilled water (90:10 % v/v) pH 6.5 adjusted with Glacial acetic acid at flow rate of 1.0 ml/min at ambient temperature. The retention times were 2.433 min. for Hamycin and 4.711 min. for Ketoconazole. Calibration plots were linear over the concentration range 50-250 μg/ml for Hamycin and 200-1000 μg/ml. Quantification was achieved with UV detection at 263 nm over the Beer-Lambert’s range.The method was validated statistically and applied successfully for the determination of Hamycin and Ketoconazole. Validation studies revealed that method is specific, rapid, reliable, and reproducible. The high recovery and low relative standard deviation confirm the suitability of the method for the routine determination of Hamycin and Ketoconazole in pharmaceutical cream. The proposed method was validated as per the ICH and USP guidelines.
INTRODUCTION: Ketoconazole is Chemically Cis-1-acetyl-4-[4-[2-(2,4-dichlorophenyl)-2H-imidazolyl methyl)-1,3-dioxolan-4-yl] methoxy] phenyl]- piperazine is a topical as well as systemic antifungal agent (figure 1).
Ketoconazole is practically insoluble in water; sparingly soluble in strong acid, soluble in strong bases. It is an imidazole derivative with molecular weight 531.44 1, 2.
QUICK RESPONSE CODE
DOI:
10.13040/IJPSR.0975-8232.5(1).263-68
Article can be accessed online on:
www.ijpsr.com
DOI link: http://dx.doi.org/10.13040/IJPSR.0975-8232.5(1).263-68
[image:1.612.48.298.653.737.2]It inhibits cytochrome P450 dependent lanosterol C14 demethylase, which is responsible for production of ergosterol, a necessary component in fungal cell wall synthesis 3, 4. Ketoconazole is a weak base with pKa values of 2.94 and 6.51 5. Ketoconazole is an antifungal drug approved by the US FDA in 1981. Only a few analytical methods for the determination of the drug in biological samples and in the presence of other drugs have been reported 6-10.
FIG. 1: STRUCTURE OF KETOCONAZOLE Keywords:
Hamycin, Ketoconazole, Methanol, Ammonium acetate, HPLC
Correspondence to Author:
Mr. Sunil Kumar
Quality Assurance Department, Uttaranchal Biotech Ltd. Jainagar-3, Dineshpur Road, Rudrapur (U.S. Nagar), Uttarakhand., India
E-mail:
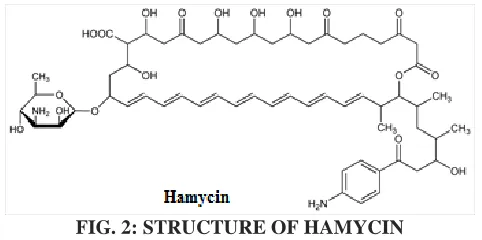
Hamycin is a polyene antimycotic organic compound. It is a heptaene antifungal compound rather similar in chemical structure to amphotericin B except that it has an additional aromatic group bonded to the molecule (figure 2). Hamycin is obtained from a strain of Streptomyces bacteria growing in soil i.e., Streptomyces pimprina. This compound is being produced in India by Hindustan Antibiotics Limited, located at Pimpri, Pune, Maharashtra, India. It is useful as an antifungal antibiotic drug for topical as well as systemic mycoses.
It is Yellow amorphous powder, no definite M.P., decompose after 1600 C. UV max (80% methanol): 383 nm (E1%1cm916). An amphoteric compd. Almost insoluble in water, benzene, chloroform, dry lower aliphatic alcohols, ether. Solution in basic solvents such as pyridine, and in aqueous lower alcohols. In conc. H2SO4 gives stable blue
color, no coloration with ferric chloride or with HCl. Hamycin is a rigid, rod-shaped molecule that kills cells by disrupting the cell membrane, causing leakage of electrolytes and small molecules. Hamycin bind to ergosterol, the major membrane
[image:2.612.53.294.409.529.2]lipid in fungal cells.7, 8
FIG. 2: STRUCTURE OF HAMYCIN
MATERIALS AND METHODS: All the reagents
used were of HPLC grade and analytical grade from Rankem, India. Reference standard of Ketoconazole was supplied as gift sample from Genpharma International Pvt. Ltd., Pune and Hamycin was supplied as gift sample from Hindustan Antibiotic Limited, Pune.
Apparatus and Chromatographic Conditions:
Equipment: High performance liquid
chromatography (Shimadzu LC 2010) equipped with Auto Sampler and UV detector. HPLC Column: Thermo Scientific C18 column (5 µm, 250
X 4.6 mm ID), Column temperature: Ambient temperature, Mobile Phase: 4 % (v/v)
diisopropyl-amine in methanol (v/v): 0.5%, (w/v) Ammonium acetate in distilled water (90:10 % v/v), pH 6.5 adjusted with Glacial acetic acid. UV detection: 263 nm Injection volume: 20 μL, Run time: 7 mins.
Preparation of Mobile phase: The mobile phase is prepared by mixing 0.4 %( v/v) diisopropylamine in methanol (v/v): 0.5% (w/v) Ammonium acetate in distilled water (90:10 % v/v) pH 6.5 adjusted with Glacial acetic acid. Filtered and degas it.
Diluent Preparation: The Mobile phase was used as diluent.
Preparation of standard solution: 10 mg of Hamycin and 40 mg Ketoconazole weighed and transferred to 100 ml volumetric flasks respectively. It was dissolved in the mobile phase consisting of 0.4% (v/v) diisopropylamine in methanol (v/v): 0.5% (w/v) Ammonium acetate in distilled water (90:10 % v/v) and the solutions were made up to mark with same mobile phase to obtain stock solutions of concentration 100 µg mL-1 of Hamycin and 400 µg mL-1 Ketoconazole each.
Preparation of sample solution: The sample solution was prepared by weighing accurately and transferred 2 gm of cream formulation which contain 10 mg of Hamycin and 40 mg of Ketoconazole into a 100mL clean dry volumetric flask. About 70mL of diluent was added to this and sonicated to dissolve it completely. Finally the volume was made to the mark with the same solvent.
Injection of Standards and Samples into the Chromatographic system: 20 µL of each standard and sample solution was injected into the chromatographic system and measured the areas of Hamycin and Ketoconazole peaks. %Assay of both the drug was calculated using the appropriate formulae.
System Suitability Results: To ascertain
resolution and reproducibility of proposed chromatographic system for estimation of Hamycin and Ketoconazole in formulation system suitability parameters were studied.
TABLE 1: ASSAY OF CREAM FORMULATION
Sr. No. Label claim (mg/2 gm) Amount Found (mg/2 gm) % Amount Found
Hamycin Ketoconazole Hamycin Ketoconazole Hamycin Ketoconazole
1. 10 40 9.93 38.62 99.33 96.54
2. 10 40 9.85 39.62 98.49 99.05
3. 10 40 9.75 39.29 97.47 98.22
4. 10 40 10.02 40.07 100.16 100.18
5. 10 40 9.91 39.34 99.10 98.36
6. 10 40 9.86 39.61 98.58 99.03
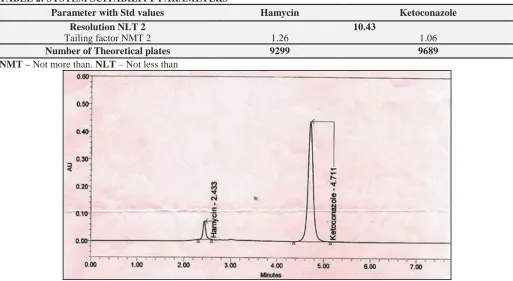
TABLE 2: SYSTEM SUITABILITY PARAMETERS
Parameter with Std values Hamycin Ketoconazole
Resolution NLT 2 10.43
Tailing factorNMT 2 1.26 1.06
Number of Theoretical plates 9299 9689
NMT – Not more than. NLT – Not less than
FIG 3: CHROMATOGRAM OF STANDARD MIXTURE OF HAMYCIN AND KETOCONAZOLE IN RATIO OF (1:4)
RESULTS:
RP-HPLC Validation:
Linearity: The calibration curves were found to be linear and in adherence to Beer’s law over the
concentration range of 50-250 µg mL-1 for Hamycin and 200-1000 µg mL-1 for Ketoconazole. The linearity was validated by the high values of the correlation coefficient. The results of the linearity studies are given in Table 3.
TABLE 3: LINEAR REGRESSION DATA FOR CALIBRATION CURVES OF HAMYCIN AND KETOCONAZOLE FOR RP–HPLC METHOD
Drugs Linearity range* (μg ml-1) Slope* ± S.D y-intercept* ±S.D Regression coefficient* (r2)
Hamycin 50-250 2984 ±15 2291±943.11 0.999
Ketoconazole 200-1000 8842±21.50 52696±14053 0.999
*Average of six determinations
Precision:
a) Repeatability: The repeatability of sample application and measurement of peak area
were expressed in terms of % R.S.D and was found to be less than 2 %. The results of the same are given in Table No.4.
TABLE 4: STATISTICAL VALIDATION OF REPEATABILITY FOR RP – HPLC METHOD
Drugs Mean Content (%)* S.D.* % R.S.D.*
Hamycin 99.06 0.6319 0.637
Ketoconazole 96.46 1.6332 1.69
[image:3.612.48.571.575.612.2]b) Intermediate precision: The intermediate precision of sample application and measurement of peak areas were expressed in terms of % Relative Standard Deviation (% R.S.D.) and were found to be less than
[image:4.612.51.555.130.182.2]2% for Hamycin and Ketoconazole indicating that the proposed method provides acceptable intra-day and inter-day precision. The results of the same are given in Table 5.
TABLE 5: INTRA-DAY AND INTER-DAY PRECISION OF RP – HPLC METHOD
Drugs Intra-day Precision* Inter-day Precision*
Mean % content S.D. % R.S.D. Mean % content S.D. % R.S.D.
Hamycin 98.95 0.9593 0.9695 98.52 0.6911 0.7012
Ketoconazole 99.19 0.6559 0.6613 98.56 0.3969 0.4028
*Average of three determinations
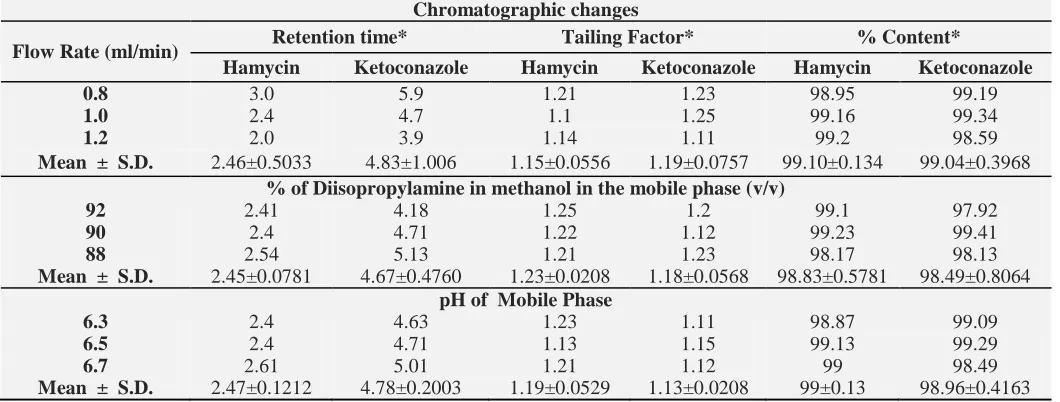
Robustness of the method: To evaluate the robustness of the method, the optimized method parameters were varied at different levels. The results presented in Table 6 indicated that the
selected factors (retention time tR, peak area, and %
[image:4.612.43.573.272.473.2]content) were unaffected by small variations in the selected method parameters.
TABLE 6: ROBUSTNESS TESTING FOR RP – HPLC METHOD
Chromatographic changes
Flow Rate (ml/min) Retention time* Tailing Factor* % Content*
Hamycin Ketoconazole Hamycin Ketoconazole Hamycin Ketoconazole
0.8 3.0 5.9 1.21 1.23 98.95 99.19
1.0 2.4 4.7 1.1 1.25 99.16 99.34
1.2 2.0 3.9 1.14 1.11 99.2 98.59
Mean ± S.D. 2.46±0.5033 4.83±1.006 1.15±0.0556 1.19±0.0757 99.10±0.134 99.04±0.3968
% of Diisopropylamine in methanol in the mobile phase (v/v)
92 2.41 4.18 1.25 1.2 99.1 97.92
90 2.4 4.71 1.22 1.12 99.23 99.41
88 2.54 5.13 1.21 1.23 98.17 98.13
Mean ± S.D. 2.45±0.0781 4.67±0.4760 1.23±0.0208 1.18±0.0568 98.83±0.5781 98.49±0.8064
pH of Mobile Phase
6.3 2.4 4.63 1.23 1.11 98.87 99.09
6.5 2.4 4.71 1.13 1.15 99.13 99.29
6.7 2.61 5.01 1.21 1.12 99 98.49
Mean ± S.D. 2.47±0.1212 4.78±0.2003 1.19±0.0529 1.13±0.0208 99±0.13 98.96±0.4163
*Average of three determinations
Accuracy: The accuracy study was performed at three different levels (80%, 100% and 120% of the test concentration). The mean % recoveries were found to be between 98–102% as required by ICH
[image:4.612.46.574.561.726.2]guidelines. The results of the recovery studies and its statistical validation data are given in Table 7 and Table 8 respectively.
TABLE 7: RECOVERY STUDIES FOR RP – HPLC METHOD
Level of % Recovery
Amount of drug present (mg/20gm)
Amount of standard added (mg)
Total amount recovered
(mg) % Recovery
HAM KETO HAM KETO HAM KETO HAM KETO
80
100 400 80 320 177.90 716.16 98.83 99.46
100 400 80 320 178.19 714.71 98.99 99.26
100 400 80 320 178.90 715.40 99.38 99.36
100
100 400 100 400 198.51 790.18 99.25 98.77
100 400 100 400 198.28 791.91 99.14 98.99
100 400 100 400 198.83 791.66 99.42 98.96
120
100 400 120 480 216.51 874.18 98.41 99.34
100 100
400 120
120
480 216.09
215.80
873.34 98.22
98.10
99.24
TABLE 8: STATISTICAL VALIDATION OF RECOVERY DATA FOR RP – HPLC METHOD
Level of % Recovery % Mean Recovery* S. D. * % R.S.D.*
HAM KETO HAM KETO HAM KETO
80 99.06 99.36 0.2829 0.1 0.2855 0.101
100 99.27 98.91 0.1411 0.1193 0.1421 0.1206
120 98.24 99.36 0.1563 0.1365 0.1591 0.1373
*Average of three determinations
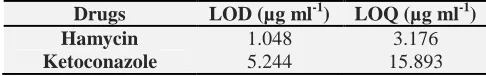
Limit of Detection and Limit of Quantitation: The limit of detection and limit of quantitation was calculated on the basis of standard deviation of the response and slope (table 9).
TABLE 9: LOD AND LOQ VALUES FOR RP – HPLC METHOD
Drugs LOD (µg ml-1) LOQ (µg ml-1)
Hamycin 1.048 3.176
Ketoconazole 5.244 15.893
DISCUSSION: A simple, specific, accurate,
reproducible, precise and robust reverse phase high performance liquid chromatography method with UV detection at 263 nm has been developed for the simultaneous determination of Hamycin and Ketoconazole in formulation. Shimadzu LC2010 HPLC system was used for the analysis. Mobile phase consisted of a mixture of 0.4 %( v/v) diisopropylamine in methanol (v/v): 0.5% (w/v) Ammonium acetate in distilled water (90:10 % v/v) pH 6.5 with Glacial acetic was used.
The retention time for Hamycin and Ketoconazole were 2.4 and 4.7 min respectively. The system suitability parameters were calculated and are found within limits. Linear relationships were obtained between response and amount of drug with high correlation coefficients (r2) in the range 50-250 µg mL-1 for Hamycin (r2= 0.999) and 200-1000 µg mL-1 for Ketoconazole (r2= 0.999). The LOD and LOQ were 1.048 and 3.176 µg mL-1 for Hamycin, 5.244 and 15.893 µg mL-1 for Ketoconazole respectively.
The results of formulation analysis and recovery studies were statistically validated as per ICH guidelines indicating high degree of accuracy. The low % R.S.D. value of intraday and interday precision studies revealed high degree of precision of the proposed method. The low % R.S.D. value for robustness study suggests that the developed RP-HPLC method is unaffected by small changes in process parameters.
ACKNOWLEDGEMENTS: I express my special
thanks to Dr. P. D. Patil, Vice-Chancellor, Dr. D. Y. Patil University, Pimpri, Pune and Chairman Dr. D. Y. Patil Vidya Pratishthan Society, Pimpri, Pune for providing excellent infrastructural facility for undertaking this research work.
My sincere thanks to Dr. Sohan S. Chitlange, Principal, Padm. Dr. D. Y. Patil Institute of Pharmaceutical Sciences and Research, Pimpri, Pune for his constant support and guidance.
I owe a deep sense of gratitude and indebtedness to Mr. Sambhaji Patil, Plant Head, Genpharma International Pvt. Ltd, Pune for providing me with all the excellent facilities for completion of my research work.
Words are less to express my deep heartfelt gratitude to my guide Dr. R.K. Nanda, for his constant guidance, encouragement with which he has equipped me to complete this project. I extend my deepest sense of gratitude for his inspiration and time he has spared despite his very busy schedule, will always be a part of immortal reminiscences and remain idol throughout my life.
REFERENCES:
1. The Merck Index, 14th Edn., Merck Research Laboratories, Division of Merck & Co, Inc. Whitehouse Station NJ USA, 5.
2. Martindale: “The Complete Drug Reference”, 36th Edn. The Pharmaceutical Press, London, 2009; 1, 14.
3. Pappa, KA, J. Am. Acad. Dermatol.,1990; 22(5), 873. 4. Hitchcock, CA; Dickinson, K; Brown, SB; Evans, EG and
Adams, DJ , Biochem. J., 1990; 266(2), 475.
5. Esclusa, Diaz et al (1996), Int. J. Pharm., 1996; Vol. 143, no. 2, 203.
6. Vander, Heyde; Y, Nguyet; AN, Detaevenier , “Simultaneous determination of ketoconazole and formaldehyde in a shampoo: liquid chromatography method development and validation”, J Chromatogr A., 2002; 958, 191-201.
7. http://www.drugs.com/cons/hamycin.html 8. http://www.drugs.com/cdi/hamycin.html
9. Christen GD. Analytical Chemistry. 5th ed. John Wiley and Sons; 2003; 35-42, 131-132.
10. Mendham J, Denney RC, Barnes JD, Thomas M. Vogel’s Textbook of Quantitative Analysis, Singapore: Pearson Education; 2003; 8-9.
[image:5.612.50.293.232.270.2]12. Skoog DA, Holler FJ, Crouch SR. Principle Of Instrumental Analysis. 6th ed. India: Thomson Publications; 2007; 1-3, 145-147, 180.
13. Chatwal GR, Sharma A. Instrumental Methods of Chemical Analysis. 5th ed.Delhi: Himalaya Publishing House; 2004; 1.1-1.5.
14. Willard HH, Merritt. Jr. LL, Dean JA, Settle Jr. FA. Instrumental Methods of Analysis. 7th ed. Delhi: CBS Publishers and Distributors; 2001; 1.
15. ICH, Q2 (R1); Validation of analytical procedures: text and methodology. International Conference on Harmonization, Geneva; 2005; 1- 13.
16. ICH, Q2A; Text on Validation of Analytical Procedures. International Conference on Harmonization, Geneva; October 1994; 1-5.
17. ICH, Q2B; Validation of Analytical Procedures: Methodology. International Conference on Harmonization, Geneva; November 1996; 1-8.
18. ICH, Q1A; Stability Testing of new drug substances and products, Proceedings of the International Conference on Harmonization, Geneva; October 1993.
19. ICH Q1A (R2); Stability guidelines on stability testing of new drug substances and products International conference on harmonization, IFPMA, Geneva; 2003.
20. FDA, “International Conference on Harmonization: Draft Revised Guidance on Q1A(R) Stability Testing of New Drug Substances and Products,” (21 April 2000) Federal Register 65 (78), 21446–21453[ICH Q1A(R)].
21. Singh S, Bakshi M. Guidance on conduct of: Stress tests to determine Inherent Stability of Drugs; April 2000.
22. Indian Pharmacopoeia; Vol.III; Govt. of India, Ministry of Health and Family Welfare. New Delhi; Published by The Controller of Publications; 2007; 649-650.
23. The United States Pharmacopoeia NF ; US pharmacopoeial convention Inc., Rockville; 2007; 2438.
24. British Pharmacopoeia; Vol. II; Published by The Stationery Office on behalf of Medicines & Healthcare Products Regulatory Agency (MHRA); 2010; 23-7.
25. Kumar A. Anil et al., Rapid and Sensitive HPLC method for the determination of Sirolimus with Ketoconazole as Internal standard and Its further Applications, International Journal of Pharmaceutical Sciences and Drug Research 2012,4(1): 70-73. 26. Venishetty Vinay Kumar et al., Application of Validation
RP-HPLC method for simultaneous determination of docetaxel and Ketoconazole in Solid Lipid Nanoparticles, Journal of Chromatographic Science, Vol. 49, 136-141.
27. Hackman E.R.M.K. et al., First-derivative ultraviolet spectrophotometric and High Performance Liquid Chromatographic determination of Ketoconazole in Pharmaceutical emulsions, Brazilian Journal of Pharmaceutical sciences, Vol. 42, n.1 jan/march, 2006, 91-98. 28. Jat R.K. et al, Development and validation of reverse-phase HPLC method for estimation of Ketoconazole in bulk drug, Pharmacophore 2012, Vol.3(2), 123-129.
29. Staub Inara et al., Microbiological assay of Ketoconazole in shampoo, International journal of pharmaceutics, 292(2005), 195-199.
30. Staub Inara et al., Determination of Ketoconazole in Shampoo by High Performance Liquid Chromatography, Acta farm, Bonaerense 23(3): 387-90.
31. Dhuley J.N., Antifungal antibiotic hamycin increases susceptibility of Candida albicans to phagocytosis by murine
macrophages, FEMS Immuno Med. Microbiol. 2009 jan., 55(1): 112
32. Lushbaugh W.B. etal, Cytotoxicity of Hamycin for
Trichomonas vaginalis HeLa and BHK-21, Journal of Antimicrob chemotherapy 1995 Nov: 36(5): 795-802. 33. Labot J.M., HPLC method for the determination of nystatin in
saliva for application in clinical studies, J. Pharm Biomed Anal. 2011, 641-644.
34. Cione A.P.P., Development and validation of an HPLC method for stability evaluation of Nystatin, BJPS, Vol.46,n.2, 2010, 305-310.
35. Gallego L.J.M., Spectrophotometric determination of hydrocortisone, nystatin and oxytetracycline in synthetic and pharmaceutical preparation based on various univariate and multivariate methods, Analytica chimica Acta 460(2002), 85-97.
36. Connors KA; “A textbook of Pharmaceutical Analysis”; 3 rd ed.; John Wiley and sons; 1999; 196-198.
37. Beckett AH, Stenlake JB, “Practical Pharmaceutical Chemistry”, Part-2; CBS Publishers and Distributors, New Delhi; 2002; 275-288.
38. Bauman RY, “Absorption Spectroscopy”; John Wiley and Sons Inc. New York; 1975; 405-569.
39. Kalsi PS, “Spectroscopy of Organic Compounds”; 6th ed.; New Delhi: New Age International Publishers; 2007; 7-10. 40. Sethi PD. “High Performance Liquid Chromatography,
Quantitative Analysis of Pharmaceutical Formulations”. 1st ed.; CBS Publishers and Distributors, New Delhi; 2001; 3-11, 116-120.
41. Munson JW. Pharmaceutical Analysis, Modern methods. Part B. International Medical book Distributors. Mumbai: 2001; 51-54.
42. Dong MW. Modern HPLC for practicing scientists. New Jersey: a John Wiley & Sons, inc. Publication Hoboken; 2006; 1-9.
43. Weston A, Brown PR. High Performance Liquid Chromatography, Separations in High Performance Liquid Chromatography, Instrumentation for HPLC. In: HPLC and CE – Principles and practice. USA: Academic Press; 1997. p. 1-4, 8-11, 24-26, 29-32, 71.
44. www.who.int/phint/en/d/jb.6.1.97
45. Remington, The Science and Practice of Pharmacy, Lippincott Williams and Wilkins, 21st Edition, Vol II
46. Niazi S.K., Hand book of Pharmaceutical Manufacturing formulation, Semisolid products, Vol.4, CRC Press LLC,89-90.
47. Maryadele J, O’Neil, Ann Smith, editors. The Merck Index. White House Station. 14th ed. NJ: Merck and Co, Inc.: 2006; 48. Bageshwar D. V. et al., Quantitative estimation of Mupirocin
calcium from pharmaceutical ointment formulation by UV Spectrophotometry, IJPPS, Vol.2, Issue 3,2010, 86-88. 49. Kumar B.K. et al., Analytical Method development and
validation of lidocaine in ointment formulation by U.V. spectrophotometric method, IJPPS, Vol.4, Issue 2,2012, 610-614.
50. Kasture AV, Mahadik KR, Wadodkar SG, More HN. Pharmaceutical Analysis- Instrumental Methods. Vol – I: 6-7, 28-30, 49, 64, 67.
51. Stahl E. Thin Layer Chromatography, A Laboratory Handbook. 2nd ed. Springer, India: 2006; 52-66.
All © 2013 are reserved by International Journal of Pharmaceutical Sciences and Research. This Journal licensed under a Creative Commons Attribution-NonCommercial-ShareAlike 3.0 Unported License.
This article can be downloaded to ANDROID OS based mobile. Scan QR Code using Code/Bar Scanner from your mobile. (Scanners are available on Google Playstore)
How to cite this article: