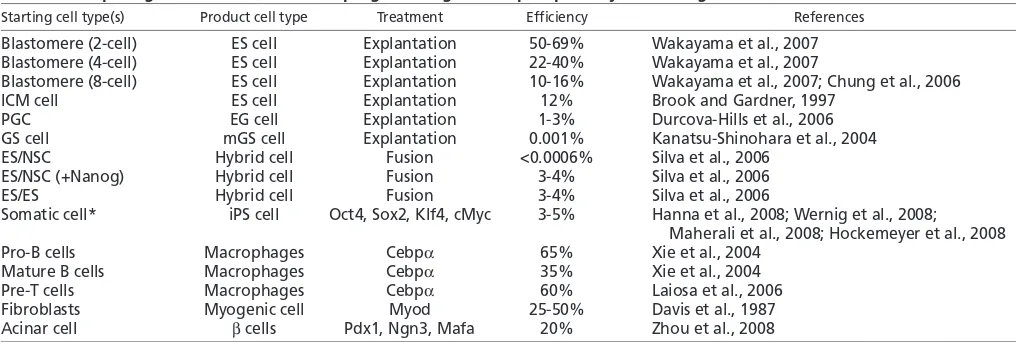
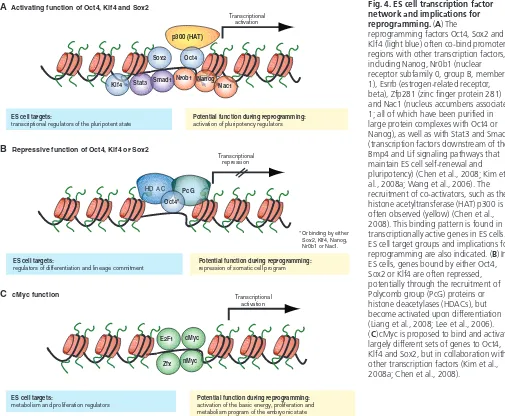
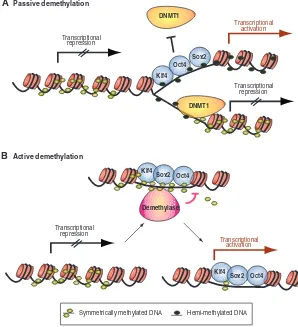
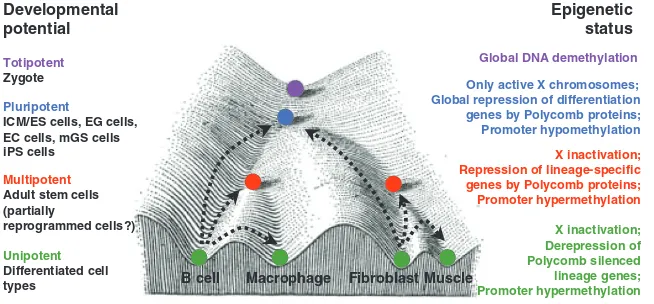
Epigenetic reprogramming and induced pluripotency
Full text
Figure

Related documents
2) Preprocessing by changing RGB original image into gray image. 3) Possibility distribution image quality improvement with distribution possibility algorithm. 4) Segmentation
Hermann von Helmholtz Professor of Health Sciences and Technology at the MIT Institute of Medical Engineering and Science Professor of Immunobiology at Harvard Medical
The remuneration and salaries payable to the holders of the said judicial offices (such as Chief Justice of Nigeria and Justices of the Supreme Court, President and
During these phases, the India government set up some organizations to help foster and nurture the SMEs, such as The Micro, Small and Medium Enterprises Development
The central blood-pressure of each examinee is calculated in the main station using the above mentioned simulator and his/her own PTF from the observed pulse
Relationship be- tween the von Bertalanffy K and L oo parameters for a variety of fish stocks in Hellenic waters (open circles) and for 4830 stocks registered in Fish- Base 98
The suggested algorithm's fundamental concept is straightforward and it is based on the following assumption: if the input vector is similar enough (closer in the N-D
The results of variance analysis of traits (Table 1) showed that the varieties studied (Factor A) and salinity factors (C) and pH (D) of all traits had
