IJPSR (2016), Vol. 7, Issue 7 (Research Article)
Received on 09 February, 2016; received in revised form, 16 March, 2016; accepted, 15 May, 2016; published 01 July, 2016
TIME-DEPENDENT EFFECTS OF TEMPERATURE AND HUMIDITY ON QUANTITY OF DNA IN SAMPLES OF HUMAN SALIVA, BLOOD AND SEMEN IN KUWAIT
Al-Kandari NM 1, J. Singh 1 and V. C. Sangar *2
School of Forensic and Investigative Sciences 1, University of Central Lancashire, Preston, UK.
Bai Jerbai Wadia for Children and Institute of Child Health Research Society 2, Parel, Maharashtra, India
ABSTRACT: Forensic science is growing rapidly in the world today. During the past ten years, medico-legal investigations highly expanded to include all areas of forensic science. The present aim of project investigated 29 samples of blood and 29 samples of saliva swabs that were collected from human volunteers. The saliva samples were collected by buccal swab but the blood samples were collected by Bode Secur Swab S.I.T. Collector. The experiments were done at four different temperatures (55°C, 37°C, 24°C and 4°C) for 28 days. The results showed that, DNA quantity that was investigated at a temperature of 4°C and 24°C in both blood and saliva samples was more or less remained the same during the whole period of the study, comparing values for day one with all other days including day 28. DNA quantification of human blood following extraction at 37°C was 46.14 ng/μl ± 0.22 at day one then starts to decrease until it reached 36.05 ng/μl ± 0.07 at day 28. In contrast, the result obtained from real-time PCR showed that, when the temperature was raised to 55°C, the DNA started to degrade with time until it reaches zero at day 12. The results clearly show that DNA is extremely sensitive to heat. In conclusion, the present project has shown that accidental deaths are the major cause for un-natural deaths in Kuwait. Moreover, the study concluded that an environmental temperature of 55°C, revealed no DNA survival after 12 days of exposure.
INTRODUCTION: From the past two decade numerous advances have been made in the field of forensic science and the use of deoxyribonucleic acid (DNA) as an evidence to either exonerate or convict people and to solve crimes increased worldwide. 1 The availability of new and improved technology makes DNA analysis critical in the field of forensic science. 2, 3 The DNA of a person is unlike that of any other human, except in the case of identical twins. 4
QUICK RESPONSE CODE
DOI:
10.13040/IJPSR.0975-8232.7(7).2852-73
Article can be accessed online on:
www.ijpsr.com
DOI link: http://dx.doi.org/10.13040/IJPSR.0975-8232.7 (7).2852-73
Therefore, analysis of DNA evidence is extremely valuable and it is the best way to determine the identity of the person who left behind evidence at the crime scene in any form including body fluids such as blood, saliva, semen, sweat and such tissues as body teeth, skin, hair roots and bones. 5, 6 It has also been proven to be valuable for the identification of human remains. This impact is felt within the criminal justice system and contributes to the accurate safeguarding of society. 2
DNA profiling in investigation of crimes:
DNA analysis is useful for a number of different purposes in solving a wide variety of criminal investigative cases. This may involve cases such as homicide, sexual assault, physical assault, hit and run incidents, missing person investigations,
Keywords: Forensic science,
DNA profiling, DNA polymorphism, Short tandem repeats, Kuwait Correspondence to Author: Vikrant C. Sangar
Senior Research Officer,
Research Society, Bai Jerbai Wadia for Children and Institute of Child Health Research Society, Parel, Maharashtra India.
identification of human remains, determination of paternity and several others. 5 Specifically, DNA can aid the investigations in the following circumstances like identifying the source of biological evidence found at a crime scene, redirecting the investigation in a new direction, linking serial crimes together, identifying the number of assailants, identifying additional victims, exonerating people who have been wrongfully convicted of a crime they did not commit and several others.6
DNA polymorphisms:
For the purposes of forensic science, DNA polymorphisms are specific sites in the genome where the precise sequence of DNA tends to differ in unrelated individuals. In forensic geneticists, there are regions within the genome that are hyper-variable and these have been the target for most forensic analysis. 7 Commonly used regions include sequences that are repeated tandemly. The original DNA „fingerprinting‟ analysed mini-satellites are often referred to as variable number tandem repeats (VNTRs). 8 Short tandem repeat (STR) also known as “microsatellites”. This technology is currently used for DNA profiling where variability in alleles can be used to distinguish one DNA profile from another. 9 The odds of having two individuals the same specific STR regions profile is about one in a billion or even higher.10
Short tandem repeats (STRs):
The human genome is full of repeated DNA sequences.3 These repeated sequences come in various sizes and are classified according to the length of the core repeat units, the number of contiguous repeat units, and/or the overall length of the repeat region.2 DNA regions with short repeat units (usually 2-6 bp in length) are called “short tandem repeats” (STR). STRs can be classified according on their structures as simple, compound, complex and complex highly variable.11 (See Fig. 4). STRs have proven to have several benefits that make them especially suitable for human identification. 1
In 2001, Peter Gill, working in Forensic Science Service (FSS®) in the UK, developed and introduced the first multiplex which is widely used in forensic analysis.12 Further efforts have been
made by the FSS® resulted in the development of the second Generation multiplex (SGM). This in turn incorporated six polymorphic STRs (TH01, VWA, FGA, D8S1179, D18S51 and D21S11) and the amelogenin marker.13 (See Table 4). Currently, the SGM Plus kit with 10 STRs is used in the UK, while the Federal Bureau of Investigation (FBI) uses a standard set of 13 specific STR regions for CODIS. The use of STR technique in forensic science is highly powerful due to several properties. In this study, the Amp FlSTR® Identifiler® Identifiler kit (Applied Biosystems) was used to generate DNA profiles from samples.
DNA evidence recovered from crime scenes:
DNA evidence has become a standard forensic technique for investigating a wide spectrum of crime types ranging from burglary to murder.14 DNA evidence found in the crime scenes often treated as crucial evidence by Forensic scientists to solve cases. If the evidence is successfully detected and analyzed, then the identity of the individual can be determined. Substantial DNA evidence can be recovered from crime scenes. The largest source recovered from crime scenes is mainly saliva via drinking vessels and cigarette ends.15 Whilst treated as a different source, blood is the next largest source recovered. Both of these sources are typical of DNA recovery at the crime scene that is used by an offender.14 Other DNA evidence encountered in crime scenes including epithelial cells semen (sperm), urine, faeces, bone, hair shaft and other tissues. In forensic analysis, the quality of DNA evidence recovered from a crime scene is affected by several environmental factors that can lead to a highly degraded DNA resulting in a poor PCR amplification.16
Factors affecting DNA degradation:
investigate mainly the effect of various temperatures and humidity on DNA survival over time.
Effect of temperature on DNA degradation:
DNA can be rapidly degraded post-mortem, initially from the enzymes released as the cell dies losing its structural integrity and then later from environmental conditions. 18, 19 Temperature plays an important role in both DNA degradation and survival. DNA degradation depends both on its amount and type of damage that accumulates over time. This depends greatly on the conditions and integrity of the biological material when it is found. However, as temperature increases, damages can take place rapidly and this damage can accumulate with time.9
Effect of humidity on DNA survival:
Weather forecast normally refers to humidity as relative humidity (RH). Relative humidity is defined as the amount of water molecules present in the atmosphere and the amount of water that the air can sustain at a certain temperature. 6 The exposing biological materials to an external environment of high quantity of water in the air and with elevated temperature can lead to the growth of microorganisms, such as bacteria and fungi. 20 The degradation of DNA often parallels the degradation of proteins and many of the processes that degrade DNA depend on the presence of water. 21, 22 High relative average humidity climates with 100% humidity, will enhance the appearance of fungal/microbial growth causing rapid decay of DNA at high relative humidity. 23, 24
Climate in Kuwait:
This present study conducted in Kuwait which is located at the Northwest corner of the Arabian Gulf and lies 30.05 degrees North of the Equator. Kuwait shares borders with the Kingdom of Saudi Arabia from the South and to the North and West, it shares borders with Iraq. Kuwait is Located in the desert geographical region famous for its very hot climate. In Kuwait, summer starts from the month of April and continues until September. The summer months are extremely hot and while the average normal day temperature is 37°C (99°F) and this can rise up to an average of 55°C (131°F) during the months of June, July and August.
Another feature of Kuwait climate is that it rarely rains during the summer months and from June to September which are the driest months. Frequent dusty storms often occur during the summer months. Likewise, in winter the temperature in Kuwait can drop to an average of 4°C. The average highest humidity in Kuwait occurs in the month of December reaching 64% and the average lowest humidity is in July accounting for 41%.
The main aim of this study was to determine the time course of DNA survival from such different DNA sources as blood, saliva and semen, which are usually found in crime scenes. A duration of 28 days was selected to give adequate time for DNA survival. These assimilated experiments were designed to show the length of DNA survival in four different temperatures (4, 24, 37 and 55°C). In addition, at the same time, the study investigated how changes in the humidity (61, 58, 55 and 41%) could affect DNA degradation in tandem with the same corresponding temperatures, respectively (4, 24, 37 and 55°C).
These numbers represented the most apparent temperature and humidity changes in Kuwaiti weather in both summer and winter. Since the study was conducted in Kuwait which is characterized by a very hot weather in the summer and cold in the winter, it is crucial to verify the validity of DNA profiling for characterizing the
genetic makeup of post-mortem biological
evidence in such common temperatures and percentage of humidity in the area. In addition, the results from this pioneering study may help forensic scientist in reducing cost for DNA measurements and analysis at the KIDL in the General Department of Criminal Evidence in Kuwait.
MATERIALS AND METHODS:
Contamination controls and Laboratory:
Much of the work undertaken as part of this research involved the PCR amplification of DNA, often from a low copy number template. Precautions were taken throughout the study to
minimise the probability of introducing
triplicates, with the extractions taking place at different times. The profiles were checked against a staff DNA database to detect any contamination introduced from laboratory staff. The study had the relevant ethical clearance from the Ethics Committee in GDCE and University of Lancashire.
Laboratory Design:
DNA samples were extracted in the laboratories of the DNA Identification Laboratory in the State of Kuwait. The laboratories were organized to ensure the unidirectional flow of work also to be sure that no contamination may occur. In this study one sample of either liquid blood, semen or saliva were collected from one human volunteer and split into 28 fractions. The liquid saliva, semen and blood were collected in 1.5 ml tube. The experiments were done at four different temperatures (55°C, 37°C, 24°C and 4°C) and four different humidity ranges (41%, 55%, 58% and 61%), respectively, which are similar to most Kuwaiti weather conditions in summer, spring and winter times. All samples were exposed to the various temperatures and humidity ranges over a duration of 28 days of exposure. Each extraction was quantified in triplicate for each sample in order to calculate the mean and the standard deviation bar.
Sample preparation:
All the samples were prepared as follow. A volume of 50 µl of blood was added on Secur Swab S.I.T. Collector (bode tech) in a total of 28 samples. A volume of 50 µl of saliva was added on buccal swab in total of 28 samples. A volume of 1 µl pure semen was diluted with 990µl distilled H2O and then the dilution was divided into two 500 ml tubes and to each 200µl of 20 mg/ml PK was added. The liquid was incubated for 2 hr at 56°C. This was done to bread down the epithelial cells. Following cell lysis, the sample was centrifuged at 5,000g for 3 min. The supernatant was transfer to another tube and the pellet (sperms) was diluted with 400µl distilled H2O. A volume of 5 µl of sperms liquid was added to the swabs to give about 50-55ng DNA in each swab. All the swabs were used for extraction immediately after the application of the materials. Another 28 swabs were used as negative controls at each temperature and humidity range. On each day, starting from day 1 (control), one of the negative swab was extracted side by side to the
positive one. The samples were labelled as follow started from day 1 to day 28.
Dilution of semen was performed as follow: Each sperm contained 3 ng DNA. The sperm count of the volunteer was about 21 million spermatozoa per ml, with an average of 21,000 spermatozoa/µl. Based on previous fact it was possible to make dilution and calculate the DNA roughly. A volume of 1µl pure semen was diluted with 990µl dH2O and then the dilution was divided into two 500ml tubes and to each a volume of 200µl 20 mg/ml PK was added. The liquid was incubated for 2hr at 56°C in order to lyse the epithelial cells. The sample was centrifuged at 5,000g for 3 min. The supernatant was transferred to another tube and the pellet (sperms) was diluted with 400µl dH2O. A volume 5µl of sperms liquid was added to the swabs (appx 50-55 ng DNA in each swab).
Temperature and humidity measurements:
The swabs were placed in swabs holders and incubated in temperature and humidity incubator as illustrated in Table 1. The effects of temperature and humidity were monitored on a day by day basis.
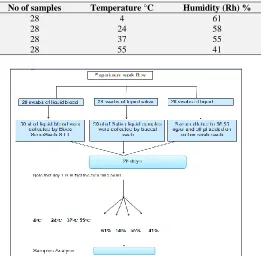
TABLE 1: DIFFERENT RANGES OF TEMPERATURE AND HUMIDITY FOR THE PRESENT WORK STUDY DURING FOUR DIFFERENT MONTHS OF THE YEAR.
No of samples Temperature °C Humidity (Rh) %
28 4 61
28 24 58
28 37 55
28 55 41
FIG. 1: EXPERIMENTAL DESIGN WORK FLOW FOR
EVALUATING DIFFERENT DNA PERSISTENCE IN
[image:4.612.313.574.453.709.2]DNA extraction: 1 Blood and saliva:
The DN easy® Blood and Tissue Kit from Qiagen were used in this study to measure DNA in each sample. The cotton part of the swab was cut by using sterile blade and inserted in sterile 1.5 ml tubes. The blood and saliva stain extractions were done side by side. To the cotton, volumes of 0.5ml ATL buffer, 100μl PK (20 mg/ml) and 10μl of 1 M DTT (Sigma Aldrich) were added. The mixture was placed in a rotary incubator at 55°C, for 24 hr. The supernatant was then removed to another 1.5 ml tube to which 0.5ml of AL buffer was added. This was mixed gently and incubated at 70°C for 30 min. A volume of 0.5ml of absolute ethanol was then added and the solution was mixed gently and then transferred to a DN easy® mini spin column and centrifuged at 8000g, for 1min. The flow through was discarded and the step was repeated until all the extraction mixture had passed though the spin column. The spin column was placed in a new collection tube and 500μl AW1 buffer was added. After centrifugation for 1 min at 8000 g, the wash step was repeated with 500μl AW2 buffer. The spin column was then centrifuged for 1 min at 13000g to remove any residual ethanol from the membrane. DNA was eluted by adding 30μl AE buffer to the membrane and after incubation for 5 min at room temperature, the spin column was centrifuged at 8000g for 1min. The elute was subsequently collected in a clean 1.5 ml tube.
2 Semen:
The QIA amp DNA Investigator Kit from Qiagen
were used in this study following the
manufacturer‟s protocol. The cotton part of the swab was cut by using sterile blade and inserted in sterile 1.5 ml tubes. To the cotton, 20μl proteinase K and 500μl Buffer ATL were added to the sample. The tube was mixed by pulse-vortexing for 10 sec, then placed in a thermo-mixer incubator at 56°C with shaking at 900 rpm for at least 1 hr. Briefly, the tube was centrifuged to remove drops from the inside of the lid then the solid material was removed to another 1.5 ml tube. The tube was centrifuged for 5 min at 20,000 g at full speed and then the supernatant was transferred to a new tube leaving about 30μl of the supernatant above the pellet without disturbing the pellet. The pellet was subsequently re-suspended in 500μl buffer ATL
and mixed by pulse-vortexing for 10 s. The tube was then centrifuged for 5 min at 13,000g at full speed. The supernatant was carefully aspirated and discarded leaving only about 30μl of the supernatant to prevent any disturbance to the pellet. Thereafter, the washing steps were repeated at least three times with the ATL buffer. Thereafter, 280μl buffer ATL, 10μl proteinase K and 10μl 1 M DTT were added to the pellet. The tube was capped and the contents mixed by pulse-vortexing for 10 sec. The tube was then placed in a thermo-mixer and incubated at 56°C with shaking at 900 rpm for at least 1 hour. It was briefly centrifuged to remove drops from the inside of the lid. A volume of 300μl buffer ATL was added to the tube which was then capped and mixed by pulse-vortexing for 10 sec.
Thereafter, the tube was placed in the thermo-mixer or in a heated orbital incubator and incubated at 70°C with shaking at 900 rpm for 10 min. The tube was then centrifuged at full speed (20,000 x g) for 1 min, and the supernatant was carefully transferred to a new 1.5 ml tube to which a volume of 150μl ethanol (96-100%) was added. The tube was then capped and it was mixed by pulse-vortexing for 15 sec. Thereafter, it was centrifuged to remove drops from the inside of the lid. Following centrifugation, the entire lysate was carefully transferred from the previous step to the QIA amp Min Elute column. The lid of the column was closed and it was centrifuged at 6000 x g (8000 rpm) for 1 min. Thereafter, the QIA amp Min Elute column was transferred into a clean 2 ml collection tube and the collection tube containing the flow-through was discarded.
column was carefully opened and a volume of 700μl of ethanol (96-100%) was added. Thereafter, the column was capped and it was centrifuged at (6000 x g) for 1 min. After centrifugation, the QIA amp Min Elute column was placed in a clean 2 ml collection tube and the collection tube containing the flow-through was discarded. The tube was centrifuged at full speed (20,000 x g) for 3 min to dry the membrane completely. The QIA amp Min Elute column was placed in a clean 1.5 ml micro-centrifuge tube and the collection tube containing the flow-through. was discarded. Then lid of the QIA amp Min Elute column was opened carefully and incubated at room temperature (15-25°C) for 10 min or at 56°C for 3 min. Subsequently, a volume of 20-50μl buffer ATE was added to the centre of the membrane. The lid of the column was closed and it was incubated at room temperature (15-25°C) for 1 min and then centrifuged at full speed (20,000 x g) for 1 min (Fig.1).
Quantification:
Human DNA in the extracts was quantified using the Quantifiler™ Human DNA Quantification kit
(Applied Biosystem, Foster City, CA, USA) following the manufacturer‟s protocol, except that half volume (12.5μl) reactions were used containing 1μl of template DNA, 5.25μl of Quantifiler Human Primer Mix and 6.25μl Quantifiler PCR Reaction Mix. The reactions were run using a ABI PRISM® 7500 Real-Time PCR system (Applied Biosystems).
Data Analysis:
Statistical analyses were performed and analyzed by SPSS version 17 for Windows (SPSS Inc., Chicago, Illinois). The temperature data were in four groups of 4, 24, 37, 55°C and analysis of variance (ANOVA) was performed, which showed that DNA values decreased with increase in temperature. A value of p<0.05 was taken as significance.
RESULTS AND DICUSSION:
Effect of 55°Cand 41% humidity on DNA degradation in saliva samples:
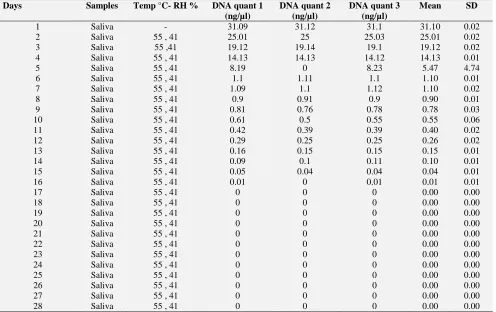
TABLE 2: SHOWS DNA QUANTIFICATION FOLLOWING EXTRACTION OF HUMAN SALIVA, INCUBATED AT TEMPERATURE OF 55°C AND HUMIDITY 41% OVER A DURATION OF 28 DAYS.
Days Samples Temp °C- RH % DNA quant 1
(ng/µl)
DNA quant 2 (ng/µl)
DNA quant 3 (ng/µl)
Mean SD
1 Saliva - 31.09 31.12 31.1 31.10 0.02
2 Saliva 55 , 41 25.01 25 25.03 25.01 0.02
3 Saliva 55 ,41 19.12 19.14 19.1 19.12 0.02
4 Saliva 55 , 41 14.13 14.13 14.12 14.13 0.01
5 Saliva 55 , 41 8.19 0 8.23 5.47 4.74
6 Saliva 55 , 41 1.1 1.11 1.1 1.10 0.01
7 Saliva 55 , 41 1.09 1.1 1.12 1.10 0.02
8 Saliva 55 , 41 0.9 0.91 0.9 0.90 0.01
9 Saliva 55 , 41 0.81 0.76 0.78 0.78 0.03
10 Saliva 55 , 41 0.61 0.5 0.55 0.55 0.06
11 Saliva 55 , 41 0.42 0.39 0.39 0.40 0.02
12 Saliva 55 , 41 0.29 0.25 0.25 0.26 0.02
13 Saliva 55 , 41 0.16 0.15 0.15 0.15 0.01
14 Saliva 55 , 41 0.09 0.1 0.11 0.10 0.01
15 Saliva 55 , 41 0.05 0.04 0.04 0.04 0.01
16 Saliva 55 , 41 0.01 0 0.01 0.01 0.01
17 Saliva 55 , 41 0 0 0 0.00 0.00
18 Saliva 55 , 41 0 0 0 0.00 0.00
19 Saliva 55 , 41 0 0 0 0.00 0.00
20 Saliva 55 , 41 0 0 0 0.00 0.00
21 Saliva 55 , 41 0 0 0 0.00 0.00
22 Saliva 55 , 41 0 0 0 0.00 0.00
23 Saliva 55 , 41 0 0 0 0.00 0.00
24 Saliva 55 , 41 0 0 0 0.00 0.00
25 Saliva 55 , 41 0 0 0 0.00 0.00
26 Saliva 55 , 41 0 0 0 0.00 0.00
27 Saliva 55 , 41 0 0 0 0.00 0.00
[image:6.612.61.557.421.733.2]It shows that each sample was analyzed in triplicate at 55°C. Note that day 1 is the zero time point (the sample with no treatment). The results were obtained from real-time PCR and they showed that the DNA in saliva samples started to degrade in
quantity after the second day until reaching zero level at day 17. The results also show significant (p< 0.05) decreases in DNA level from day 2 onwards (Table 2).
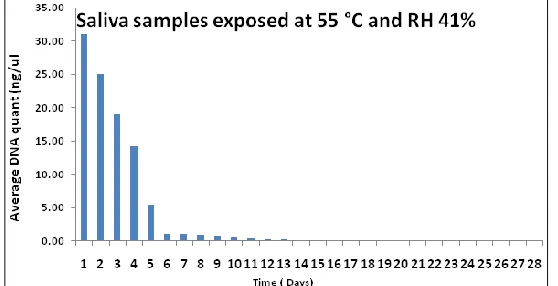
FIG. 2: BAR CHARTS SHOWSTIME-COURSE AVERAGE OF DNA RECOVERED FROM TRIPLICATE DNA QUANTIFICATION OF 50µL SALIVA SAMPLES STAINED ON BUCCAL SWAB. THE RESULTS WERE OBTAINED FROM REAL-TIME PCR AT 55OC AND AT A HUMIDITY OF 41%. NOTE THAT DAY 1 IS THE ZERO TIME POINT (THE SAMPLE WITH NO TREATMENT). ALL DATA ARE MEAN+-SD; P<0.05.
The results in Fig. 2 show that high temperature had a profound and significant (p<0.05) effect on DNA degradation which started within one day of exposure at 55oC and at a humidity of 41%. The DNA continued to degrade significantly (p<0.05) at days 2-16 compared to day 1. These results clearly
show that DNA was completely degraded in saliva samples at 55oC and at a humidity of 41%.
[image:7.612.168.447.138.281.2]DNA quantification of human blood samples following extraction at 55°C and at a humidity of 41%:
TABLE 3: SHOWS TIME COURSE OF DNA QUANTIFICATION FOLLOWING EXTRACTION OF 50 µL OF HUMAN BLOOD, INCUBATED AT TEMPERATURE OF 55°C AND RH OF 41% OVER A PERIOD OF 28 DAYS. TABLE CONTAINS ORIGINAL AND MEAN DATA WITH SD; N=3.
Day Sample Temp °C and RH % DNA quant 1
(ng/µl)
DNA quant 2 (ng/µl) DNA quant 3 (ng/µl)
Mean SD
1 Blood - 45.2 45.22 44.22 44.88 0.57
2 Blood 55, 41 44.22 44.21 44.2 44.21 0.01
3 Blood 55, 41 37.7 37 37.4 37.37 0.35
4 Blood 55, 41 31.1 31.13 31.01 31.08 0.06
5 Blood 55, 41 28.2 28 27.9 28.03 0.15
6 Blood 55, 41 24.55 24.57 24.34 24.49 0.13
7 Blood 55, 41 18.88 18.38 17.9 18.39 0.49
8 Blood 55, 41 12.23 11.95 12 12.06 0.15
9 Blood 55, 41 7.65 7.6 6.9 7.38 0.42
10 Blood 55, 41 3.44 3.34 3.01 3.26 0.23
11 Blood 55, 41 1.01 1 0.98 1.00 0.02
12 Blood 55, 41 0.5 0.1 0.13 0.24 0.22
13 Blood 55, 41 0.03 0.03 0.02 0.03 0.01
14 Blood 55, 41 0 0 0 0.00 0.00
15 Blood 55, 41 0 0 0 0.00 0.00
16 Blood 55, 41 0 0 0 0.00 0.00
17 Blood 55, 41 0 0 0 0.00 0.00
18 Blood 55, 41 0 0 0 0.00 0.00
19 Blood 55, 41 0 0 0 0.00 0.00
20 Blood 55, 41 0 0 0 0.00 0.00
21 Blood 55, 41 0 0 0 0.00 0.00
22 Blood 55, 41 0 0 0 0.00 0.00
23 Blood 55, 41 0 0 0 0.00 0.00
24 Blood 55, 41 0 0 0 0.00 0.00
[image:7.612.52.563.466.747.2]It shows the time course of DNA quantification at temperature of 55°C and RH of 41% over a period of 28 days. Note that day 1 is in fact the zero time point (the sample with no treatment). The results
showed that at 55oC and at a RH of 41%, the DNA in blood samples start to degrade significantly (p<0.05) in quantity after the third day compared to day 1 until reaching zero at day 14 (Table 3).
FIG.3: BAR CHARTS SHOWING THE TIME-COURSE AVERAGE OF DNA RECOVERED FROM TRIPLICATE DNA QUANTIFICATION OF 50µL BLOOD SAMPLES STAINED ON BUCCAL SWAB. THE RESULT OBTAINED FROM REAL-TIME PCR SHOWED THE DATA AT 55OC AND AT A HUMIDITY OF 41%. DATA ARE MEAN ± SD, N=3. * P< 0.05 FOR DAY COMPARED TO THE OTHER DAYS. NOTE THAT ALLTHE DNA WAS COMPLETELY DEGRADED BY DAY 14. NOTE THAT DAY 1 IS IN FACT THE ZERO TIME POINT (THE SAMPLE WITH NO TREATMENT).
The results presented in Fig. 3 show that DNA in blood samples started to degrade gradually at day 3 and onwards until it was completely degraded at day 12. These results are particularly interesting since they show that high temperature at 41% humidity had profound and significant (p<0.05) effect on DNA degradation. The results also
indicate that particular caution must be taken when
samples are collected for forensic DNA
examination.
[image:8.612.163.464.168.324.2]DNA quantification of human semen following extraction at 55°C and at a humidity of 41%
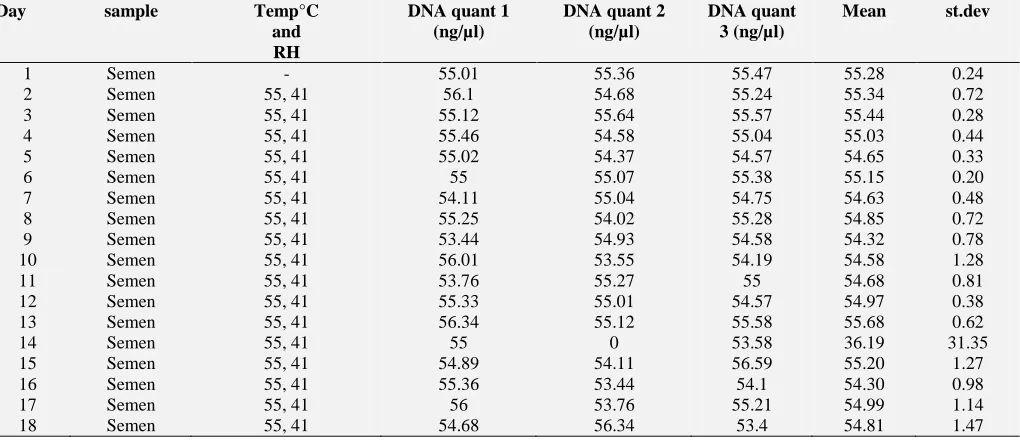
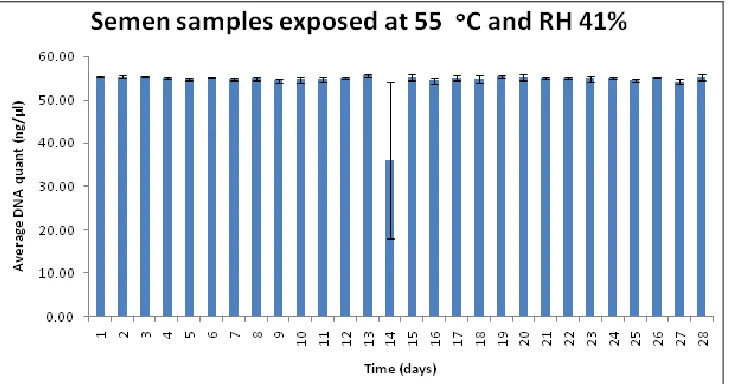
TABLE 4: SHOWS DNA QUANTIFICATION FOLLOWING EXTRACTION OF 50µL OF HUMAN SEMEN, AFTER DILUTION AND STAINED, INCUBATED AT TEMPERATURE OF 55°C OVER A DURATION OF 28 DAYS. DATA ARE ORIGINAL AND MEAN VALUES WITH SD; N=3.
Day sample Temp°C
and RH
DNA quant 1 (ng/µl)
DNA quant 2 (ng/µl)
DNA quant 3 (ng/µl)
Mean st.dev
1 Semen - 55.01 55.36 55.47 55.28 0.24
2 Semen 55, 41 56.1 54.68 55.24 55.34 0.72
3 Semen 55, 41 55.12 55.64 55.57 55.44 0.28
4 Semen 55, 41 55.46 54.58 55.04 55.03 0.44
5 Semen 55, 41 55.02 54.37 54.57 54.65 0.33
6 Semen 55, 41 55 55.07 55.38 55.15 0.20
7 Semen 55, 41 54.11 55.04 54.75 54.63 0.48
8 Semen 55, 41 55.25 54.02 55.28 54.85 0.72
9 Semen 55, 41 53.44 54.93 54.58 54.32 0.78
10 Semen 55, 41 56.01 53.55 54.19 54.58 1.28
11 Semen 55, 41 53.76 55.27 55 54.68 0.81
12 Semen 55, 41 55.33 55.01 54.57 54.97 0.38
13 Semen 55, 41 56.34 55.12 55.58 55.68 0.62
14 Semen 55, 41 55 0 53.58 36.19 31.35
15 Semen 55, 41 54.89 54.11 56.59 55.20 1.27
16 Semen 55, 41 55.36 53.44 54.1 54.30 0.98
17 Semen 55, 41 56 53.76 55.21 54.99 1.14
18 Semen 55, 41 54.68 56.34 53.4 54.81 1.47
26 Blood 55, 41 0 0 0 0.00 0.00
27 Blood 55, 41 0 0 0 0.00 0.00
[image:8.612.55.565.529.749.2]19 Semen 55, 41 54.78 55.36 56.27 55.47 0.75
20 Semen 55, 41 55.64 56.47 53.71 55.27 1.42
21 Semen 55, 41 55.27 55.27 54.62 55.05 0.38
22 Semen 55, 41 54.58 55.57 54.72 54.96 0.54
23 Semen 55, 41 53.55 55.47 55.63 54.88 1.16
24 Semen 55, 41 54.37 55.02 55.27 54.89 0.46
25 Semen 55, 41 54.93 54.14 54.52 54.53 0.40
26 Semen 55, 41 55.07 55.27 55.01 55.12 0.14
27 Semen 55, 41 54.02 53.43 55.11 54.19 0.85
28 Semen 55, 41 55.04 56.76 54.1 55.30 1.35
It shows the DNA quantification at 55°C and at a RH of 41%. The extractions were done using the QIA amp DNA Investigator Kit (Qiagen). Note that at day 14 there was human error. Note that day 1 is the zero time point (the sample with no treatment)
and the data show no significant (p>0.05) degradation of DNA quantity in semen samples was obtained comparing levels at day 1 with day 28 that at 55oC and at a RH of 41% (Table 4).
FIG. 4: BAR CHARTS SHOWING THE TIME-COURSE AVERAGE OF DNA RECOVERED FROM TRIPLICATE DNA QUANTIFICATION OF 50µL SEMEN AFTER DILUTION. THE RESULTS OBTAINED FROM REAL-TIME PCR SHOWED AT 55OC AND AT A HUMIDITY OF 41%. THE EXTRACTIONS WERE DONE USING THE QIAAMP DNA INVESTIGATOR PROTOCOL. DATA ARE MEAN ± SD, N=3. * NOTE THAT P> 0.05 FOR DAY 1 COMPARED TO ALL OTHER DAYS. NOTE THAT AT DAY 14 DNA VALUE WAS VERY LITTLE IN ONE TEST DUE TO HUMAN ERROR. NOTE ALSO THAT DAY 1 IS THE ZERO TIME POINT (THE SAMPLE WITH NO TREATMENT).
The results in Fig.4 show that at 55oC and at a RH of 41%, the DNA quantity in semen samples were more or less similar between values obtained to day 1 compared to day 28. The results show clearly that DNA in semen is more resistant to degradation following environmental insults suggesting that the
sperms have special protection mechanism in preserving DNA content.
[image:9.612.126.491.255.447.2]DNA quantification in human saliva samples following extraction at 37°C and at a humidity of 55%
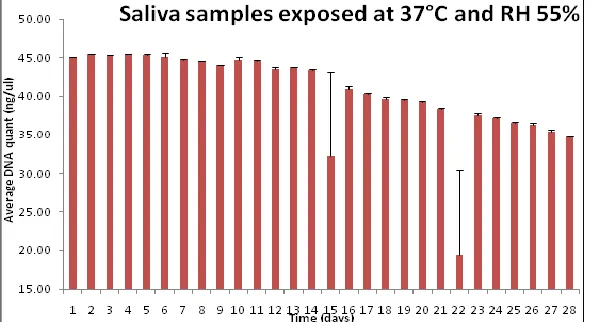
TABLE 5: SHOWS TIME COURSE OF DNA QUANTIFICATION FOLLOWING EXTRACTION OF 50µL OF HUMAN SALIVA ANDINCUBATED AT TEMPERATURE OF 37°C AND AT A RH OF 55% OVER A DURATION OF 28 DAYS. DATA ARE ORIGINAL AND MEAN VALUES WITH SD; N=3.
Days Samples Temp °C and RH 55%
DNA quant 1 (ng/µl)
DNA quant 2 (ng/µl)
DNA quant 3 (ng/µl)
Mean SD
1 Saliva - 45.01 45.06 45.02 45.03 0.03
2 Saliva 37 , 55 45.45 45.34 45.45 45.41 0.06
3 Saliva 37 , 55 45.34 45.3 45.29 45.31 0.03
4 Saliva 37 , 55 45.55 45.34 45.46 45.45 0.11
5 Saliva 37 , 55 45.27 45.45 45.34 45.35 0.09
[image:9.612.52.563.657.752.2]It shows the time course of DNA at 37°C and at a RH of 55% over a duration of 28 days. Note that day 1 is the zero time point (the sample with no treatment). The results showed that the DNA in
saliva degraded slowly starting from day 12 to day 28 but these values were not significantly different from day 1. The results also show a human error on day 22 in which DNA quantity was zero (Table 5).
FIG.5: BAR CHARTS SHOWS MEAN (+-SD) TIME-COURSE OF DNA QUANTIFICATION FOLLOWING EXTRACTION OF 50µL OF HUMAN SALIVA MATERIAL AT TEMPERATURE OF 37°C AND AT A RH OF 55%. NOTE THAT DAY 1 IS THE ZERO TIME POINT (THE SAMPLE WITH NO TREATMENT). * P< 0.05
The results presented in Fig. 5 show that the DNA in saliva degraded slowly and gradually starting from day 12 to day 28.
DNA quantity during all the days were almost close to each other and at the same time DNA quantity
from day 23 to day 28 seem different from day 1 (p<0.05).
DNA quantification from human blood samples following extraction at 37°C and at a RH of 55%.
7 Saliva 37 , 55 44.87 44.67 44.37 44.64 0.25
8 Saliva 37 , 55 44.67 44.45 44.56 44.56 0.11
9 Saliva 37 , 55 44.07 44.12 44.11 44.10 0.03
10 Saliva 37 , 55 43.92 44.66 45.36 44.65 0.72
11 Saliva 37 , 55 44.27 44.59 44.78 44.55 0.26
12 Saliva 37 , 55 43.87 43.68 43.18 43.58 0.36
13 Saliva 37 , 55 43.78 43.81 43.77 43.79 0.02
14 Saliva 37 , 55 43.12 43.32 43.66 43.37 0.27
15 Saliva 37 , 55 10.22 43.32 43.01 32.18 19.02
16 Saliva 37 , 55 40.22 41.22 41.35 40.93 0.62
17 Saliva 37 , 55 40.01 40.38 40.25 40.21 0.19
18 Saliva 37 , 55 40.01 39.69 39 39.57 0.52
19 Saliva 37 , 55 39.72 39.28 39.29 39.43 0.25
20 Saliva 37 , 55 39.01 39.11. 39.38 39.20 0.26
21 Saliva 37 , 55 38.56 38.22 38.23 38.34 0.19
22 Saliva 37 , 55 38.02 0 20.22 19.41 19.02
23 Saliva 37 , 55 37.88 37.86 37.01 37.58 0.50
24 Saliva 37 , 55 37.4 37.2 37.1 37.23 0.15
25 Saliva 37 , 55 36.67 36.46 36.67 36.60 0.12
26 Saliva 37 , 55 36.01 36.22 36.67 36.30 0.34
27 Saliva 37 , 55 35.92 35.2 34.99 35.37 0.49
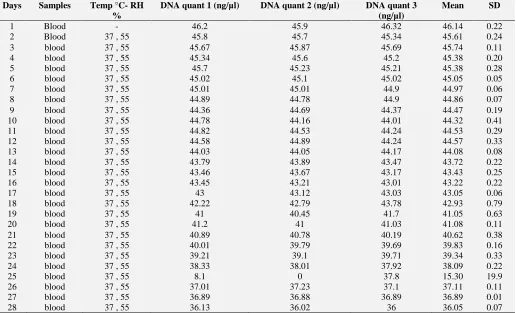
[image:10.612.160.457.401.562.2]TABLE 6: SHOWS TIME COURSE CHANGE OF DNA QUANTIFICATION FOLLOWING EXTRACTION OF 50µL OF HUMAN BLOOD SAMPLES, INCUBATED AT TEMPERATURE OF 37°C AND AT A RH OF 55% OVER A DURATION OF 28 DAYS. DATA ARE ORIGINAL AND MEAN VALUES WITH SD.
It shows time course change of DNA quantification at 37°C and at a RH of 55% over a duration of 28 days. Note that day 1 is in fact the zero time point (the sample with no treatment). The results showed that the DNA in blood samples slowly degraded
starting from day 14 but this value was only significant from day 18 and onwards compared to day 1. *P<0.05. The results also show a human error on day 25 in which DNA quantity was zero (Table 6).
FIG. 6: BAR CHARTS SHOWS MEAN (+-SD) TIME COURSE OF DNA QUANTIFICATION FOLLOWING EXTRACTION OF 50µL OF HUMAN BLOOD STAIN MATERIAL INCUBATED AT TEMPERATURE OF 37°C AND RH 55% OVER A DURATION OF 28 DAYS. NOTE THAT AT DAY 25 THE VALUES ARE VERY LOW PROBABLY DUE TO HUMAN ERROR AND DAY 1 IS
THE ZERO TIME POINT (THE SAMPLE WITH NO TREATMENT). THE RESULTS SHOWED THAT AT 37OC AND AT A RH
OF 55%, THE DNA IN BLOOD DEGRADED SLOWLY STARTING FROM DAY 14 TO DAY 28 BUT THESE VALUES WERE NOT SIGNIFICANTLY DIFFERENT FROM DAY 1. HOWEVER, THE DATA SHOW SIGNIFICANT DIFFERENCES COMPARING DAYS 24, 26, 27 AND 28 WITH DAY 1. (* P< 0.05).
Days Samples Temp °C- RH
%
DNA quant 1 (ng/µl) DNA quant 2 (ng/µl) DNA quant 3 (ng/µl)
Mean SD
1 Blood - 46.2 45.9 46.32 46.14 0.22
2 Blood 37 , 55 45.8 45.7 45.34 45.61 0.24
3 blood 37 , 55 45.67 45.87 45.69 45.74 0.11
4 blood 37 , 55 45.34 45.6 45.2 45.38 0.20
5 blood 37 , 55 45.7 45.23 45.21 45.38 0.28
6 blood 37 , 55 45.02 45.1 45.02 45.05 0.05
7 blood 37 , 55 45.01 45.01 44.9 44.97 0.06
8 blood 37 , 55 44.89 44.78 44.9 44.86 0.07
9 blood 37 , 55 44.36 44.69 44.37 44.47 0.19
10 blood 37 , 55 44.78 44.16 44.01 44.32 0.41
11 blood 37 , 55 44.82 44.53 44.24 44.53 0.29
12 blood 37 , 55 44.58 44.89 44.24 44.57 0.33
13 blood 37 , 55 44.03 44.05 44.17 44.08 0.08
14 blood 37 , 55 43.79 43.89 43.47 43.72 0.22
15 blood 37 , 55 43.46 43.67 43.17 43.43 0.25
16 blood 37 , 55 43.45 43.21 43.01 43.22 0.22
17 blood 37 , 55 43 43.12 43.03 43.05 0.06
18 blood 37 , 55 42.22 42.79 43.78 42.93 0.79
19 blood 37 , 55 41 40.45 41.7 41.05 0.63
20 blood 37 , 55 41.2 41 41.03 41.08 0.11
21 blood 37 , 55 40.89 40.78 40.19 40.62 0.38
22 blood 37 , 55 40.01 39.79 39.69 39.83 0.16
23 blood 37 , 55 39.21 39.1 39.71 39.34 0.33
24 blood 37 , 55 38.33 38.01 37.92 38.09 0.22
25 blood 37 , 55 8.1 0 37.8 15.30 19.9
26 blood 37 , 55 37.01 37.23 37.1 37.11 0.11
27 blood 37 , 55 36.89 36.88 36.89 36.89 0.01
[image:11.612.160.455.502.665.2]The results in Table 7 showed that at 37oC and RH 55%, the DNA quantity in semen samples were more or less similar but these values were not significantly (p> 0.05) different from day 1.
[image:12.612.54.567.160.471.2]DNA quantification following extraction of human semen samples at a temperature of 37°C and at a humidity of 55%.
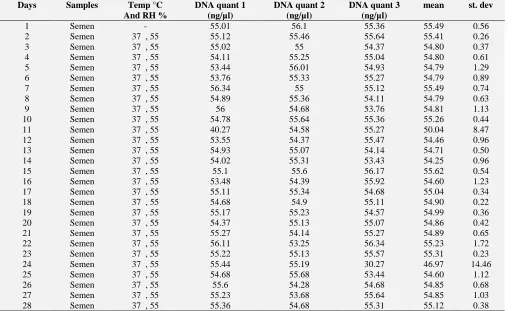
TABLE 7: SHOWS DNA QUANTIFICATION FOLLOWING EXTRACTION OF 50µL OF HUMAN SEMEN, AFTER DILUTION AND INCUBATED AT TEMPERATURE OF 37°C OVER A DURATION OF 28 DAYS. DATA ARE ORIGINAL AND MEAN VALUES WITH SD; N=3.
It shows DNA quantification at 37°C over a duration of 28 days. Each sample was analyzed in triplicate at 37°C and at a RH of 55%. Note that day 1 is in fact the zero time point (the sample with no treatment). The results showed no significant
(p>0.05) degradation of DNA quantity in semen samples was obtained, comparing levels in day 1 with all the other days including day 28 at 37oC and at a RH of 55% (Table 7).
FIG. 7: BAR CHARTS SHOWS TIME COURSE OF DNA QUANTIFICATION FOLLOWING EXTRACTION OF 50µL OF HUMAN SEMEN STAIN SAMPLES INCUBATED AT TEMPERATURE OF 37°C AND RH 55% OVER A DURATION OF 28 DAYS. DATA ARE MEAN ± SD, N=3. (P >0.05 FOR DAY 1 COMPARED TO ALL THE OTHER DAYS. NOTE THAT AT DAY 11 AND 24 DNA VALUE WAS REDUCED IN ONE TEST DUE TO HUMAN ERROR (DATA TAKEN FROM TABLE 4.8).
Days Samples Temp °C
And RH %
DNA quant 1 (ng/µl)
DNA quant 2 (ng/µl)
DNA quant 3 (ng/µl)
mean st. dev
1 Semen - 55.01 56.1 55.36 55.49 0.56
2 Semen 37 , 55 55.12 55.46 55.64 55.41 0.26
3 Semen 37 , 55 55.02 55 54.37 54.80 0.37
4 Semen 37 , 55 54.11 55.25 55.04 54.80 0.61
5 Semen 37 , 55 53.44 56.01 54.93 54.79 1.29
6 Semen 37 , 55 53.76 55.33 55.27 54.79 0.89
7 Semen 37 , 55 56.34 55 55.12 55.49 0.74
8 Semen 37 , 55 54.89 55.36 54.11 54.79 0.63
9 Semen 37 , 55 56 54.68 53.76 54.81 1.13
10 Semen 37 , 55 54.78 55.64 55.36 55.26 0.44
11 Semen 37 , 55 40.27 54.58 55.27 50.04 8.47
12 Semen 37 , 55 53.55 54.37 55.47 54.46 0.96
13 Semen 37 , 55 54.93 55.07 54.14 54.71 0.50
14 Semen 37 , 55 54.02 55.31 53.43 54.25 0.96
15 Semen 37 , 55 55.1 55.6 56.17 55.62 0.54
16 Semen 37 , 55 53.48 54.39 55.92 54.60 1.23
17 Semen 37 , 55 55.11 55.34 54.68 55.04 0.34
18 Semen 37 , 55 54.68 54.9 55.11 54.90 0.22
19 Semen 37 , 55 55.17 55.23 54.57 54.99 0.36
20 Semen 37 , 55 54.37 55.13 55.07 54.86 0.42
21 Semen 37 , 55 55.27 54.14 55.27 54.89 0.65
22 Semen 37 , 55 56.11 53.25 56.34 55.23 1.72
23 Semen 37 , 55 55.22 55.13 55.57 55.31 0.23
24 Semen 37 , 55 55.44 55.19 30.27 46.97 14.46
25 Semen 37 , 55 54.68 55.68 53.44 54.60 1.12
26 Semen 37 , 55 55.6 54.28 54.68 54.85 0.68
27 Semen 37 , 55 55.23 53.68 55.64 54.85 1.03
[image:12.612.175.454.561.704.2]The results in Table 7 showed that at 37ºC and RH 55%, the DNA quantity in semen samples were more or less similar but these values were not significantly (p> 0.05) different from day 1.
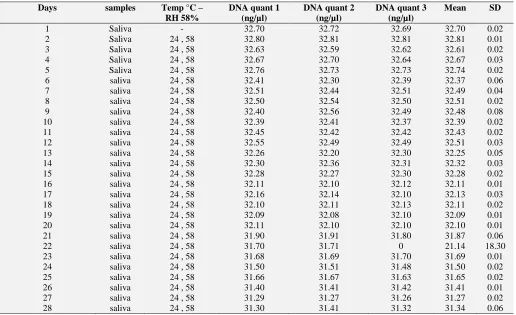
[image:13.612.50.566.139.454.2]DNA quantification following extraction of human saliva samples at temperature of 24°C and at a humidity of 58%.
TABLE 8: SHOWS TIME COURSE OF DNA QUANTIFICATION INCUBATED AT TEMPERATURE OF 24°C AND AT A RH OF 58% OVER A DURATION OF 28 DAYS. DATA ARE ORIGINAL AND MEAN VALUES.
It shows the time course of DNA at 24°C and at a RH of 58 % over a duration of 28 days. Note that at day 22, DNA quantity was zero and this was related to human error and day 1 is in fact the zero time point i.e. the sample with no treatment. The
results showed no significant (p> 0.05) degradation of DNA quantity in saliva samples at temperature of 24°C and at a RH of 58%, comparing levels in day 1 with day 28 (Table 8).
FIG. 8: BAR CHARTS SHOWSTIME COURSE OF DNA QUANTIFICATION FOLLOWING EXTRACTION OF 50 µL OF HUMAN SALIVA STAIN MATERIAL INCUBATED AT TEMPERATURE OF 24°C AND AT A RH OF 58% OVER A DURATION OF 28 DAYS. DATA ARE MEAN ± SD, N=3. P > 0.05 FOR DAY 1 COMPARED TO ALL THE OTHER DAYS. NOTE THAT AT DAY 22 DNA VALUE WAS VERY LITTLE IN ONE TEST DUE TO HUMAN ERROR
Days samples Temp °C –
RH 58%
DNA quant 1 (ng/µl)
DNA quant 2 (ng/µl)
DNA quant 3 (ng/µl)
Mean SD
1 Saliva - 32.70 32.72 32.69 32.70 0.02
2 Saliva 24 , 58 32.80 32.81 32.81 32.81 0.01
3 Saliva 24 , 58 32.63 32.59 32.62 32.61 0.02
4 Saliva 24 , 58 32.67 32.70 32.64 32.67 0.03
5 Saliva 24 , 58 32.76 32.73 32.73 32.74 0.02
6 saliva 24 , 58 32.41 32.30 32.39 32.37 0.06
7 saliva 24 , 58 32.51 32.44 32.51 32.49 0.04
8 saliva 24 , 58 32.50 32.54 32.50 32.51 0.02
9 saliva 24 , 58 32.40 32.56 32.49 32.48 0.08
10 saliva 24 , 58 32.39 32.41 32.37 32.39 0.02
11 saliva 24 , 58 32.45 32.42 32.42 32.43 0.02
12 saliva 24 , 58 32.55 32.49 32.49 32.51 0.03
13 saliva 24 , 58 32.26 32.20 32.30 32.25 0.05
14 saliva 24 , 58 32.30 32.36 32.31 32.32 0.03
15 saliva 24 , 58 32.28 32.27 32.30 32.28 0.02
16 saliva 24 , 58 32.11 32.10 32.12 32.11 0.01
17 saliva 24 , 58 32.16 32.14 32.10 32.13 0.03
18 saliva 24 , 58 32.10 32.11 32.13 32.11 0.02
19 saliva 24 , 58 32.09 32.08 32.10 32.09 0.01
20 saliva 24 , 58 32.11 32.10 32.10 32.10 0.01
21 saliva 24 , 58 31.90 31.91 31.80 31.87 0.06
22 saliva 24 , 58 31.70 31.71 0 21.14 18.30
23 saliva 24 , 58 31.68 31.69 31.70 31.69 0.01
24 saliva 24 , 58 31.50 31.51 31.48 31.50 0.02
25 saliva 24 , 58 31.66 31.67 31.63 31.65 0.02
26 saliva 24 , 58 31.40 31.41 31.42 31.41 0.01
27 saliva 24 , 58 31.29 31.27 31.26 31.27 0.02
[image:13.612.175.441.552.702.2]The results in Fig. 8 show that at 24oC and RH 58%, the DNA quantity in saliva samples were more or less similar but these values were not significantly (p> 0.05) different from day 1.
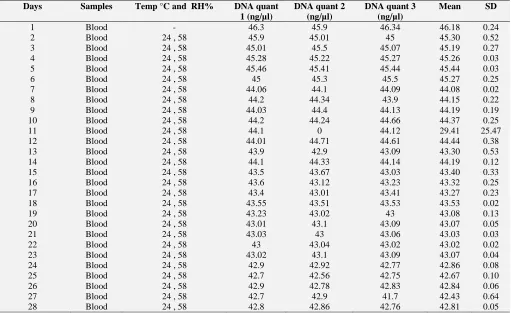
[image:14.612.54.565.142.455.2]DNA quantification from human blood samples following extraction at 24°C and at a humidity of 61%
TABLE 9: TABLE SHOWING THE TIME COURSE OF DNA QUANTIFICATION INCUBATED AT TEMPERATURE OF 24°C AND AT RH OF 58% OVER A DURATION OF 28 DAYS. DATA ARE ORIGINAL AND MEAN VALUES.
It shows the time course of DNA quantification at 24 °C and at RH of 58% over a duration of 28 days. Data are mean ± SD, n=3. Note that at day 11 DNA value was zero due to human error and day 1 is in
fact the zero time point i.e. the sample with no treatment. The results show no significant degradation of the DNA samples comparing day one with day 28. (p> 0.05) (Table 9).
FIG. 9: BAR CHARTS SHOWS TIME COURSE OF DNA QUANTIFICATION FOLLOWING EXTRACTION OF 50µL OF HUMAN BLOOD STAIN SAMPLES INCUBATED AT TEMPERATURE OF 24 °C AND AT RH OF 58% OVER A DURATION OF 28 DAYS. DATA ARE MEAN ± SD, N=3. NOTE THAT AT DAY 11, THE DNA VALUE WAS ZERO READING IN ONE SAMPLE PROBABLY DUE TO HUMAN ERROR.
The results in Fig.9 show that at 24oC and at a RH of 58%, the DNA quantity in blood samples
showed no significant (P>0.05) degradation of DNA comparing day one with day 28.
Days Samples Temp °C and RH% DNA quant
1 (ng/µl)
DNA quant 2 (ng/µl)
DNA quant 3 (ng/µl)
Mean SD
1 Blood - 46.3 45.9 46.34 46.18 0.24
2 Blood 24 , 58 45.9 45.01 45 45.30 0.52
3 Blood 24 , 58 45.01 45.5 45.07 45.19 0.27
4 Blood 24 , 58 45.28 45.22 45.27 45.26 0.03
5 Blood 24 , 58 45.46 45.41 45.44 45.44 0.03
6 Blood 24 , 58 45 45.3 45.5 45.27 0.25
7 Blood 24 , 58 44.06 44.1 44.09 44.08 0.02
8 Blood 24 , 58 44.2 44.34 43.9 44.15 0.22
9 Blood 24 , 58 44.03 44.4 44.13 44.19 0.19
10 Blood 24 , 58 44.2 44.24 44.66 44.37 0.25
11 Blood 24 , 58 44.1 0 44.12 29.41 25.47
12 Blood 24 , 58 44.01 44.71 44.61 44.44 0.38
13 Blood 24 , 58 43.9 42.9 43.09 43.30 0.53
14 Blood 24 , 58 44.1 44.33 44.14 44.19 0.12
15 Blood 24 , 58 43.5 43.67 43.03 43.40 0.33
16 Blood 24 , 58 43.6 43.12 43.23 43.32 0.25
17 Blood 24 , 58 43.4 43.01 43.41 43.27 0.23
18 Blood 24 , 58 43.55 43.51 43.53 43.53 0.02
19 Blood 24 , 58 43.23 43.02 43 43.08 0.13
20 Blood 24 , 58 43.01 43.1 43.09 43.07 0.05
21 Blood 24 , 58 43.03 43 43.06 43.03 0.03
22 Blood 24 , 58 43 43.04 43.02 43.02 0.02
23 Blood 24 , 58 43.02 43.1 43.09 43.07 0.04
24 Blood 24 , 58 42.9 42.92 42.77 42.86 0.08
25 Blood 24 , 58 42.7 42.56 42.75 42.67 0.10
26 Blood 24 , 58 42.9 42.78 42.83 42.84 0.06
27 Blood 24 , 58 42.7 42.9 41.7 42.43 0.64
[image:14.612.175.453.538.665.2]DNA quantification from human semen samples following extraction at 24°C and at 58% humidity:
TABLE 10: SHOWS DNA QUANTIFICATION FOLLOWING EXTRACTION OF 50µL OF HUM AN SEMEN AFTER DILUTION AND INCUBATED AT TEMPERATURE OF 24°C AND AT A HUMIDITY OF 58% OVER A DURATION OF 28 DAYS. DATA ARE ORIGINAL AND MEAN VALUES WITH SD; N=3.
It shows DNA quantification at 24°C and at a humidity of 58% over a duration of 28 days. Note that day 1 is in fact the zero time point i.e. the sample with no treatment. The results showed no
significant (p>0.05) degradation of DNA quantity in semen samples comparing levels in day 1 with day 28 at 24oC and at 58% humidity (Table 10).
FIG. 10: BAR CHARTS SHOWS TIME COURSE OF DNA QUANTIFICATION FOLLOWING EXTRACTION OF 50 NG/µL OF HUMAN SEMEN STAIN SAMPLES INCUBATED AT TEMPERATURE OF 24°C AND AT A HUMIDITY 58% OVER A DURATION OF 28 DAYS. THE EXTRACTIONS WERE DONE USING THE QIAAMP DNA INVESTIGATOR PROTOCOL. DATA ARE MEAN ± SD, N=3. P> 0.05 FOR DAY 1 COMPARED TO ALL OTHER DAYS. NOTE THAT AT DAY 24 DNA VALUE WAS LITTLE IN ONE TEST DUE TO HUMAN ERROR. (DATA TAKEN FROM TABLE 5.11).
Days Samples Temp °C and
RH %
DNA quant 1 (ng/µl)
DNA quant 2 (ng/µl)
DNA quant 3 (ng/µl)
mean SD
1 Semen - 55.28 55.31 55.1 55.23 0.11
2 Semen 24, 58 54.19 54.61 53.01 53.94 0.83
3 Semen 24, 58 54.54 55.6 56.01 55.38 0.76
4 Semen 24, 58 53.24 54.11 53.48 53.61 0.45
5 Semen 24, 58 56.37 54.39 55.32 55.36 0.99
6 Semen 24, 58 54.11 55.18 56.12 55.14 1.01
7 Semen 24, 58 55.21 55.34 55.11 55.22 0.12
8 Semen 24, 58 53.41 54.17 54.8 54.13 0.70
9 Semen 24, 58 56.22 54.9 55.3 55.47 0.68
10 Semen 24, 58 53.28 53.16 54.89 53.78 0.97
11 Semen 24, 58 54.63 55.23 54.68 54.85 0.33
12 Semen 24, 58 54.64 55.48 55.27 55.13 0.44
13 Semen 24, 58 55.61 55.13 54.37 55.04 0.63
14 Semen 24, 58 55.2 55.11 55.17 55.16 0.05
15 Semen 24, 58 54.51 54.14 54.68 54.44 0.28
16 Semen 24, 58 55.28 53 55.64 54.64 1.43
17 Semen 24, 58 55.11 53.25 54.37 54.24 0.94
18 Semen 24, 58 54.11 56.33 54.93 55.12 1.12
19 Semen 24, 58 54.37 55.13 55.57 55.02 0.61
20 Semen 24, 58 55.01 56.69 55.27 55.66 0.90
21 Semen 24, 58 55.22 55.19 55.17 55.19 0.03
22 Semen 24, 58 54.02 55.68 55.01 54.90 0.84
23 Semen 24, 58 54.89 55.68 56.11 55.56 0.62
24 Semen 24, 58 56.23 20.01 55.11 43.78 20.60
25 Semen 24, 58 54.6 54.28 55.22 54.70 0.48
26 Semen 24, 58 54.68 55.68 55.1 55.15 0.50
27 Semen 24, 58 55.57 53.68 55.44 54.90 1.06
[image:15.612.159.456.508.681.2]The results in Fig. 10 show that at 24 oC and at RH of 58%, the DNA quantity in semen samples were more or less similar but these values were not significantly different comparing day 1 with all other values up to day 28. (p> 0.05).
[image:16.612.54.565.167.506.2]DNA quantification following extraction of human saliva material at temperature of 4°C and at a humidity of 61%.
TABLE 11: SHOWS TIME COURSE OF DNA QUANTIFICATION FOLLOWING EXTRACTION OF 50µL OF HUMAN SALIVA AND INCUBATED AT TEMPERATURE OF 4°C AND RH 61% OVER A DURATION OF 28 DAYS. DATA ARE ORIGINAL AND MEAN DATA WITH SD; N=3.
It shows the time course of DNA at 4°C and RH 61% over a duration of 28 days. Note that day 1 is in fact the zero time point i.e. the sample with no treatment. The showed no significant (p> 0.05)
degradation of DNA in saliva samples comparing all days with day 1 (Table 11).
FIG. 11: BAR CHARTS SHOWSTIME COURSE AVERAGE OF DNA MEASUREMENT RECOVERED FROM TRIPLICATE EXTRACTIONS IN SALIVA SAMPLES. DNA WAS EXTRACTED FROM 50µL HUMAN SALIVA SAMPLES THAT SUBJECTED TO 4°C AND AT RH OF 61% FOR 28 DAYS. DATA ARE MEAN (±SD), N=3. P> 0.05 FOR DAY 1 COMPARED TO ALL OTHER DAYS
Days Samples Temp°C and RH % DNA quant 1 (ng/µl)
DNA quant 2 (ng/µl)
DNA quant 3 (ng/µl)
Mean SD
1 Saliva - 32.40 32.46 32.49 32.45 0.05
2 Saliva 4 , 61 32.50 32.44 32.50 32.48 0.03
3 Saliva 4 , 61 32.51 32.34 32.51 32.45 0.10
4 Saliva 4 , 61 32.41 32.30 32.39 32.37 0.06
5 Saliva 4 , 61 32.76 32.73 32.73 32.74 0.02
6 Saliva 4 , 61 32.67 32.70 32.64 32.67 0.03
7 Saliva 4 , 61 32.63 32.59 32.62 32.61 0.02
8 Saliva 4 , 61 32.80 32.81 32.81 32.81 0.01
9 Saliva 4 , 61 32.70 32.72 32.69 32.70 0.02
10 Saliva 4 , 61 32.73 32.73 32.76 32.74 0.02
11 Saliva 4 , 61 32.79 32.65 32.68 32.71 0.07
12 Saliva 4 , 61 32.75 32.72 32.74 32.74 0.02
13 Saliva 4 , 61 32.69 32.70 32.71 32.70 0.01
14 Saliva 4 , 61 32.40 32.46 32.49 32.45 0.05
15 Saliva 4 , 61 32.30 32.39 32.41 32.37 0.06
16 Saliva 4 , 61 32.73 32.73 32.76 32.74 0.02
17 Saliva 4 , 61 32.71 32.64 32.67 32.67 0.04
18 Saliva 4 , 61 32.58 32.62 32.63 32.61 0.03
19 Saliva 4 , 61 32.83 32.81 32.80 32.81 0.02
20 Saliva 4 , 61 32.74 32.69 32.70 32.71 0.03
21 Saliva 4 , 61 32.70 32.75 32.73 32.73 0.03
22 Saliva 4 , 61 32.71 32.70 32.73 32.71 0.02
23 Saliva 4 , 61 32.32 32.30 32.32 32.31 0.01
24 Saliva 4 , 61 32.46 32.47 32.44 32.46 0.02
25 Saliva 4 , 61 32.53 32.54 32.56 32.54 0.02
26 Saliva 4 , 61 32.53 32.55 32.56 32.55 0.02
27 Saliva 4 , 61 32.43 32.44 32.43 32.43 0.01
[image:16.612.182.438.588.722.2]The results in Fig. 11 show that exposure of salivary DNA at 4°C and at a RH of 61%, over a duration of 28 days had no significant (p> 0.05) effect on salivary DNA degradation comparing all the other days with day 1.
[image:17.612.52.566.169.481.2]DNA quantification from human blood samples following extraction at 4°C and at 61% humidity:
TABLE 12: SHOWS TIME COURSE OF DNA QUANTIFICATION ALLOWING EXTRACTION OF 50µL OF HUMAN BLOOD AND INCUBATED AT TEMPERATURE OF 4°C AND AT RH OF 61%. DATA ARE ORIGINAL AS WELL AS THE MEAN ± SD VALUES, N=3.
Table 4.13 shows the time course of DNA quantification at 4 °C and at RH of 61%. Data are mean ± SD, n=3. Note that at day 11 DNA value was zero due to human error and day 1 is in fact the zero time point i.e. the sample with no treatment.
The results showed no significant (p>0.05) degradation of DNA in blood samples over a duration of 28 days comparing values from day one to day 28 (Table 12).
FIG. 12: BAR CHARTS SHOWS TIME-COURSE AVERAGE OF DNA RECOVERED FROM TRIPLICATE MEASUREMENTS IN HUMAN BLOOD SAMPLES AT TEMPERATURE 4°C AND RH 61% FOR A PERIOD OF 28 DAYS. THE EXTRACTIONS WERE DONE USING THE DNEASY® PROTOCOL AND ALL VALUES ARE EXPRESSED AS MEAN ±SD. P> 0.05 FOR DAY 1 COMPARED TO ALL OTHER DAYS. NOTE THAT LARGE SD IN DAY 11 DUE TO HUMAN ERROR IN ONE OF THE READINGS AND DAY 1 IS IN FACT THE ZERO TIME POINT I.E. THE SAMPLE WITH NO TREATMENT.
Days Samples Temp °C and
RH %
DNA quant 1 (ng/µl)
DNA quant 2 (ng/µl)
DNA quant 3 (ng/µl)
Mean SD
1 Blood - 45.22 45.09 45.32 45.21 0.12
2 Blood 4 , 61 45.21 45.26 45.37 45.28 0.08
3 Blood 4 , 61 45.32 45.33 45.42 45.36 0.06
4 Blood 4 , 61 45.33 45.54 45.67 45.51 0.17
5 Blood 4 , 61 45.36 45 45.36 45.24 0.21
6 Blood 4 , 61 45.12 45.34 45.15 45.20 0.12
7 Blood 4 , 61 45.57 45.34 45.67 45.53 0.17
8 Blood 4 , 61 45.57 45.34 45.96 45.62 0.31
9 Blood 4 , 61 45.47 45.17 45.01 45.22 0.23
10 Blood 4 , 61 45.82 45.49 45.78 45.70 0.18
11 Blood 4 , 61 45.36 0 45.16 30.17 26.13
12 Blood 4 , 61 45.68 45.74 45.78 45.73 0.05
13 Blood 4 , 61 45.92 44.9 45.39 45.40 0.51
14 Blood 4 , 61 45.37 45.29 45.33 45.33 0.04
15 Blood 4 , 61 45.67 45.34 45.56 45.52 0.17
16 Blood 4 , 61 45.2 45.26 45.09 45.18 0.09
17 Blood 4 , 61 45.21 45.26 45.03 45.17 0.12
18 Blood 4 , 61 45.09 45.11 45 45.07 0.06
19 Blood 4 , 61 45.19 45.05 45.12 45.12 0.07
20 Blood 4 , 61 45.38 45.29 45.65 45.44 0.19
21 Blood 4 , 61 45 45.07 45.02 45.03 0.04
22 Blood 4 , 61 45.31 45.4 45.29 45.33 0.06
23 Blood 4 , 61 45 45.06 45.22 45.09 0.11
24 Blood 4 , 61 45.66 45.28 45.48 45.47 0.19
25 Blood 4 , 61 45.45 45.27 45.44 45.39 0.10
26 Blood 4 , 61 45.45 45.87 45.09 45.47 0.39
27 Blood 4 , 61 45.05 45.11 45.18 45.11 0.07
[image:17.612.177.440.569.697.2]The results in Fig. 12 reveal that there was no significant (p>0,05) DNA degradation in blood
samples comparing day one to day 28.
DNA quantification of human semen samples following extraction at 4°Cand at 61% humidity:
TABLE 13: SHOWS DNA QUANTIFICATION FOLLOWING EXTRACTION OF 50µL OF HUMAN SEMEN SAMPLES AND INCUBATED AT TEMPERATURE OF 4°C AND AT A RH OF 61% OVER A DURATION OF 28 DAYS. DATA ARE ORIGINAL AND MEAN VALUES
It shows the DNA quantification at 4°C and at a RH of 61% over a duration of 28 days. Each sample was analyzed in triplicate at 4°C. Note that day 1 is in fact the zero time point i.e. the sample with no treatment. The results showed no
[image:18.612.52.566.158.470.2]significant degradation of DNA quantity in semen samples at temperature of 4°C and at a RH of 61%, comparing levels in day 1 with day 28 at 4oC and RH 61% (Table 13).
FIG.13: BAR CHARTS SHOWS TIME COURSE OF DNA QUANTIFICATION FOLLOWING EXTRACTION OF 50NG/µL OF HUMAN SEMEN STAIN MATERIAL INCUBATED AT TEMPERATURE OF 4°C AND RH 61% OVER A DURATION OF 28 DAYS. DATA ARE MEAN ± SD, N=3. P> 0.05 FOR DAY 1 COMPARED TO ALL OTHER DAYS. NOTE THAT ATDAYS 24 DNA VALUE WAS REDUCED IN ONE TEST DUE TO HUMAN ERROR
Days Samples Temp °C and
RH%
DNA quant 1 (ng/µl)
DNA quant 2 (ng/µl)
DNA quant 3 (ng/µl)
mean SD
1 Semen - 55.28 54.28 55.36 54.97 0.60
2 Semen 4 , 61 55.2 55.19 54.6 55.00 0.34
3 Semen 4 , 61 56.17 54.54 55.64 55.45 0.83
4 Semen 4 , 61 55.32 53.24 55.1 54.55 1.14
5 Semen 4 , 61 54.8 56.27 55.2 55.42 0.76
6 Semen 4 , 61 56.22 54.12 55.07 55.14 1.05
7 Semen 4 , 61 55.48 55.11 55.04 55.21 0.24
8 Semen 4 , 61 54.68 53.11 56.12 54.64 1.51
9 Semen 4 , 61 55.92 56.2 54.68 55.60 0.81
10 Semen 4 , 61 55.01 53.47 53.55 54.01 0.87
11 Semen 4 , 61 54.1 30.2 55.27 46.52 14.15
12 Semen 4 - 61 54.28 54.28 55.01 54.52 0.42
13 Semen 4 , 61 55.12 55.48 55.12 55.24 0.21
14 Semen 4 , 61 55.46 55.29 55.02 55.26 0.22
15 Semen 4 , 61 54.68 54.38 54.11 54.39 0.29
16 Semen 4 , 61 56.81 55.69 53.44 55.31 1.72
17 Semen 4 , 61 54.62 55.18 53.76 54.52 0.72
18 Semen 4 , 61 54.35 54.1 56.34 54.93 1.23
19 Semen 4 , 61 55.62 54.58 55.36 55.19 0.54
20 Semen 4 , 61 55.11 55.58 56.47 55.72 0.69
21 Semen 4 , 61 55.46 55.69 55.27 55.47 0.21
22 Semen 4 , 61 55.47 54.59 55.57 55.21 0.54
23 Semen 4 , 61 55.27 54.79 55.47 55.18 0.35
24 Semen 4 , 61 54.57 56.89 55.02 55.49 1.23
25 Semen 4 , 61 55.57 54.39 54.14 54.70 0.76
26 Semen 4 , 61 54.13 54.93 55.27 54.78 0.59
27 Semen 4 , 61 55.27 55 53.43 54.57 0.99
[image:18.612.181.442.565.706.2]The results in Fig.13 show that the DNA quantity in semen samples remained more or less same at 4oC and RH 61% and for all 28 days, but these values were not significantly (p>0.05) different from day 1. The experiments presented in this study were done to simulate circumstances of a crime scene in which a body may be found in different seasons in Kuwait. The techniques employed in this study for DNA quantification provided the best markers with the DNA preservation in the samples used in this investigation. The DNA is normally degraded rapidly post-mortem, initially from the enzymes released as the cell dies losing its structural integrity and then later from environmental insults.6
For this purpose, blood, saliva and semen samples were exposed in the present study to four ranges of temperature (55°C, 37°C, 24°C and 4°C) and four ranges of relative humidity (41%, 55%, 58% and 61%), respectively at different time points starting from day 1 to day 28. The aim of this study was to ascertain how DNA can persist following changes in both temperature and humidity. The rationale was to mimic a natural environmental condition normally occurring in Kuwait during different season. The results show that at a low a temperature of 4°C and at a RH of 61% the DNA was not significantly degraded either in blood, saliva or semen samples for the whole period of the study (28 days) comparing values for day one with all other days. Typically, the mean values of 45.21 ± 0.12 ng/µl, 32.45 ±0.05 ng/µl and 54.97 ± 0.60 ng/µl were obtained for blood, saliva and semen, respectively at day 1 compared to values of 45.34 ± 0.09 ng/µl, 32.41 ± 0.02 ng/µl and 55.65 ± 0.96 ng/µl at day 28, respectively, These data revealed no significant change in DNA quantity at a low temperature of 4°C and at a humidity of 58%. It is well known that low temperature tends to preserve DNA better in the samples.6, 8
Similarly, at temperature of 24°C and at a RH of 58%, the quantity of DNA in blood samples was 46.3 ±0.24ng/ul at day 1 and this decreased slightly to 42.81±0.05 ng/µl at day 28. Likewise, the DNA quantity found in saliva samples was 32.70 ± 0.02 ng/µl at day 1 and then decreased slightly to 31.34 ± 0.06 ng/µl at day 28. Similarly, the DNA quantity obtained from semen samples in 24°C and at a RH
of 58% at day 1 was 55.23 ± 0.11 ng/µl compared to 55.48 ± 1.12 ng/µl. at day 28 These results showed no significant degradation of DNA comparing DNA level at day 1 to day 28 at 24°C. A temperature of 24°C and a humidity of 58% are physiological ranges for DNA persistence.
The present results have also shown that the quantity of DNA from human blood samples incubated at 37°C and at a humidity of 55% decreased as the time points increased. These results show that the relative humidity of 55% and temperature of 37°C did not play any significant role in DNA degradation at least up to day 20. As time increased, DNA started to degrade gradually becoming significant after day 19 and onwards. This slow degradation was probably due to the fact that the humidity was probably not high enough. Typically, DNA quantification of human blood following extraction at 37°C was 46.14 ± 0.22 ng/µl at day one then it started to decrease reaching 36.05 ± 0.07ng/µl at day 28. The same is true for the result obtained at 37oC in saliva samples. The DNA quantity was 45.03 ± 0.03 ng/µl on day 1 and reduced to 34.71±0.07ng/µl at day 28. Surprisingly, in semen samples the DNA quantity at day 1 was 55.49 ng/µl ± 0.56 and remained almost the same at day 28 at a mean value of 55.12 ± 0.38 ng/µl (Fig. 4, 5 and 6). These results have indicated that the quantity of DNA in both blood and saliva samples showed slow degradation which started from around days 15-19 and this was probably due to both micro-organisms effect of temperature and humidity.9 In contrast, in semen samples the quantity of DNA remained almost the same with no sign of degradation during the whole period.
and blood samples show more or less the same pattern for DNA degradation over time at 55ºC. In contrast, the quantity of DNA obtained from semen sample at day 1 was 55.28 ± 0.24ng/µl compared to 55.30 ± 1.35ng/µl at day 28. The results have clearly indicated that semen samples seem to be resistant to degradation at high temperature even when exposed over 28 days.
Temperature and humidity are known to play both physiological and an evident role in DNA degradation and Kuwait is a typical country in the Middle East in which the temperature is liable to be variable due to seasonal changes. Although, relative humidity in Kuwait is not high to affect the DNA degradation, several studies have concluded that elevated humidity provides the best growth conditions for microorganism (bacteria and fungi), which participate in the degradation process.21, 22 Similar findings were obtained by Zhang et al (2010) on bone marrow specimens that were preserved in temperature of 24°C for 2 months. 25
The technique of DNA profiling is expensive and, moreover, it is a time consuming procedure. The data obtained in this study have indicated that DNA survival could be found in both saliva and blood samples until day 13 and 17 respectively, when the temperature reached 55°C. The results showed significant increases in the level of DNA degradation along with increase in both time and temperature (55°C). In contrast, the results show that exposure of sperms (semen) to a high temperature of 55°C and humidity of 41% had no significant effect on DNA degradation comparing day 1 with all the other days. The results of this study have also shown no significant changes in DNA degradation in the blood and saliva samples exposed at either 24°C or 4°C. It is now well known that low temperatures have the ability to preserve the quantity of DNA in biological samples. 6, 9
Firstly, the results have clearly indicated that, if samples of either blood, saliva, semen or similar materials were transferred to the DNA laboratory after 12-15 days and the crime was committed in a very hot season such as July (55 °C or above), then there is no chance to find survival DNA and moreover, there may be no need to waste time,
materials and manpower in assessing the samples for DNA. Second, the results have also indicated that DNA can be obtained from semen evidence even during the hot season because it can resist elevated temperature, probably because of the structure of the sperm head.25
The success of forensic scientist in investigating a crime scene for evidence is the ability to profile samples for DNA survival successfully.26 When a DNA sample has been degraded by any means, the average size of a DNA fragment might be reduced to less than 300 bp leading to insufficient DNA template, resulting in an inability to identify the individual. Several studies have been done to investigate factors affecting biological evidence that are recovered from a crime scene. 27 These evidences are usually exposed to different environmental insults or conditions such as heat, humidity, chemical and microorganisms (bacteria and fungi) and others.6 These factors can affect the stability and survival of the DNA.28 Thus, to ensure that the recovered DNA can support the casework or not, the effect of environmental conditions on DNA survival should be investigated.
A similar study was done by Alaeddini et al (2010) who investigate the environmental factors affecting DNA degradation process that were exposed to a high temperature of 48°C. These results revealed that a temperature of 48°C can cause a high degree of degradation on blood stain samples.27 In another study conducted by Rebecchi et al (2009), on the effect of temperature over 21 days of exposure, their results revealed that high temperatures reaching 50°C can change significantly the state of DNA stability thus reducing its survival. 29