Full Length Research Article
WINTERTIME AEROSOL OPTICAL PROPERTIES AND RADIATIVE FORCING OVER ROHTAK
*1
Vikram Mor,
1Rajesh Dhankhar,
2Attri, S. D.,
2Soni, V. K. and
2Sateesh, M.
1
Department of Environmental Science, M.D.U. Rohtak, Haryana-124001
2Indian Meteorological Department, M.D.U. Rohtak, New Delhi
110003
ARTICLE INFO ABSTRACT
The present work was focused on analyzing the aerosol optical properties over Rohtak during winter season from December 2015 to February 2016 using sky-radiometer data. The results reveal that AOD shows strong spectral dependence. Higher value of AOD was observed during January at all wavelengths. The monthly mean AOD at 500 nm were found to be 0.44±0.23, 0.80±0.37 and 0.57±0.34 for December, January and February, respectively with seasonal average of 0.63±0.36. Higher values of Alpha predominantly ranged from 0.8-1.4 indicates the relative dominance of fine mode particles to the aerosol loading over the station. Volume size distribution exhibits bimodal distribution with dominant fine mode around 0.17 µm and coarse mode around 11 µm. The derived aerosol optical properties are used in SBDART model for aerosol radiative forcing estimation. Monthly mean atmospheric radiative forcing values are +7, +14 and +12 Wm2 for December, January and February respectively.
Copyright©2016, Vikram Mor et al.This is an open access article distributed under the Creative Commons Attribution License, which permits unrestricted use, distribution, and reproduction in any medium, provided the original work is properly cited.
INTRODUCTION
Along with the green house gases, atmospheric aerosols also affect the radiative balance of the earth-atmosphere system at local, regional and global scale, therefore acts as the main source of uncertainty in assessing the anthropogenic climate perturbation (IPCC 2007, 2013). The crucial factors in this uncertainty are the highly heterogeneous properties of aerosols over spatial and temporal scale due to type of aerosol sources,
their chemical composition, prevailing meteorological
conditions and transport of aerosols (Ram et al., 2010; 2012;
2015). Therefore a global network of campaign is required for estimating the aerosol optical and microphysical properties
and their effects on weather and climate (Meloni et al., 2005;
Moorthy et al., 2009). Indo-Gangetic plain (IGP) is one of the
densely populated and heavily polluted region in India (Prasad
et al., 2005) with more than 50% population of the country
(Gautam et al., 2011, Tiwari et al., 2015a). Several studies
have been carried out for analyzing aerosols properties and estimation of aerosol radiative forcing at different sites of IGP
(Tiwari et al., 2016; Patel and Kumar, 2015; Srivastava et al.,
2012; Ram et al., 2016).
*Corresponding author: Vikram Mor,
Department of Environmental Science, M.D.U. Rohtak, Haryana-124001
This region exhibits strong seasonal variation in aerosol
particles size and their concentration (Tiwari et al., 2016a;
Tiwari et al., 2016, Sharma et al., 2014; Lodhi et al., 2013).
This region suffers from severe haze, fog and smog problems due to the large population growth and increasing urbanization
(Gautam et al., 2007). During winter season prevailing
meteorological conditions with shallow boundary layer and minimum rainfall also helps in the fog formation over this
region (Kaufman et al., 2002). Over IGP large scale biomass
burning takes place during winter months, which emits large concentration of black carbon (BC) and other aerosols
(Kanawade et al., 2014). During winters high aerosol load
from biomass burning also favors the formation of early morning fog, which turns into production of smog and causes severe reduction in visibility that leads to many problems like road accidents, health problems, delay in air traffic, etc. In the present study, we have analysed the aerosols optical properties like aerosol optical depth (AOD), angstrom exponent (α), single scattering albedo (SSA), asymmetry parameter etc. and their radiative effects during the winter months. This study was focused on the estimation of aerosol radiative forcing, forcing efficiency and heating rate over Rohtak, an urban site in western part of IGP by using the sun/skyradiometer observational data from a period of December-2015 to February-2016.
ISSN: 2230-9926
International Journal of Development Research
Vol. 06, Issue, 08, pp. 9035-9039, August,2016
DEVELOPMENT RESEARCH
Article History:
Received 17th May, 2016
Received in revised form 30th June, 2016
Accepted 19th July, 2016
Published online 30th August, 2016
Key Words:
Measurement site, Instrument and Methodology
The experimental site Rohtak is located in the North-Western part of India (Lat 28.89°N, Long 76.58°E, 214m AMSL) 70 km northwest of Delhi. Like most Indian cities, Rohtak has also a mixed pattern of land use with a population of 0.37 million. The instrument used for aerosol measurements during this study is a Prede POM-02 Sun/sky radiometer located on the roof top of three story building of Maharishi Dayanand University. The instrument can make measurements of both direct and diffuse sky radiances at predefined scattering angles at regular intervals within the spectral range of 340-2200nm. The precision of the in situmethod has been estimated to be in
between 1-2.5% depending on the wavelength (Campanelli et
al., 2004). In this study, the 7 wavelengths data 340, 380, 400,
500, 675, 870, 1020 nm has been used to retrieve aerosol
optical properties. The SKYRAD.pack software (Nakajima et
al., 1996) version 4.2 is used to process the radiance
measurements to retrieve the aerosol optical depth, angstrom exponent, single scattering albedo, refractive index and asymmetry parameters. In the present study data from December 2015 to February 2016 is used to retrieveaerosol optical properties over Rohtak. In situ calibration constant can be estimeted using the improved Langley plot technique
(Campanelli et al., 2004).
Aerosol radiative forcing was estimated using Santa Barbara DISORT Atomspheric Radiative Transfer (SBDART) model, which has been developed by the atmospheric community
(Ricchiazzi et al., 1998). The main input data for the model
consists of the solar zenith angle or a particular date, time, latitude and longitude to calculate the solar zenith angle; the spectrum range of fluxes; atmospheric profile; the
concentration of trace gases (CO2, CH4 and N2O); surface
albedo; aerosols parameters (AOD, SSA and ASY). Based on the weather conditions tropical model profile of atmospheric parameters (e.g. temperature, pressure, ozone etc.) was used in SBDART to derive the net flux in the spectral range of 0.3-4µm at the surface, at top of the atmosphere and in the atmosphere. Diurnal average aerosol DRF was estimated by computing the difference between the net radiative fluxes (downward-upward) with aerosols and without aerosols. Uncertainity in the estimation of radiative forcing due to deviation in simulation was found to be in the range of
10-15% (Ricchiazzi et al., 1998). The difference between the
surface and TOA forcing gives the net atmospheric forcing. Aerosol optical and physical properties have a significant effect on aerosol radiative forcing which can influence the radiative balance over the region.
RESULTS AND DISCUSSION
AOD and Angstrom exponent
AOD is one of the crucial parameters to understand the aerosol loading in the atmosphere. Spectral variation of monthly average AOD shown in Figure 1 for winter season (December, January and February). Monthly variation in spectral pattern of AOD was observed during all months, with highest value of AOD in January and lowest value during December at all wavelengths as expected from the Mie theory. The similar trend of decreasing AOD with increasing wavelength was also
observed by Mishra et al. (2013) and Balarabe et al. (2016).
This indicates that dominant aerosol during this season are more influential scattered at shorter wavelength range as
compared to longer wavelength range (Nwafor et al., 2007).
From this it is also evident that AOD shows relatively strong spectral dependence at shorter wavelength with steeper slope as compared to the longer wavelength with gentle slope.
Srivastava et al. (2012) also observed the similar pattern over
[image:2.595.312.554.159.483.2]Delhi.
Fig. 1. Monthly spectral variation of AOD
Fig. 2. Scatter plot of Alpha as a function of AOD500
The monthly mean AOD at 500 nm were found to be 0.44±0.23, 0.80±0.37 and 0.57±0.34 for December, January and February, respectively with seasonal average of 0.63±0.36. The seasonal mean AOD at 500 nm is comparable to that
observed by Singh et al. (2004) and Kaskautis et al. (2012)
over Kanpur while it is much lower than that observed over
Delhi (Lodhi et al., 2013). The AOD during this season was
mainly associated with fine mode aerosol particles produced from fossil fuel and biomass burning activities (Dey and Tripathi, 2008). Alpha represents the particle size distribution of aerosols while the AOD represents the aerosol loading in the atmosphere therefore AOD-Alpha scatter plot gives qualitative indication about the aerosol load due to different size particles. Figure 2 shows AOD-Alpha scatter plot for study period. From this it is clearly evident that predominantly alpha ranged from 0.8-1.4 which indicates the relatively more contribution of fine mode particles to the aerosol loading over the station during winter time. Lower boundary layer also contributes to higher AOD over station during winter
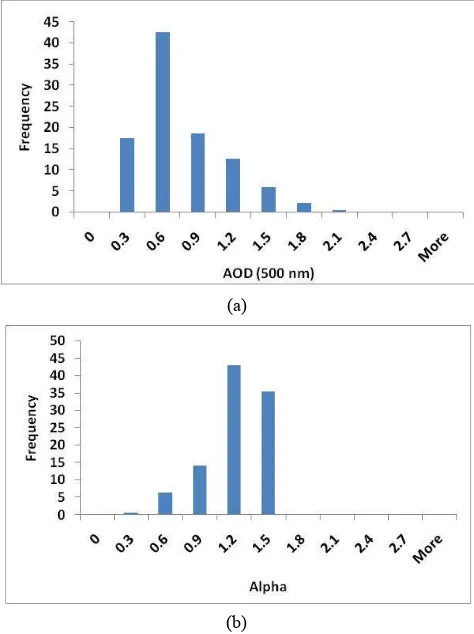
(Kaskoutis et al., 2009). Figure 3a and 3b shows the frequency
respectively. Frequency distribution of AOD (500 nm) shows that ~60% of AOD varied between 0.0-0.6 and only ~20% AOD was found higher than 1.0. Approximately 80% of the Alpha values varied in the range of 1.0-1.5 which clearly indicates the dominance of fine mode aerosol associated with
anthropogenic activities (Venkataraman et al., 2005;
Pandithurai et al., 2007).
(a)
[image:3.595.318.553.48.218.2](b)
Fig. 3. Frequency distribution of AOD500 (a) and Alpha (b)
Single scattering albedo (SSA)
SSA is the common and fundamental parameter for measuring the relative contribution of absorption to extinction and it plays crucial role in assessing the climatic effects of aerosols
(Dubovik et al., 2002). It varies from 0 to 1 depending on the
ratio of absorbing to scattering type aerosols. When the extinction is caused only by absorption than it is 0 whereas if the extinction is caused only by scattering than it is 1. Monthly spectral variability of SSA depicted in Figure 4. It clearly shows increasing trend with increasing wavelength except a slight decrease at 1020 nm with higher value during December. Lower SSA at shorter wavelength indicates the dominance of absorbing type fine mode aerosols. SSA does not show significant monthly variation during different entire study period. The average SSA at 500 nm for this season was 0.94 which is much higher than the SSA observed over Delhi
for winter 2004 by Ganguly et al. (2006). Lower SSA values
over Rohtak as compared to Delhi indicates the less pollution.
Variation in volume size distribution
[image:3.595.44.281.143.460.2]Aerosol volume size distribution is a crucial parameter for understanding the climatic effects of aerosol.
Fig. 4. Monthly variation in spectral distribution of SSA
[image:3.595.317.547.246.415.2]
Fig. 5. Monthly variability in volume size distribution
Generally the aerosol exhibits bimodal size distribution worldwide, with fine mode <0.6 µm and coarse mode with
>0.6 µm particles size (Dubovik et al., 2002). The aerosol
volume size distribution was retrieved from the skyradiometer using 20 radius size bins in the range of 0.01 to 16.54 µm. Monthly variation in aerosol size distribution was illustrated in the Figure 5. From figure it is evident that size distribution exhibits bimodal distribution with dominant accumulation/fine mode around 0.17 µm and coarse mode is dominant around 11 µm. Generally the low volume of fine mode aerosol was found as compared to coarse mode aerosol during all seasons but during winter there is not much difference between fine mode and coarse mode volume. The high volume of accumulation mode aerosols is attributed with the hygroscopic growth of
particles (Alam et al., 2010; Tripathi et al., 2005; Singh et al.,
2004). Similar results of higher fine mode aerosol during
winter was observed by Alam et al. (2012) over Karachi.
Higher volume of fine mode aerosol was found during January than February and March. January is the coldest month of winter over northern India, therefore higher biomass and fuel burning for heating purposes contributes to the higher volume of fine mode aerosol.
Radiative forcing and heating rates
aerosols (Singh et al., 2005). The difference between the radiative forcing at TOA and at the surface gives the atmospheric radiative forcing. SBDART compute plane parallel radiative transfer in clear and cloudy conditions which is widely used for the radiative transfer calculations. For December, January and February average TOA, at the surface and the atmospheric forcing was illustrated in Figure 6. The estimated monthly average ARF at the surface is 20, 34 and
-27 Wm2 for December, January and February, respectively.
TOA forcing for December, January and February is 13, 20
-16 Wm2, respectively. Both TOA and surface forcing have
negative sign for all three months. The atmospheric forcing
values are +7, +14 and +12 Wm2 for December, January and
[image:4.595.40.290.237.388.2]February respectively. Relatively higher value of ARF is observed for January.
Fig. 6. Monthly variation in aerosol radiative forcing
Another important aspect is atmospheric heating rate due to aerosol radiative forcing, which can be calculated by following Liou (2002) as
where ∂T/∂t is the heating rate (K day 1), g is the acceleration
due to gravity, Cp the specific heat capacity of the air, ΔF is
the atmospheric ARF and ΔP is the atmospheric pressure
difference between the surface and 3 km (300 hPa). The monthly mean atmospheric heating rate for December, January
and February is 0.18, 0.37 and 0.33 K day 1, respectively
which exhibits a similar pattern as atmospheric radiative forcing. This indicates the dependence of atmospheric heating rate on the chemical characteristics and concentration of aerosols during different months. Higher heating rate during January attributed to the higher black carbon concentration due to biomass burning and anthropogenic activities.
Conclusions
The present study analyzed aerosol optical and radiative properties over Rohtak during winter season. Aerosols optical and physical properties shows significant monthly variability. AOD exhibits strong spectral dependence with decreasing trends from 340 nm to 1020 nm during all three months. Higher value of AOD was observed during January at all wavelengths indicates the higher aerosol loading associated with anthropogenic activities. The monthly mean AODs at 500 nm were 0.44±0.23, 0.80±0.37 and 0.57±0.34 for December,
January and February, respectively. Higher values of Alpha around 80% ranged between 1.0-1.5 which clearly indicates the dominance of fine mode aerosol. Volume size distribution exhibits bimodal distribution with fine mode around 0.17 µm and coarse mode around 11 µm. The monthly mean
atmospheric forcing values are +7, +14 and +12 Wm2 for
December, January and February, respectively. Similar pattern of mean atmospheric heating rate was observed with values of
0.18, 0.37 and 0.33 K day 1 during December, January and
February, respectively.
Acknowledgement
Authors are thankful to the Director General of Meteorology and Head (EMRC), Indian Meteorological Department, New Delhi and Head Department of Environmental Sciences, Maharshi Dayanand University, Rohtak for support and providing all types of facilities and data to carry out the research work.
REFERENCES
Balarabe, M., Abdullah, K. and Nawawi, M. 2016. Seasonal Variations of Aerosol Optical Properties and Identification of Different Aerosol Types Based on AERONET Data over Sub-Sahara West-Africa. Atmospheric and Climate
Sciences, 6, pp. 13-28. http://dx.doi.org/10.4236/
acs.2016.61002
Campanelli, M., Nakajima, T. and Olivieri, B. 2004. Determination of the solar calibration constant for a sun-sky radiometer: Proposal of an in-situ procedure. Appl. Opt., 43, pp. 651–659.
Dey, S. and Tripathi, SN. 2008. Aerosol direct radiative effects over Kanpur in the Indo-Gangetic basin, northern India: Long-term (2001–2005) observations and implications to
regional climate, J. Geophys. Res. 113, D04212,
doi:10.1029/2007JD009029.
Dubovik, O., Holben, B.N., Eck, T., Smirnov, F.A., Kaufman,
Y.J., et al. 2002. Variability of absorption and optical
properties of key aerosol types observed in worldwide
locations. J. Atmos. Sci. 59, pp. 590–608.
Ganguly, D., Jayaraman, A. and Gadhavi H. 2006. Physical and optical properties of aerosols over an urban location in western India: Seasonal variabilities, J. Geophys. Res., 111, D24206, doi:10.1029/2006JD007392.
Gautam, R., et al. 2011. Accumulation of aerosols over the
Indo-Gangetic plains and southern slopes of the Himalayas: Distribution, properties and radiative effects
during the 2009 pre-monsoon season, Atmos. Chem. Phys.,
11, pp. 12841–12863.
Gautam, R., Hsu, N. C., Kafatos, M. and Tsay, S. C. 2007. Influences of winter haze on fog/low cloud over the
Indo-Gangetic plains, J. Geophys. Res., 112, D05207,
doi:10.1029/2005JD007036.
IPCC: Climate Change 2007. The Physical Science Basis, edited by: Solomon, S., Qin, D., Manning, M., Marquis, M., Averyt, K., Tignor, M. M. B., Miller, H. L., and Chen, Z., Cambridge University Press, Cambridge, UK, 996. IPCC: Climate Change, 2013. The Physical Science Basis:
Summary for Policymakers, Cambridge, UK.
characteristics at an urban location, Kanpur, in the
Indo-Gangetic Plain. Atmos. Res. 147 148, pp.
121 132.10.1016/j.atmosres.2014.05.010
Kaskaoutis, D. G., et al. 2012. Influence of anomalous dry
conditions on aerosols over India: Transport, distribution
and properties, J. Geophys. Res., 117, D09106,
doi:10.1029/2011JD017314.
Kaskaoutis, D.G., Badarinath, K.V.S., Kharol, S.K., Sharma, A.R. and Kambezidis, H.D. 2009. Variations in the Aerosol Optical Properties and Types over the Tropical
Urban Site of Hyderabad, India. J. Geophys. Res.
114:D22204, doi: 10.1029/2009JD012423.
Kaufman, Y., Tanre, D. and Boucher, O. 2002. A Satellite
View of Aerosols in the Climate System. Nature419: 215–
223.
Liou, K.N. 2002. An Introduction to atmospheric radiation. Elsevier, New York, 583.
Lodhi, N.K., Beegum, S.N., Singh, S. 2013. Aerosol Climatology at Delhi in the Western Indo-Gangetic Plain:
Microphysics, Long-term Trends, and Source Strengths. J.
Geophys. Res. 118.
Meloni, D., Sarra, A. D., Iotio, T. D. and Fiocco G. 2005. Influence of the vertical profile of Saharan dust on the
visible direct radiative forcing, J. Quant. Spectrosc. Radiat.
Transfer, 93, pp. 397–413, doi:10.1016/j.jqsrt. 2004.08.035
Mishra, A. K., Srivastava, A. and Jain V.K. 2013. Spectral Dependency of Aerosol Optical Depth and Derived Aerosol Size Distribution over Delhi: An Implication to
Pollution Source. Sustainable Environ. Res. 23,
pp.113-128.
Moorthy, K. K., Nair, V. S., Babu, S. S. and Satheesh S. K. 2009. Spatial and vertical heterogeneities in aerosol properties over oceanic regions around India: Implications
for radiative forcing, Q. J. Roy. Meteorol. Soc., 135, pp.
2131–2145, doi:10.1002/qj.525.
Nakajima, T., Tonna, G., Rao, R. 1996. Use of sky brightness measurements from ground for remote sensing of
particulate polydispersions. Appl. Optics. 35, pp. 2672–
2686.
Nwafor, O.K., Chineke, T.C. and Pinker, R.T. 2007. Seasonal Characteristics of Aerosol Optical Properties at a Sub-Sahara Site. Atmospheric Research, 85, pp. 38-51. http://dx.doi.org/10.1016/j.atmosres.2006.11.002
Pandithurai, G., Pinker, R. T., Devara, P. C. S., Takamura, T. and Dani K. K. 2007. Seasonal asymmetry in diurnal variation of aerosol optical characteristics over Pune,
western India Journal of Geophysical Research, 112,
D08208, doi:10.1029/2006JD007803.
Patel, P. and Shukla, A. K. 2015. Aerosol optical properties over marine and continental sites of India during
pre-monsoon season. Current science, 108,(4) 66625.
Prasad, A. K., Singh, R. P., Singh, A. and Kafatos M. 2005. Seasonal variability of aerosol optical depth over Indian subcontinent, International Workshop on the Analysis on Multi-Temporal Remote Sensing Images pp. 35–38. Ram, K. and Sarin, M.M. 2010. Spatio-temporal variability in
atmospheric abundances of EC, OC and WSOC over
northern India. J. Aerosol Sci. 41, pp. 88–98.
Ram, K. and Sarin, M.M. 2012. Carbonaceous aerosols over Northern India: sources and spatio-temporal variability.
Proc. Indian Natl. Sci. Acad. 78, 523–533.
Ram, K., and Sarin, M.M. 2015. Atmospheric carbonaceous aerosols from Indo-Gangetic Plain and Central Himalaya:
impact of anthropogenic sources. J. Environ. Manag. 148,
pp. 153–163.
Ram, K., Singh, S., Sarin, M.M., Srivastava, A.K. 2016. Tripathi SN Variability in aerosol optical properties over an urban site, Kanpur, in the Indo-Gangetic Plain: A case
study of haze and dust events. Atmospheric Research 174–
175 pp. 52–61
Ricchiazzi, P., Yang, S., Gautier, C., et al. 1998. SBDART: A
research and teaching software tool for plane-parallel
radiative transfer in the earth's atmosphere. Bull. Am.
Meteorol. Soc. 79. pp.2101–2114.
Sharma, M., Kaskaoutis, D.G., Singh, R.P., et al. 2014.
Seasonal Variability of Atmospheric Aerosol Parameters over Greater Noida Using Ground Sunphotometer Observations. Aerosol and Air Quality Research, 14, pp. 608-622, doi: 10.4209/aaqr.2013.06.0219
Singh, R.P., Dey, S., Tripathi, S.N., et al. 2004. Variability of
aerosol parameters over Kanpur city, northern India. J.
Geophys. Res. 109:D23206.
Singh, R.P., Dey, S., Tripathi, S.N., Tare, V., Holben, B.N. 2004. Variability of aerosol parameters over Kanpur city,
northern India. J. Geophys. Res. http://
dx.doi.org/10.1029/2004JD004966.
Singh, S., Nath, S., Kohli, R., et al. 2005. Aerosols over Delhi
during premonsoon months: Characteristics and effects on
surface radiation forcing. Geophys. Res. Lett. 32:L13808.
Singh, S., Nath, S., Kohli, R., Singh, R. 2005. Aerosols over Delhi during premonsoon months: characteristics and effects on surface radiation forcing. Geophys. Res. Lett. 32, L13808. http://dx.doi.org/10.1029/ 2005GL023062. Srivnastava, A. K., Tripathi, S. N., Dey, S., Kanawade, V. P.
and Tiwari S. 2012. Inferring aerosol types over the Indo-Gangetic Basin from ground based sun photometer
measurements, Atmos. Res., 109–110, pp. 64–75.
Tiwari, S., Dumka, U.C., Kaskaoutis, D.G., Ram, K., Panicker, A.S., Srivastava, M.K., Tiwari, S., Attri, S.D., Soni, V.K., Pandey, A. K. 2016a.. Aerosol chemical characterization and role of carbonaceous aerosol on radiative effect over Varanasi in central Indo-Gangetic
Plain.Atmospheric Environment 125, pp. 437-449.
Tiwari, S., Pandithurai, G., Attri. S.D., et al. 2015. Aerosol
optical properties and their relationship with
meteorological parameters during wintertime in Delhi,
India. Atmospheric Research 153, pp. 465–479.
Tiwari, S., Tiwari, S., Hopke, P.K., et al. 2016. Variability in
optical properties of atmospheric aerosols and their frequency distribution over a mega city "New Delhi,"
India. Environ Sci Pollut Res Int. 23(9), pp. 8781-93. doi:
10.1007/s11356-016-6060-3.
Tripathi, S. N., Dey, S., Tare, V., Satheesh, S. K. 2005. Aerosol black carbon radiative forcing at an industrial city
in northern India. Geophys. Res. Lett. 32.
http://dx.doi.org/10.1029/2005GLO22515.
Venkataraman, C., Habib, G., Eiguren-Fernandez, A., Miguel, A.H., Friedlander, S.K. 2005. Residential biofuels in South Asia: carbonaceous aerosol emissions and climate impacts.
Science 307, pp. 1454–1456.