1701
AN EMPIRICAL STUDY ON THE EFFECT OF BUNDLING
SERVICE ON USER ACCEPTANCE OF IOT SERVICES
1SAE-BOM LEE, 2WON-HEE LEE
1Research Professor, Kyung Hee University, Humanitas Big Data Research Center, South Korea
2Kyung Nam College of Information and Technology, Subdivision of Business Administration, South
Korea
E-mail: 1[email protected], 2[email protected]
ABSTRACT
Recently, product using Internet of Things (IoT) have appeared. However, IoT products are not popular yet. This study aims to research the intention of using IoT products. The purpose of this study is to investigate the effect the characteristic of internet of things and the bundling service of mobile provider on the acceptance of IoT products. The bundled service means that the mobile provider offers two or more services such as internet service + TV + regular phone + smart phone. Therefore, this study establishes hypothesis and research model that the bundling (bundled service, bundled fee), service stability, compatibility is set as independent variables, and the perceived ease of use, and perceived usefulness are used as parameters, and the intention to use is used as a dependent variable. To test the hypothesis, we analyze the structural equation model using AMOS 20.0. As a result, three of the hypotheses are rejected. Stability is not statistically significant for perceived ease of use and perceived usefulness, and the loyalty of mobile provider is not affect perceived usefulness. This study will provide implications for the IoT service market and business.
Keywords: Internet of Things, Bundle service, Intention to use, Loyalty of Mobile Provider, Technology
Acceptance Model
1. INTRODUCTION
People, things, and everything are moving toward hyper connected societies through the internet of things (IoT) that form intelligent relationships. The governments of major countries in the world are selecting IoT as a disruptive technology that has an impact on national competitiveness, and they are actively involved in establishing a technology roadmap and implementing related projects of IoT. In addition, global companies such as Google, Samsung, Cisco and IBM are focusing on the IoT as a new growth engine.
By 2020, the world’s IoT market will grow at a CAGR of 28.8% and the Korea domestic IoT market will grow at a CAGR of 38.5%. Promising business of IoT are Smart Home, Smart City, and Connected Car [1].
Despite the spread of smartphone, the global telecom market is stagnant due to slowdown in demand for service. In Korea, telecom companies are moving into the smart home market by paying
attention to the IoT as the next generation profitable industry. They are trying to integrate home IoT into application that manage the home appliance or devices that can control appliances with voice commands. For example, LG U+ is focusing on expanding the Home IoT platform and ‘IoT@home’ service was commercialized in earnest. It is a service that allows consumers to control from anywhere their home appliances, as well as gas locks front doors, and other things in the home by connecting on the internet. However, consumers’ perception is still low.
1702 Unlike the new business opportunity, the prior research on the IoT are focused on technology and industry. There are insufficient researches related services and business of IoT.
The purpose of this paper is to investigate the influencing factors on intention to use of IoT service through Technology Acceptance Model (TAM) for tele-communication service consumers such as smartphone and internet users. Also, this study focuses on bundled products offered by mobile telecom companies.
2. LITERATURE REVIEW
2.1 Internet of Things
[image:2.612.313.529.385.512.2]The term Internet of Things (IoT) was first used by Kevin Ashton in 1999 to view intelligence of things through RFID and other sensors [3]. In 2005, International Telecommunication Union (ITU) suggested that the internet will change dramatically due to technological innovations which forms a dynamic network that “Available anywhere, anytime, by anything and anyone. [4]” Also, IEEE described the IoT as [5]: “A network of items-each embedded with sensors-which are connected to the internet.” Brown [6] defined IoT as: the inter-networking of physical devices, vehicles, buildings, and other items embedded with electronics, software, sensors, actuators, and network connectivity which enable these objects to collect and exchange data.”
Figure 1: ITU definition of IoT[4]
IoT technology can be used in various industries such as agriculture, food processing industry, environmental monitoring, security surveillance, and others [7]. Especially, the prominent industry is smart home.
[image:2.612.95.291.491.633.2]Korea telecom companies are looking for sales opportunities through different internet strategies, and their business models and their points of interest are different. SKT launched “Smart Home”, a brand of IoT. This is not only a charge for end users through the IoT platform, but also the ultimate business model is the Big Data business. In other words, SKT sells information which is accumulate data by consumers using smart home service to consumer electronic companies for generating revenue. Meanwhile, LGU+ provides smart devices. Through ‘IoT@home’, they directly appeal to consumers, provide terminals, install and support A/S. On the other hand, KT started first in the smart home business, concentrating on enterprise platform such as telematics, and is now expanding into home platform service. The following table 1 compares IoT home services of telecom companies in Korea. Therefore, this study investigates the acceptance of IoT products, when IoT products were released as bundled products of telecom companies.
Table 1: Home IoT Service of telecom companies in Korea
SKT LGU+ KT
composition of commodities
Boiler, dehumidifier,
air cleaner, air conditioner,
bed etc. Household appliances/fur
niture
Switches, plugs, thermostats
, door locks, etc.
Home Fitness / Homemaker
Configuration
of Home IoT Wi-Fi
Z-wave based IoT hub dongle
IPTV connection
Current researches have examined the technical issues of IoT technology, definition of IoT, and conceptual framework of IoT technology as shown in the table 2 below. There are few researches on acceptance of IoT service and products from the perspective of individual consumers. This study aims to identify and test the factors that determine the consumer acceptance of IoT service. It is expected that it will contribute to solve the lack of empirical research and practical relevance.
Table 2: Prior Research of IoT
Authors Research contents Research Type
Atzori et
al.[8] Understating of IoT paradigm
Review article Medaglia
and Serbanati,[9]
The security and privacy issues as the major challenges
for IoT application
[image:2.612.316.521.662.738.2]1703 Uckelmann
et al. [10] Architectural approach of future IoT Guideline
Gao and Bai, [11]
Acceptance of IoT technology(electronic toll collection) based on TAM
Empirical study
Patil, [12]
Identify variables to the acceptance of IoT by retail employees and retail stores
Empirical study
2.2 Security
The security of IoT involves three things that can be done for private and confidential user data: confidentiality, integrity, and access [13]. ITU suggested devices, networks and applications as general security requirements of IoT [4]. Kim [14] discussed the four types of IoT security threats: device unauthorized access, loss and physical destruction, information leakage, data falsification and tampering, and denial of service. Three important factors in IoT adoption are environment, organization and security dimensions [15]. Cha [16] verified that service security affects positively on the perceived ease of use for public safety services using the IoT. In this study, security is defined as the safety for personal information hacking or and stability for physical and technical stability when using the IoT service [17] and the hypothesis is as follows.
H1-1: Security of IoT Service will have a positive effect on the perceived ease of use.
H1-2: Security of IoT Service will have a positive effect on the perceived usefulness.
2.3 Compatibility
In technology innovation, compatibility can be divided into two meanings. Frist, it is the compatibility proposed by Rogers [18]. It means the extent to which innovation technology is compatible with existing experience, habits, beliefs and work practices. Second, the compatibility of Fusfeld [19] implies the extent to which an elemental technology is compatible with another elemental technology within a larger system scope.
This study focuses on the compatibility of Fusfeld [19]. In other words, it means whether or not the IoT service and system are compatible between PCs and mobile devices providing technical support. Compatibility is important because home IoT services must be able to operate anywhere on a smartphone. Prior researchers have found that compatibility in using mobile services positively affects users’ perceived ease of use and
perceived usefulness [20]. The hypothesis is as follows.
H2-1: Compatibility of IoT Service will have a positive effect on the perceived ease of use.
H1-2: Compatibility of IoT Service will have a positive effect on the perceived usefulness.
2.4 Expected Bundling Service and Fee
Bundling is a marketing activity in which two or more products or services are bundled together [21]. Also, bundling is that selling two or more products or services at one price and the act of selling a plurality of goods or services which can be sold separately [22].
Telecom companies are selling bundled products. Bundled products means that combine various communication services such as internet, telephone, etc. in package form, and if you use a bundled product, consumers can receive additional discount. Each company has a different tendency to release their products, but in general, consumers can enjoy various benefits such as unlimited viewing of movies and dramas, saving money on monthly fee.
Bundling research in the field of tele-communication has been focused on economic effects, appropriate price and regulation through the combination of telecommunication services such as TPS (triple play service), QPS (quadruple play service), landline, high-speed internet, IPTV and mobile phone [23]. As the positive effects on the adoption and diffusion of the new technology for mobile phone bundling, instead of providing users with low-priced mobile phone they have introduced mandatory terms and conditions, thereby promoting technological acceptance and confidence [24]. Park et al [25] set the expected value as a service and cost factor by using communication bundled service and verify the intention of continuous use of bundled service.
In this study, consumers’ intention to use IoT service will increase when IoT products and services are bundled with existing mobile communication services. Consumers can easily pay IoT usage fee which is combined with other telecom service with automatic transfer or affiliate card. In addition, they can easily access IoT service counselling and A/S services through call center of telecom companies.
1704 including the IoT. Bundling fee is the expectation reasonable charge that combines IoT service and other telecom service. The following hypotheses were established based on previous research.
H3-1: Expected bundling service will have a positive effect on the perceived ease of use.
H3-2: Expected bundling service will have a positive effect on the perceived usefulness.
H4-1: Expected bundling fee will have a positive effect on the perceived ease of use.
H4-2: Expected bundling fee will have a positive effect on the perceived usefulness.
2.5 Loyalty to Telecom Company
Loyalty to telecom companies represents the referral, preference, and willingness to the current telecom company. The existing loyalty research used loyalty as a dependent variable [Kim et al. 2004]. However, this study used it as an independent variable. Previous researchers found that the higher the satisfaction and loyalty of the existing service and IT to the lower intention to switch [26]. Therefore, it is assumed that the loyalty to the telecom company is higher, the acceptance of new IoT services provided by the telecom company is increased.
H4-1: Loyalty to Telecom Company will have a positive effect on the perceived ease of use.
H4-2: Loyalty to Telecom Company will have a positive effect on the perceived usefulness.
2.6 Technology Acceptance Model
Technology Acceptance Model (TAM) proposed by Davis in 1989 [27], which was widely adopted because it could be easily used to explain an individual’s IT acceptance. The basic theory of TAM proposed that perceived ease of use and perceived usefulness influence an individual’s intention to use IT. Perceived usefulness is defined as the degree to which one believes that using the technology will enhance his/her performance. Perceived ease of use refers to the degree to which one believes that using the technology will be free of effort [27]. A variety of models have been developed to explain innovation usage in the IT literature.
TAM research related to latest technology including adoption of wearable devices [28], Public safety IoT service [16], and Chinese consumers’ acceptance of electronic toll collection using IoT technology [11]. Based on the previous research of TAM, hypotheses are as follows.
H6: Perceived ease of use will have a positive effect on the perceived usefulness.
H7: Perceived ease of use will have a positive effect on intention to use.
H8: Perceived usefulness will have a positive effect on intention to use.
3. RESEARCH MODEL AND METHOD
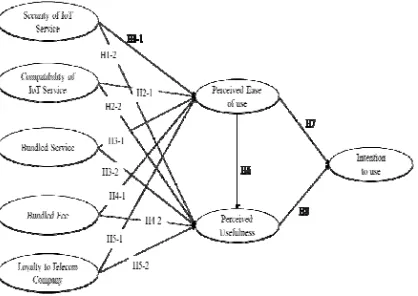
[image:4.612.315.524.394.542.2]This research model, based on TAM, is depicted in Figure 2. The determinants of intention to use IoT service are perceived ease of use, perceived usefulness. Also, security, compatibility, expected bundling service, bundled fee, and loyalty to Telecom Company are influence on perceived ease of use and perceived usefulness.
Figure 2: Research Model
3.1 Measurement
1705 information. Compatibility by Three items (COM1-3). These items identify that IoT is compatible with other element technologies. Bundling service by four items (BS 1-4), which examine the expectation for bundled services including IoT service. Bundling Fee is measured by four items (BF 1-4), which capture expectation for bundled rates including IoT service. Loyalty to company by three items (LOY 1-3). These items identify that preference and continuous use to existing Telecom Company. Perceived ease of use by three items (PE 1-3), which can use without any difficulty in accepting IoT service. Perceived usefulness by four items (PU 1-4), which IoT service acceptance is considered effective in life. Intention to use by four items (USE 1-4). These items indicate the degree to which consumer want to adopt IoT service.
Table 3: Profile of Sample
Frequency Percent
Gender Male 185 54.4
Female 155 45.6
Age
10s 1 .3
20s 171 50.3
30s 53 15.6
40s 72 21.2
50s 39 11.5
60s 4 1.2
Occupation
Student 143 42.1 employee 120 35.3 Profession 27 7.9 Self-employed 24 7.1
Etc 26 7.6
Using of Telecom Company
SKT 173 50.9
KT 111 32.6
LGU+ 52 15.3
Ect. 4 1.2
Total 340 100.0
3.2 Data Collection
The main data were collected from consumers of smartphone service in Korea. We received responses from 375 questionnaires. After dropping respondents because of useless data, we used data from 340 respondents for our study.
The demographics indicated that there were more male (54.4%) than female (45.6%) respondents. The respondents were in their 20s (50.3%), 30s (15.6%), 40s (21.2%) and 50s (11.5%). Most were students (42.1%) and employees (35.3%). The
descriptive statistics of the sample data are shown in Table 3.
4. RESULTS
[image:5.612.306.508.185.581.2]4.1 Measurement Model
Table 4: Confirmatory Factor Analysis Results
Items Estimate CR AVE Cronbach’s Alpha
SEC1 0.861
0.937 0.787 0.910 SEC2 0.867
SEC3 0.914 SEC4 0.905 COM1 0.937
0.957 0.881 0.932 COM2 0.957
COM3 0.922
BS1 0.843
0.916 0.733 0.879 BS2 0.878
BS3 0.860 BS4 0.842 BF1 0.773
0.883 0.654 0.824 BF2 0.816
BF3 0.848 BF4 0.796 LOY1 0.884
0.925 0.804 0.879 LOY2 0.923
LOY3 0.884 PE1 0.891
0.900 0.818 0.779 PE2 0.917
PU1 0.895
0.930 0.769 0.899 PU2 0.913
PU3 0.897
PU4 0.799 USE1 0.892
0.950 0.825 0.929 USE2 0.900
USE3 0.922 USE4 0.918
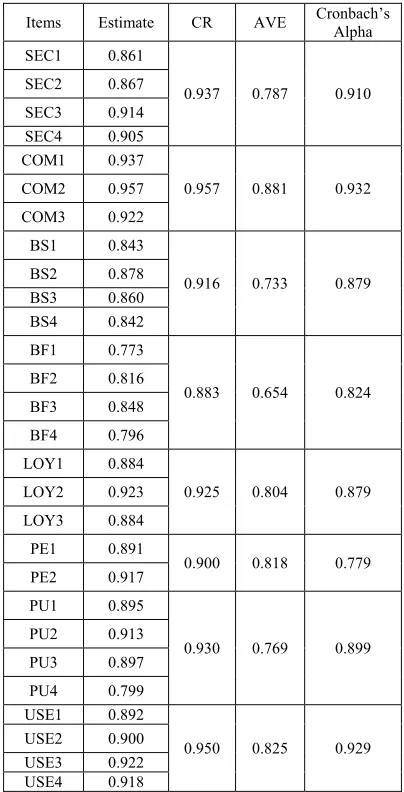
1706 respective construct was significant (p<0.05), and all loadings ranged from 0.773 to 0.957. Composite reliability (CR) and the average variance extracted (AVE) in final model were over 0.883 and over 0.654 as shown in Table 4. Additionally, the Cronbach’s alpha value for each of our construct exceeded 0.70, assuring internal consistency of our measurement scales.
[image:6.612.314.524.81.256.2]To test for discriminant validity, we checked whether the square root of AVE for each construct exceeded the correlations between that and all other consturcts [29]. Table 5 indicates that the AVE square root of a latent variable is larger than the correlation of other latent variables. The correlation among all consturucts are well below 0.70, suggesting that all construcus are distinct from one another.
Table 5: The Results of Discriminant Validity
SEC COM BS BF LOY PE PU USE
SEC 0.887
COM 0.522 0.939
BS 0.272 0.380 0.856
BF 0.532 0.544 0.404 0.809
LOY 0.070 0.019 0.258 0.178 0.897
PE 0.261 0.340 0.406 0.400 0.299 0.904
PU 0.311 0.458 0.461 0.473 0.225 0.572 0.877
USE 0.174 0.292 0.451 0.334 0.240 0.519 0.631 0.908
4.2 Structural Model
The structural model estimation and research hypotheses tests were performed using partial least squares (PLS) method. The result of our analysis on the structural model is presented in Figure 3 and Table 6. PLS is a component-based structural equation modeling technique. It is similar to regression but simultaneously modles paths among variables. It is relatively free from theoretical assumption and prerequisite, such as being less constrained on the type of measurement index or sample size. This method is more focused on analyzing the explanatory power of the predictive variables than the suitability of the model [30]. PLS is useful in screening out negligible factors affecting the dependent variable [31].
[image:6.612.314.520.299.533.2]Figure 3: The Results of Research Model
Table 6: The Results of Hypotheses
Hypotheses Estimate Statistics T P-value
H1-1 SEC -> PE 0.024 0.190246 0.849
H1-2 SEC -> PU -0.018 0.333765 0.739
H2-1 COM -> PE 0.253 2.405698 0.017
H2-2 COM -> PU 0.161 3.529004 0.000
H3-1 BS -> PE 0.367 3.782082 0.000
H3-2 BS -> PU 0.138 3.293886 0.001
H4-1 BF -> PE 0.338 3.393218 0.001
H4-2 BF -> PU 0.130 2.736313 0.007
H5-1 LOY -> PE 0.265 3.588187 0.000
H5-2 LOY -> PU 0.026 0.898037 0.370
H6 PE -> PU 0.177 6.217674 0.000
H7 PE -> INT 0.128 3.904832 0.000
H8 PU -> INT 0.562 8.358284 0.000
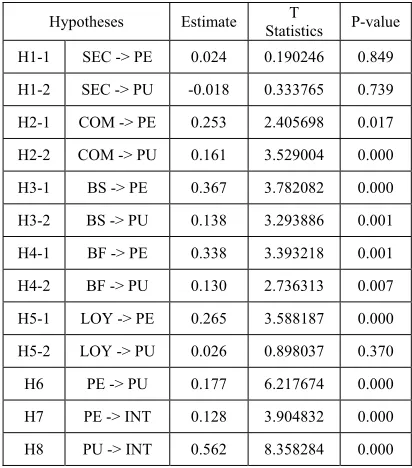
As shown in Figure 3, all of the paths in the research model are significant and positive except three paths such as H1-1, H1-2 and H5-2. Security had a not significantly effect on perceived ease of use (β=0.024; p<0.849), rejecting H1-1 and also security had a not significant on perceived usefulness (β=-0.018; p<0.739), rejecting H1-2.
[image:6.612.83.305.314.460.2]1707 p<0.000), supporting H5-1. However, Loyalth had a not significant impact on perceived usefulness (β=0.026; p<0.370), rejecting H5-2. Furthermore, perceived ease of use had a significant effect on perceived usefulness (β=0.177; p<0.000) and intention to use (β=0.128; p<0.000), supporting H6 and H7. Perceived usefulness had a significant positive effect on intention to use (β=0.562; p<0.000).
5. DISCUSSION
This study applied the variables used in the IoT characteristics and bundling theory to the existing TAM in order to derive the factors influencing the acceptance of IoT service based on telecom service consumers. The results of the empirical analysis are summarized as follows.
First, security has not statistically significant on perceived ease of use and perceived usefulness. System quality is important in using information systems, but it seems that the hypothesis has been rejected due to lack of consumer awareness of IoT service security.
Second, we confirmed that compatibility affects positively perceived ease of use and perceived usefulness. The results are the same as those of the previous research [20]. In particular, compatibility has a greater impact on perceived ease of use than perceived usefulness. This seems that the more likely easy to use IoT service as their smartphone become more compatible with IoT service.
Third, we found that the expected bundling service positively affects perceived ease of use and perceived usefulness. This suggests that it is necessary to combine individually services in the past because bundling service provide convenience for additional services such as bill payment, A/S service, call center, and etc. Also, bundling service has the biggest effect on perceived ease of use. When bundling IoT services with bundled products, it means that consumers are aware that IoT service is easy to use.
Forth, it was confirmed that the bundling fee affects positively on perceived ease of use and perceived usefulness. Consumers are more likely to prefer bundle fee because bundling can more discount than one product or service when accepting IoT service. Also, consumers seem to think bundling fee is useful.
Fifth, loyalty to using Telecom Company has a positive effect on perceived ease of use, while it has no effect on perceived usefulness. We found that the higher the affection for the existing company, the easier it is to use the IoT service. Consumers do
not use IoT services, so loyalty and usability are considered individual.
Sixth, as previous TAM research, perceived ease of use has a positive effect on perceived usefulness and intention to use, and perceived usefulness influences on intention to use. This implies that the acceptance of IoT should consider perceived ease of use and perceived usefulness like as previous research of acceptance of IT. The effect of perceived usefulness on intention to use was greater that perceived ease of use. Therefore, telecom companies will have to appeal the usefulness of IoT services in order to drive consumers’ acceptance of IoT services.
6. CONCLUSION
The goal of this study was to investigate why consumers accept based on TAM and bundling. We have found that when it comes to compatibility with smartphone and when it is launched as a bundled product, the loyalty to existing companies increases the demand for IoT services. Also, consumers’ awareness of the usefulness of IoT service can effectively increase acceptance.
This study has also several important implications for acceptance of IoT service. Academically, it is significant that the research domain was extended to IoT through TAM which is widely used in IS/IT research. Furthermore, this study has implication that the research of the acceptance of IoT in terms of consumers’ behaviors, rather than research on architectures, frameworks, and technical issues as in previous IoT research. Practically, this study suggests that compatibility with other devices and bundling strategies should be considering for the acceptance and proliferation of IoT service. We found that consumers think that IoT service fee should be cheap or worthy of payment, and they are considering monetary gain through a combination like TPS rather than accepting it as an individual commodity.
1708 service acceptance. Bundling should be appropriate to the new service acceptance intention through more diverse combinations and studies. Finally, this study does not reflect IoT characteristics. Although service security and compatibility are mentioned as examples, but future study should reflect more IoT features and tested empirically.
REFRENCES:
[1]Hyundai Research Institute, “Trends and Implication of IoT Industry”, VIP Report, Vol. 16, No. 24, 2016.07.11.
[2]Accenture, “Industrial Internet of Things: Unleashing the Potential of Connected Products and Services,” World Economic Forum, Jan. 2015.
[3]K. Ashton, “Internet of Things’ Thing”. RFID
Journal, Vol. 22, No. 7, 2009, pp.97-114.
[4]ITU, “Internet Reports 2005: The Internet of Things”, ITU, Nov. 2005.
[5]IEEE, “Towards a Definition of The Internet of Things”, IEEE Internet initiative, May 27, 2015, www.iot.ieee.org
[6]E. Brown, "Who Needs the Internet of Things?" Linux.com. Retrieved 23 October, 2016.
[7]W. Ding. “Study of Smart Warehouse Management System Based on the IOT”, in Du, Z. (Ed.), Intelligence Computation and
Evolutionary Computation, Springer, Berlin,
2013, pp. 203-207.
[8]L. Atzori, A. Iera, and G. Morabito, “The Internet of Things: A Survey”, Computer
Networks, Vol.54, No.15, 2010, pp.2787-2805.
[9]C.M. Medaglia and A. Serbanati, “An Overview of Privacy and Security Issues in the Internet of Things”, in D. Giusto, A. Iera, G. Morabito, and L. Atozori, (Eds), The Internet of Things,
Springer, New York, NY, 2010, pp. 389-395. [10] D. Uckelmann, M. Harrison, and F.
Michahelles, “An Architectural Approach Towards the Future Internet of things”,
Architecting the Internet of Things, Springer,
Berlin, 2011, pp. 1-24.
[11] L. Gao, and X. Bai, “A Unified Perspective on the Factors Influencing Consumer Acceptance of Internet of Things Technology”, Asia Pacific Journal of Marketing
and Logistics, Vol. 26, No. 2 2014, pp. 211 –
231
[12] K. Patil, “Retail Adoption of Internet of Things: Applying TAM Model”, International Conference on Computing, Analytics and
Security Trends (CAST), College of Engineering
Pune, India Dec 19-21, 2016, pp. 404-409. [13] C. Yassine, B. Mohamed and A.
Abdelmalek, “Internet of Things Security”,
IEEE, April 19-20, 2017, Doi: 10.1109/WITS.2017.7934655
[14] J.D. Kim, “The Coming of the Internet of Things Age: Present and Future", Telco Management Research Institute, 2014
[15] C.W. Hsu, and C.C Yeh, “Understanding the factors affecting the adoption of the Internet of Things”, Technology Analysis & Strategic
Management, Vol. 29, No.2, 2017,
pp.1089-1102.
[16] N.J. Cha, “Determinants of Acceptance Intention of Public Safety Services Using Internet of Things”, Master Thesis, Graduate School, Seoul National University, 2015 [17] R. L Hess, S. Ganesan, and N. M. Klein,
“Service Failure and Recovery: the Impact of Relationship Factors on Customer Satisfaction”,
Journal of the Academy of Marketing Science,
Vol.31, No.2, 2003, pp.127-145.
[18] E. M. Rogers, “Diffusion of innovations”. New York: Free Press, Vol.18, No.20, 271. 1983 Diffusion of Innovations, 5ed. New York: The Free Press. 2003
[19] A. R. Fusfeld. “How to Put Technology Into Corporate-Planning”, Technology Review, Vol. 80, No.6, 1978, pp. 51-55.
[20] Y.S. Cha, and M.S. Jung, “The Impact of Ubiquitous Factors on Intention to Use Mobile Services”, Journal of Information Systems, Vol.16, No.2, 2007, pp.69-91.
[21] J. P. Guiltinan, “The Price Bundling of Services: A Normative Framework”, The
Journal of Marketing, Vol.51, no.2, pp.74-85,
1987.
[22] M. S. Yadav, and K. B. Monroe, “How Buyers Perceive Savings in a Bundle Price: An Examination of a Bundle's Transaction Value”,
Journal of Marketing Research, Vol.30, No.3,
pp.350-358, 1993.
[23] S.S. Lee, “With Implications for the Competition Policy: The Economic Effects of Service ( Un ) Bundling in Telecommunications Industry”, The Korean Journal of Industrial
Organization, Vol.9, No.2, 2001, pp.179-199.
[24] Copenhagen Economics, “How Does Handset Subsides Affect Incentives to Innovate?”, 4 July 2008.
1709
Journal of Cybercommunicaiton, Vol.27, No.4,
2010, pp.163-208.
[26] S.C. Park and S.Y. Ryoo, “An Empirical Investigation of End-Users’ Switching Toward Cloud Computing: A Two Factor Theory Perspective”, Computers in Human Behavior, Vol. 29, 2013, pp.160-170.
[27] F. D. Davis, “Perceived Usefulness, Perceived Ease of Use, and User Acceptance of Information Technology”, MIS quarterly, 1989, pp. 319-340.
[28] J,K. Lee, J.H. Kang, H.B. Kim, I.S. An, M.J. Oh and H. Cho, “Influencing Factors on Intention to Adopt of Wearable Device: Focusing on the Smart Watch”, The Journal of
Internet Electronic Commerce, Vol.16, No.1,
2016, pp.195-213.
[29] C. Fornell, and D.F Larcker, “Evaluating Structural Equation Models with Unobservable Variables and Measurement Error”, Journal of
Marketing Research, Vol.18, No.1, 1981, pp.
39–50.
[30] W. W. Chin, B. L. Marcolin, and P.R. Newsted, “A Partial Least Squares Latent Variable Modeling”, Information Systems
Research, Vol.14, No.2, 2003, pp.189-217.
[31] R.D. Tobia, “An Introduction to Least Squares Regression”, SAS Institution Inc., 1999.
[32] A. Srinivasan, “Alternative Measures of System Effectiveness: Associations and Implications”, MIS quarterly, 1985, pp.243-253. [33] J. Reagan, “The Difficult World of Predicting Telecommunication Innovations: Factors Affecting Adoption”, Communication Technology and Society: Audience Adoption
1710
Table 7: The Confirmatory Analysis Results
Variables Measurement Items Sources
Security
SEC1 IoT service should not malfunction due to external physical factors.
Hess et al. [17] SEC2 IoT service should always provide stable services regardless of the external environment.
SEC3 IoT service should be secure against hacking and unauthorized access from outside.
SEC4 Personal information and data used when using IoT service should be safely protected.
Compatibility
COM1 IoT service (devices) and smart phone should be easy to work together.
Srinivasan, [32] COM2 IoT service (devices) and smart phone should be compatible.
COM3 IoT service (devices) should integrate with smartphone and be easy to use.
Bundling Service
BS1 Using the bundling service, the service counter will be unified and request A/S time and processing time of the IoT will be faster.
Park et al.[25], BS2 Using the bundling service will be convenient because I can use the same call center when I need consultation on IoT service.
BS3 Using bundling service will simplify the process of paying for IoT service charges.
BS4 Using bundling service, the telecom company will provide me with a variety of IoT service information quickly.
Bundling Fee
BF1 Monthly fees for bundling services including the IoT service, should be reasonable.
Reagan [33] BF2 The discount rate of the monthly usage fee of the bundling service has a great influence on the decision to use the IoT service.
BF3 The IoT service offered by bundling should be highly value for money.
BF4 Bundling service will reduce the cost of IoT service compared to using individual services.
Loyalty to Telecom Company
LOY1 I will recommend my using telecom company to people nearby.
Lee et al. [28] LOY2 I am generally satisfied with the telecom company in use.
LOY3 I will continue to use the service of my telecom company Perceived ease
of use
PE1 IoT service will be available whenever I want to use it.
Davis, [27] PE2 Overall, IoT service will be easy to use.
Perceived usefulness
PU1 IoT service useful in my daily life.
Davis, [27] PU2 IoT service increase the efficiency in my life
PU3 IoT services helps me accomplish things more quickly in my life.
PU4 IoT services helps me perform many things more conveniently.
Intention to use
USE1 I will use the IoT service as soon as possible.
Davis, [27] USE2 I will use it immediately when the IoT service is commercialized.
![Figure 1: ITU definition of IoT[4]](https://thumb-us.123doks.com/thumbv2/123dok_us/8904367.956181/2.612.95.291.491.633/figure-itu-definition-of-iot.webp)