Journal of Chemical and Pharmaceutical Research, 2013, 5(9):478-482
Research Article
CODEN(USA) : JCPRC5
ISSN : 0975-7384
A novel multi-scale qualitative trend analysis algorithm
Dong Gao, Xin Xu and Xin Ma*
College of Information Science and Technology,Beijing University of Chemical Technology, Beijing, China
_____________________________________________________________________________
ABSTRACT
Qualitative trend analysis (QTA) is a data driven approach and has been widely used in data compression, data monitoring, fault diagnosis and etc. However, for the traditional qualitative trend analysis, the qualitative trend is usually extracted by a fixed window and thresholds used are always dependent on human experience. So the qualitative trend extracted cannot represent the real trend reasonably. A novel multi-scale qualitative trend analysis algorithm is proposed to extract the qualitative trends. The process data is fitted linearly in a sliding window. The window can be extended or reduced to determine a segment. After all the segments for the data are determined, a qualitative trend of the data has been extracted. And then the initial width of the sliding window is changed to repeat above work in different scales. All the trends in different scales are ranked according to the fit index (F.I.) in decreasing order. The segments of the first one are sent to trend identification. The segments are indentified as “Increasing”, “Decreasing”,” Steady” and the qualitative trend is obtained. The result of case study proved that the trend can be extracted and identified efficiently with high accuracy using the algorithm.
Keywords: Multi-scale; Qualitative trend analysis; Trend extraction; Sliding window
_____________________________________________________________________________
INTRODUCTION
In chemical process industry, the data usually contain a lot of information, such as the state of system, the response of system, hand operation and so on. The information is very important and useful for state monitoring, data compression, fault diagnosis. However, due to increasing complexity of modern chemical plants, the useful information is usually hidden in the huge data. Qualitative trend analysis (QTA) is a data driven technique, which works by extracting the trend, identifying the trend [1]. QTA has been widely used in process data analysis, fault diagnosis, data compression and so on.
For the algorithms above, most of them fitted the data to a polynomial in a fixed window and some thresholds depend on human experience, so the segments cannot represent the real trend well. In addition, the complexity of the algorithm is high.
In the article, a novel multi-scale qualitative trend analysis algorithm is proposed to extract and identify the qualitative trend. The algorithm fits the data in a sliding window with an initial width to a constant or first-order polynomial. According to the fitting result, the window is extended or reduced adaptively to determine a segment. After all the segments for the data are determined, the qualitative trend of the data has been extracted. And then a sliding window with new initial width is used to repeat above work in a different scale. Every initial width is equal to L/2n (n = 1, 2…log2L-3). L is the length of data. All the trends are ranked according to the fit index (F.I.) in decreasing order. The segments of the first result are used for trend identification. The segments are indentified as “Increasing”, “Decreasing”, “Steady” and the qualitative trend is obtained. The case study presented shows that the algorithm can extract trend efficiently with high accuracy.
MULTI-SCALE QUALITATIVE TREND ANALYSIS
The multi-scale qualitative trend analysis includes three steps: (1) extracting trends using an adaptive window in different scales; (2) Ranking the trends according to F.I.; (3) Indentifying segments of the first trend as “Increasing”, “Decreasing”, and “Steady”.
1. Multi-scale trend extraction The trends are extracted as follows:
(1) The original data is y1, y2,...yL,the length of data is L. A window is used to store the data, whose width M is equal to L/2n (n = 1, 2…log2L-3). The data y1,y2,...yM is added to the window.
(2) Fit the data in the current window to a constant or first-order polynomial:
( )
*
y t
a t
b
(1)t is time. And then F-test is used to determine whether linear fitting is acceptable.
If it is acceptable, the window will be extended to add a new data from the original data until it is not acceptable. To (3).
Otherwise, 3σrule is used to determine whether the data in the window is steady. If the data is steady, the window will be extended to add a new data from the original data until it is not steady, a segment is determined. To (4). Otherwise, the window is reduced and the last data in the window is sent back to original data. The data in the window is fitted to formula (1) again until fitting result is acceptable or is steady. To (4).
(3) The data in the current is split into 2 parts to get a more accurate result. The data in current window is y1,y2,…yw (w > M). y1, y2, yi, yi+1…yw (1< i<w) are fitted as formula (1) separately. The sum of fit error is calculated. The splitting schedule (i = P) with min fit error is found. The second part of data (yP+1,…yw )is sent back to original data and the first part of data(y1,y2,…yP) as a segment is to (4).
F.I. is calculated as formula (2):
1
,
. .
0,
i i
i
m Fittingerror
averageerror
F I
Fittingerror
averageerror
(2)i = 1, 2… N; N is number of trends in the set; F.I.i is the index of the trend Si; m is the number of segments in trend Si; Fittingerrori is the fitting error of the trend Si; averageerror is the average error of the trends.
If the fitting error of trend Si is greater than the average error, the fitting error is unacceptable and the F.I.i is set to 0; otherwise, F.I.i is equal to 1/m. It is reasonable that fewer segments should be used when the error is acceptable, which can reveal the general trend and the complexity is lower.
So the trends are ranked according to the F.I. in decreasing order, the first one is the most suitable and chosen as the result for trend identification.
3. Segments identification
A algorithm is used to identify segments in the trend as “Increasing”, “Decreasing”, “Steady”.
For a segment, if it is steady (the value of data have no change), it is identified as “Steady”. If the parameter “a” calculated by formula (1) is positive, it is identified as an “Increasing”, otherwise it is “Decreasing”. When all the segments have been identified, the qualitative trend has been obtained. The result can be applied in data compression, data monitoring, fault diagnosis and etc.
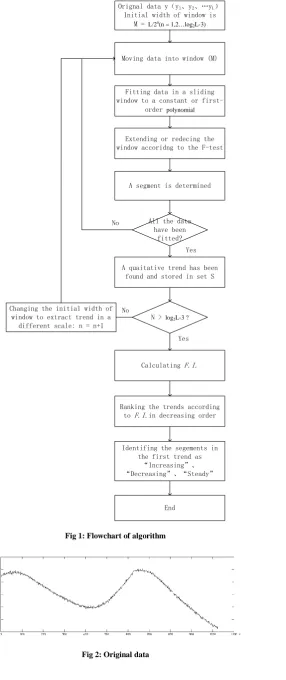
4. The whole flowchart of algorithm
The whole flowchart of algorithm is shown in Fig.1.
CASE STUDY
The algorithm is used to extract and identify qualitative trend from real data in chemical industry. The original data is shown in Fig.2.
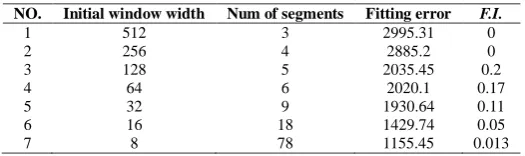
The algorithm of multi-scale qualitative trend analysis is used to extract and identify trends from the original data. The result is shown in table1 in different scales.
[image:3.595.175.438.516.594.2]As the result shown in table1, the fitting error decreases as the initial window width decreases. However, the num of segments increases at the same time. Too many segments can not reveal the general trend. On the other hand, too high fitting error may miss the detail of trend. So according to the rank strategy, the F.I. of 3th trend is the greater
Table 1 Result of qualitative trend analysis
NO. Initial window width Num of segments Fitting error F.I.
1 512 3 2995.31 0
2 256 4 2885.2 0
3 128 5 2035.45 0.2
4 64 6 2020.1 0.17
5 32 9 1930.64 0.11
6 16 18 1429.74 0.05
Orignal data y(y1、y2、…yL) Initial width of window is
M = L/2n(n = 1,2…log 2L-3)
Fitting data in a sliding window to a constant or
first-order polynomial
Extending or redecing the window accoridng to the F-test
Moving data into window (M)
A segment is determined
All the data have been
fitted? No
Changing the initial width of window to extract trend in a
different scale: n = n+1
N > log2L-3 ? No
Yes
A quaitative trend has been found and stored in set S
Calculating F.I.
Ranking the trends according
to F.I.in decreasing order
Identifing the segements in the first trend as
“Increasing”、 “Decreasing”、“Steady”
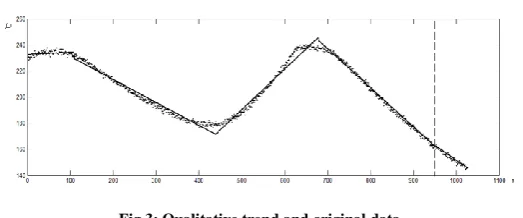
[image:4.595.190.477.72.753.2]Fig 3: Qualitative trend and original data
than others, so the final qualitative trend is obtained. It is shown in Fig. 3.
As it shown in Fig.3, the qualitative trend extracted includes 5 segments (real line). They are: “Increasing”, “Decreasing”, “Increasing”, “Decreasing”, and “Decreasing”. The qualitative trend can represent the real trend well. If more detail is needed, the other trends in table 1 with more segments and lower fitting errors can be selected.
The result of case study shows that the trend can be extracted reasonably and accurately using the algorithm. It can be applied for data compression, data monitoring, fault diagnosis and etc.
CONCLUSION
In this article, a novel multi-scale qualitative trend analysis algorithm is proposed. The algorithm includes three steps: (1) extracting trends using a adaptive window in different scales; (2) Ranking the trends according to F.I.; (3) Indentifying segments of the first trend as “Increasing”, “Decreasing”, “Steady”.
Compared to traditional qualitative trend analysis, the trend extracted in the algorithm can represent trend more reasonably due to the sliding window in different scales. In addition, the complexity is lower due to only linear fitting is used. The case study showed that trend can be extracted and identified efficiently with high accuracy using the algorithm.
REFERENCES
[1]Janusz M., Venkatasubramanian V.,1991, Eng. Appl. Artif. Intell., 4,329-339. [2]Cheung J.T., Stephanopoulos G., 1990, Comput. & Chem. Engng.,14,495-510. [3]Rengaswamy R., Venkatasubramanian V.,1995, Eng. Appl. Artif. Intell., 8,35-51. [4]Bakshi B. R., Stephanopoulos G., 1994, Comput. & Chem. Engng.,18,267-302.
[5]Vedam H., Venkatasubramanian V., Bhalodia, 1998, Comput. & Chem. Engng., 22, S827-S830.
[6]Charbonnier S., Garcia-Beltan C., Cadet C., Gentil S., 2005, Engineering Applications of Artificial Intelligence, 18, 21–36.
[7]Maurya R.M., Paritosh P.K., Rengaswamy R.,2010, Engineering Application of Artificial intelligence, 23, 950-960.
[8]Scali C., Ghelardoni C., 2008, Control Engineering Practice, 16, 1501–1508.