Birth Prevalence of Overt Congenital Anomalies
in Kano Metropolis: Overt Congenital
Anomalies in the Kano
Lofty-John Chukwuemeka Anyanwu
1,2,*, Barnabas Danborno
1, Wilson O. Hamman
11Department of Human Anatomy, Ahmadu Bello University Zaria, Nigeria
2Paediatric Surgery Unit, Department of Surgery Aminu Kano Teaching Hospital and Bayero University Kano, Nigeria
Copyright © 2015 Horizon Research Publishing All rights reserved.
Abstract
Congenital anomalies are abnormalities of prenatal origin, and their prevalence varies worldwide. The objective of this study was to determine the prevalence and spectrum of overt congenital anomalies in live born neonates in selected hospitals in the Kano metropolis of North western Nigeria, as well as the associated maternal, paternal and neonatal risk factors. A descriptive study design was employed. All live born neonates in three major hospitals in Kano metropolis were prospectively studied from April 2013 to December 2013. Detailed family history and clinical data were recorded in a structured questionnaire for each child. A total of 1456 live born neonates were recruited into the study, of which 41 (28.15 per 1000 live births) had overt congenital malformations with 5 (12.20%) having multiple system involvement and 36 (87.80%) having a single system affectation. The most common system involved in neonates with isolated single system malformations were the central nervous system (10 cases) and the genitourinary system (10 cases). The consanguinity rate in the study was 17.83%. Birth weight of the neonates had a significant but negative association with the likelihood of being born with a congenital malformation [OR = 0.374; (95% CI 0.196 – 0.711) P = 0.003]. Given the high frequency of potentially preventable central nervous system malformations in this study, emphasis on the primary prevention of congenital malformations by encouraging periconceptional use of folic acid containing multivitamin supplements is recommended.Keywords
Congenital malformation; Overt; Consanguinity; Periconceptional; Neonate1. Introduction
Congenital malformations also known as birth defects are structural or functional anomalies of prenatal origin which result from a defect or abnormality in the process of
development [1-4]. The birth prevalence of congenital anomalies varies from country to country. It is believed that between 2-4% of live born infants and 15-20% of stillbirths have a significant birth defect [5,6,7]. Birth defects are an important cause of childhood morbidity and mortality as it is estimated that one out of every 3 babies that die in the world has a congenital anomaly [7,8].
The World Health Organization (WHO) estimates that about 260,000 deaths worldwide (i.e. 7% of all neonatal deaths) were caused by congenital anomalies in the year 2004 [9]. Apart from the direct impact on affected children and their families, congenital anomalies exert an enormous financial burden on a nation’s health, educational and social support services [2,10].
Congenital anomalies could be broadly classified into 2 major groups i.e. single system abnormalities affecting a single organ system or body part, and multiple abnormalities which affect more than one organ system or body part [1,2,11]. Major congenital anomalies are defined as those abnormalities that if uncorrected or uncorrectable will significantly impair normal body functions or reduce life expectancy, while minor anomalies are those that cause no handicap i.e. they cause no significant physical or functional effect and can be regarded as normal variants if they affect more than 4% of the population [1,5].
Recorded prevalence rates for congenital anomalies in developing countries are underestimated by deficiencies in diagnostic capabilities, lack of reliability of medical records and health statistics, and underreporting [10]. In response to this concern, this study was undertaken to establish the prevalence and spectrum of overt congenital malformations at birth in the Kano metropolis in Northwestern Nigeria.
2. Materials and Methods
The study was carried out between April 2013 and December 2013.
Approval was obtained from the Teaching Hospital’s and Kano State’s ethical committees for this study. All babies were routinely examined within 48hours of delivery [1]. The diagnosis of congenital abnormality was based only on clinical examination and assessment by trained research assistants who were either medically qualified or medical students. Chromosomal analysis and autopsies were not performed in this study. Both major and minor malformations were included in the study. Structural anomalies are considered “overt” or “external” when they are visible on inspection, otherwise they are considered “occult” or internal” [4,12]. In neonates with congenital anomalies involving two or more systems, a diagnosis was made if the group of malformations constitute a known syndrome or chromosomal disorder, and the child is recorded only once under that diagnosis. If no diagnosis can be made, the infant is classified and coded only once as having a multiple congenital abnormality, and the system with the most obvious or major malformation was noted [7,13]. For each case, a detailed pregnancy and family history, including the presence of absence of consanguinity, was obtained by interviewing the mother [1]. Data were recorded on a pretested structure questionnaire for each neonate. Data were analyzed using SPSS 15.0 (SPSS Inc, Chicago, IL).
Descriptive statistics were computed for continuous variables, while proportions were used for categorical characteristics of the study subjects. The chi-square test was used to test for association. Fisher’s exact test (two-tailed) was used where appropriate. Multivariate logistic regression was done to identify significant predictors of being born with congenital anomaly. Level of significance was set at P<0.05 for all tests.
3. Results
A total of 1456 live born neonates were recruited into the study over the study period.
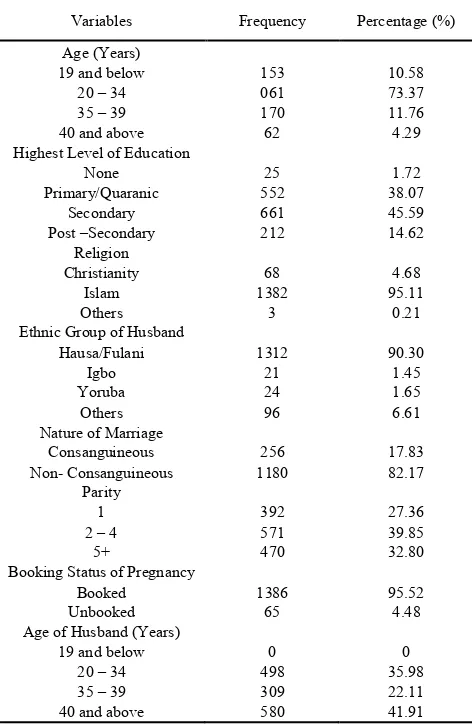
The basic characteristics of the study neonates and their mothers (Table 1 and Table 2) are as depicted. Most of the neonates were males (52%; 757/1456), majority of them were products of singleton gestation (91.62%; 1334/1456). Vaginal delivery was the main type of delivery (85.60%) in the study. A consanguinity rate of 17.83% was observed in the study.
During the study period, 41 babies were found to have an overt congenital malformation, giving a prevalence of 28.15 per 1000 live births (Table 3). Among those with a congenital malformation, 5 (12.2%) had multiple abnormalities, while 36 (87.8%) had involvement of a single system. The prevalence for multiple malformations in the study was thus 3.43 per 1000 live births, and that for single-system malformations was 24.72 per 1000 live births. Among the neonates with single-system malformations
[image:2.595.313.551.146.349.2](Table 3 and Table 4), the most common systems involved were the central nervous system and genitourinary system with 10 cases each, the dermatological system (6 cases), and gastrointestinal system (5 cases).
Table 1. Characteristics of Neonates in the Study
Variables Frequency Percentage (%)
Gender Male
Female 757 699 52 48
Type of Delivery Vaginal
Caesarean Section 1242 209 85.60 14.40
Gestational Age (Weeks) 36 and above
37 – 40 41 and above
363 838 220
25.55 58.97 15.48 Nature of Gestation
Singleton Twins Triplets
1334 116
6
91.62
7.97 0.41 Birth Weight (kg)
< 2.5 2.5 – 4.0
>4.0
98 1196
27
7.42 90.54
2.04
Table 2. Socio-demographic characteristics of neonates’ mothers
Variables Frequency Percentage (%)
Age (Years) 19 and below
20 – 34 35 – 39 40 and above
153 061 170 62
10.58 73.37 11.76 4.29 Highest Level of Education
None Primary/Quaranic
Secondary Post –Secondary
25 552 661 212
1.72 38.07 45.59 14.62 Religion
Christianity Islam Others
68 1382
3
4.68 95.11
0.21 Ethnic Group of Husband
Hausa/Fulani Igbo Yoruba
Others
1312 21 24 96
90.30
1.45 1.65 6.61 Nature of Marriage
Consanguineous
Non- Consanguineous 1180 256 17.83 82.17
Parity 1 2 – 4
5+
392 571 470
27.36 39.85 32.80 Booking Status of Pregnancy
Booked
Unbooked 1386 65 95.52 4.48
Age of Husband (Years) 19 and below
20 – 34 35 – 39 40 and above
0 498 309 580
[image:2.595.314.550.373.736.2]Table 3. Summary of congenital malformations in the study
Malformations No. of Cases Prevalence Per 1000 Births Multiple Malformations Syndromes Undetermined Sub-Total 2 3 5 1.37 2.06 3.43 Single-System Malformations Central nervous system
Mouth Gastrointestinal Genitourinary Musculoskeletal Dermatological Sub-Total 10 2 5 10 3 6 36 6.87 1.37 3.43 6.87 2.06 4.12 24.72
[image:3.595.316.548.238.674.2]Total 41 28.15
Table 4. Single –System involvement among neonates with congenital malformations
System No. of Cases
A.
Central Nervous System Hydrocephalus Anencephaly and encephalocoele
Encephalocoele Microcephaly Sub Total 2 1 1 6 10 B. Mouth Cleft lip and palate
Cleft palate Sub Total 1 1 2 C. Gastrointestinal System Intestinal Obstruction Omphalocoele Gastroschisis Sub Total 2 1 2 5 D. Genitourinary System Bladder exstrophy/epispadias complex
Undescended testes Sub Total
3 7 10
E. Musculoskeletal System Polydactyly
Sub Total 3 3
F. Hyperpigmented patches Dermatological
Sub Total 6 6
[image:3.595.61.294.290.578.2]Total 36
Table 5. Multiple congenital abnormalities in the study
Malformations No. of Cases
A.
Syndromes Down’s Beckwith - Wiedemann
Sub Total 1 1 2 B. Undetermined
Microcephalous and sacrococcygeal teratoma Hydrocephalus, meningocoele and bilateral
talipes equinovarus
Cleft lip, cleft palate and polydactyly of both upper and lower limbs
Sub Total
1 1
1 3
Total 5
Of the 5 neonates with multiple malformations, 2 had recognized syndromes one of which was a case of Down’s syndrome and the other a case of Beckwith – Wiedemann syndrome (Table 5). In 3 of these neonates with multiple malformations, a complete evaluation was not possible in order to determine whether they were syndromes, associations, sequences, complexes or chromosomal abnormalities. They were thus classified as “undetermined” (Table 5). The birth prevalence of Down’s syndrome and Beckwith – Wiedemann syndrome in the study was 0.69 per 1000 live births each.
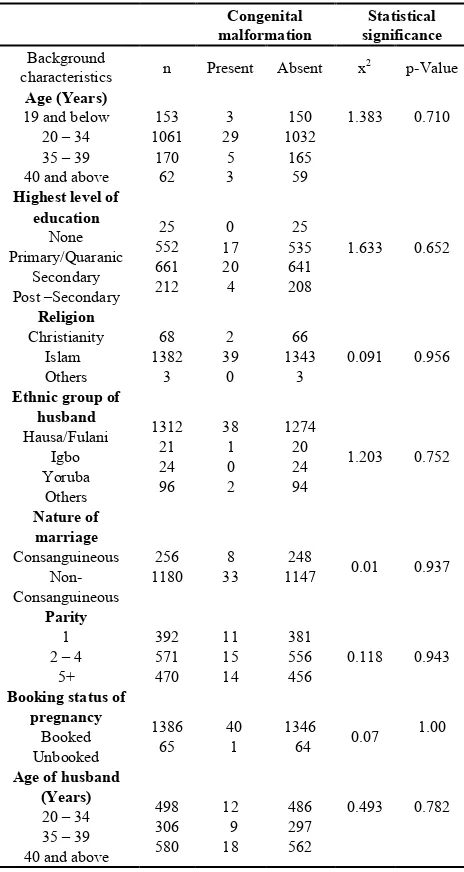
Table 6. Socio-demographic characteristics of neonates’ mothers in relation to birth of a child with a congenital malformation
Congenital
malformation significance Statistical Background
characteristics n Present Absent x2 p-Value
Age (Years) 19 and below
20 – 34 35 – 39 40 and above
153 1061 170 62 3 29 5 3 150 1032 165 59
1.383 0.710
Highest level of education None Primary/Quaranic Secondary Post –Secondary 25 552 661 212 0 17 20 4 25 535 641 208
1.633 0.652
Religion Christianity Islam Others 68 1382 3 2 39 0 66 1343
3 0.091 0.956
Ethnic group of husband Hausa/Fulani Igbo Yoruba Others 1312 21 24 96 38 1 0 2 1274 20 24 94
1.203 0.752
Nature of marriage Consanguineous Non- Consanguineous 256
1180 33 8 1147 248 0.01 0.937
Parity 1 2 – 4
5+ 392 571 470 11 15 14 381 556
456 0.118 0.943
Booking status of pregnancy
Booked Unbooked
1386
65 40 1 1346 64 0.07 1.00
Age of husband (Years) 20 – 34 35 – 39 40 and above
498 306 580 12 9 18 486 297 562
0.493 0.782
[image:3.595.58.297.601.748.2]congenital malformation, as children who weighed less than 2.5kg at birth, had a higher prevalence of congenital malformation (8/98; 8.16%) than those who weighed 2.5kg – 4.0kg at birth (29/1196; 2.42%) and those who weighed more than 4.0kg at birth (0/27; 0%).
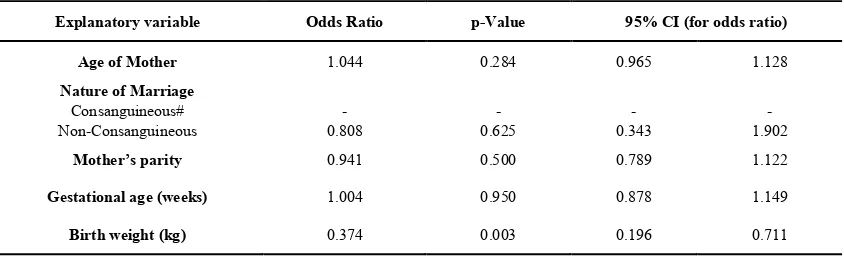
Multivariate analysis of the data is depicted in Table 9 which presents the adjusted odds ratios and 95 percent confidence intervals for being born with a congenital abnormality, based on the result of a binary logistic
regression analysis done using age of mother, nature of parents’ marriage, mother’s parity, gestational age and birth weight as independent variables.
[image:4.595.88.521.204.412.2]The findings of this model also showed that birth weight of the neonates was an important and significant predictor of being born with a congenital abnormality [OR =0.374; (95% CI 0.196 -0.711) p= 0.003]. Thus birth weight has a significant but negative association with the likelihood of being born with a congenital abnormality
Table 7. Peri-Pregnancy characteristics of neonates’ mothers in relation to birth of a child with a congenital malformation Congenital malformation Statistical significance
Background characteristics n Present Absent x2 p-Value
Folic acid containing multivitamin supplement use in pregnancy.
< 1 month before pregnancy 2nd or 3rd month of pregnancy
After 3rd month of Pregnancy
No use at all
73 158 1063
158
2 4 29
6
71 154 1034
152
0.632 0.889
Pregestational Diabetes mellitus Yes
No 1431 23 41 0 1390 23 0.678 0.410
Febrile illness in first trimester of pregnancy Yes
No 1096 358 12 29 1067 346 0.491 0.484
Native medication use in first trimester of pregnancy Yes
[image:4.595.91.523.427.672.2]No 1356 98 37 4 1319 94 0.611 0.435
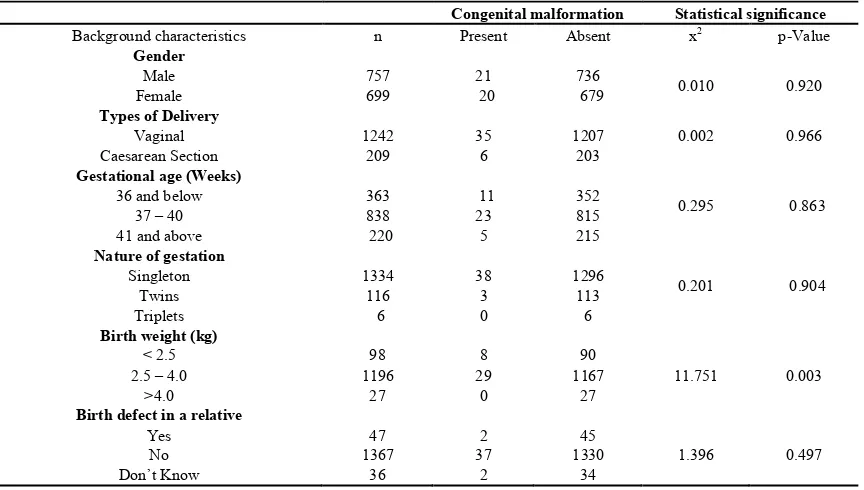
Table 8. Characteristics of neonates in the study in relation to being born with a congenital malformation
Congenital malformation Statistical significance
Background characteristics n Present Absent x2 p-Value
Gender Male
Female 757 699 20 21 679 736 0.010 0.920
Types of Delivery Vaginal
Caesarean Section 1242 209 35 6 1207 203 0.002 0.966
Gestational age (Weeks) 36 and below
37 – 40 41 and above
363 838 220
11 23
5
352 815 215
0.295 0.863
Nature of gestation Singleton
Twins Triplets
1334 116
6
38 3 0
1296 113
6
0.201 0.904
Birth weight (kg) < 2.5 2.5 – 4.0
>4.0
98 1196
27
8 29
0
90 1167
27 11.751 0.003
Birth defect in a relative Yes
No Don’t Know
47 1367
36
2 37
2
45 1330
Table 9. Multivariate analysis of congenital malformations and other birth characteristics
Explanatory variable Odds Ratio p-Value 95% CI (for odds ratio)
Age of Mother 1.044 0.284 0.965 1.128
Nature of Marriage Consanguineous#
Non-Consanguineous 0.808 - 0.625 - 0.343 - 1.902 -
Mother’s parity 0.941 0.500 0.789 1.122
Gestational age (weeks) 1.004 0.950 0.878 1.149
Birth weight (kg) 0.374 0.003 0.196 0.711
#Comparison Group
4. Discussion
Birth defects are an important cause of morbidity and mortality among children worldwide, thus making them a relevant public health concern. Congenital abnormalities are believed to arise from genetic causes in about 10-20% of cases, environmental causes in 10-20% of cases, and 60-80% are attributed to unknown factors [3,8].It thus follows that birth defects can be categorized as those of a simple genetic origin (monogenic); or those due to interactions between multiple genetic and non-genetic, usually undefined factors (multifactorial), those associated with chromosomal abnormalities, those attributed to discrete environmental factors as the major causes, and all others with no recognized cause [2,14].
The overall prevalence of birth defects in a given population, tells how many children in that population were born with at least one congenital abnormality. Worldwide surveys have shown that birth prevalence of congenital abnormalities varies greatly from country to country and even within the same country among regions, and this may be attributed to one or more factors such as the design of the study (hospital based or population based, prospective or retrospective), definitions, classifications and inclusion criteria used, end-point of the detection period, type of surveillance system and completeness of patient ascertainment, etiological heterogeneity of malformations, accuracy of diagnosis, prenatal screening policies, the extent of selective termination of affected pregnancies, the gestational age at which these are included in monitoring reports, the extent to which the terminations and notified, social, racial, ecological and economical influences [2,15,16]. As a consequence of all these factors, estimates of birth prevalence vary from place to place and thus make comparison of rates among studies difficult and probably not very informative [2,17]. However, apart from a small number of specific anomalies, any differences in prevalence are thought largely to be due to methodological difference rather than true difference in underlying population incidence [17].
The prevalence of congenital malformations in this study was 28.15 per 1000 live births. This figure is lower than the 6.9% reported in neonates by Bakare et al., in South western Nigeria [18]. It is however higher than the figure (0.75 %)
al., in Cross River state of Southern Nigeria [19]. Birth prevalence of congenital anomalies varies appreciably from country to country, being as low as 1.07 % in Japan and as high as 4.3 % in Taiwan [16]. The prevalence of congenital anomalies found in this study is comparable to studies from other countries [2,6,7,16]. One of the reasons to explain this variation of prevalence figure could be that some degree of selection bias was probably in effect because the study was conducted in 3 major hospitals in the Kano metropolis of North Western Nigeria, which also receive referrals of high risk pregnancies from peripheral hospitals in the region. The exact number of such referrals as well as the number of pregnancies with fetal malformations diagnose elsewhere and referred to these hospitals for management was not assessed by this study. It is also worthy of note to mention that the rates reported in this study might have underestimated the prevalence of birth defects in the region as not all congenital anomalies could be detected at birth or shortly thereafter because of the lack of cytogenetic and teratology investigations or autopsies for still birth and neonatal deaths [15].
Longitudinal cohort studies with special follow up examination provide high incidence figures for congenital anomalies as contrasted to studies based on information from hospital data, because it collects valid information on late manifestation of congenital malformations [20].
The highest frequency of congenital malformations reported in this study involved the Central Nervous System (CNS) and genitourinary system (GU), followed by dermatological system, gastrointestinal system (GIT), musculoskeletal system, and the mouth. CNS anomalies which occurred both as single system and multiple system malformations are considered the most common anomalies in this study. This finding is similar to what has been reported from Cross Rivers State in the South of Nigeria [19], and from Jos in the North central region of Nigeria [21], as well as workers from other parts of the world [15,20,22].The finding is however at variance with the report of Bakare et al., from South Western Nigeria and that of some other workers from outside the region [2, 14, 16, 18]. The data however show that the frequency of anomalies in other systems differs in different studies done from various regions of the world [1, 3, 8].
least 400 micrograms of folic acid alone or in multivitamin supplements daily starting at least one month before conception and through the first trimester of pregnancy is effective in preventing both the occurrence and recurrence of neural tube defects [2,23,24]. Periconceptional use of folic acid alone, or in multivitamins supplements have also been shown to reduce the occurrence of some other congenital abnormalities [25,26,27].
Consanguineous marriages are believed to be important in contributing to the risk of being born with a congenital abnormality [28 -31]. It has been documented that the risk of a child having a recessively inherited condition is higher if the parents are related, and the more closely related the parents are, the higher the risk [1, 30]. High rates of consanguinity ranging between 25-60 % of all marriages have been reported for Muslim Arab countries [2,20,29]. Majority of the mothers in this study (95.11 %) were from Muslim homes, and the consanguinity rate in the study was 17.83 % the rate of malformation was 3.13 % and 2.80 % in consanguineous and non-consanguineous marriages respectively. Although, the prevalence of anomalies was higher in consanguineous marriages than non-consanguineous marriages, this was however not statistically significant. This finding is in agreement with the finding of Tayebi et al.[32], but is at variance with the results from the study by Francine et al.[16 ],who found a statistically significant relationship between parental consanguinity and being born with a congenital abnormality.
In this study, females were more affected with congenital anomalies (2.86%) than males (2.77%). This difference was however not statistically significant. Other workers have reported a male excess for congenital anomalies [20,33]. This finding has raised some speculations i.e. either females are afflicted with a relatively more minor abnormality which they survive with, or they suffer more fatal anomalies [30]. It is thus recommended that sex distribution should be studied in every congenital malformation separately and not in the whole group, as it is evident from literature that there are large reported variations in patterns of congenital malformations involving different body system [20,30].
Multi-parity was associated with increased prevalence of congenital malformations in this study. Women who had 5 or more children had the highest prevalence of births with a congenital malformation (2.98 %). The relationship between parity and the birth of a child with a birth defect was however, not statistically significant. Shawky and Sadik had earlier noted an association between multi-parity and an increase in the prevalence of congenital malformations [20]. Muga et al., had also noted in their study that among the babies with a CNS malformation, that birth order “4” contributed 55.2 % of the cases [7]. At variance with these observations however is the report by Tomatir et al., who showed that in their series, 78.1 % of the mothers who had given birth to a child with a congenital anomaly, were experiencing their first or second live birth [8].
Findings from this study reveal that the prevalence of birth
defects was higher in the offspring of women who gave a history of having a febrile illness in the first trimester of pregnancy (3.35 %) than those who did not have (2.65 %). The association between the birth of a child with a congenital anomaly and having a febrile illness in the first trimester of pregnancy was however not statistically significant. It has been known for about 100 years now that malformations could be induced in various animal species by exposing the mother to high body temperatures during critical periods of gestation [34, 35, 36]. Although human data are inconclusive and often conflicting, it is believed that the threshold of effect in many species begins at about 1.50C over normal
core body temperature [34, 35]. Defects of the CNS, craniofacial development including clefts, the axial and appendicle skeleton, the body wall, teeth, and heart are commonly found in various animal species, and nearly all these defects have been found in human epidemiological studies following maternal fever or hyperthermia during pregnancy [36].
Data from this study reveal that 9.76 % of the mothers of the neonates with congenital anomalies had a positive history of use of native medication (non-alcohol, non-orthodox) in the first trimester of pregnancy. The prevalence of congenital anomalies was higher (4.08 %) in the offspring of mothers who had used native medication in the first trimester of pregnancy than in those who had not (2.73 %). This was however, not statistically significant. Drugs taken by pregnant women can cross the placenta, alter its oxygen transport function by constricting blood vessels, and affect the fetus by acting directly on it, causing damage, abnormal development, teratogenesis or death [20]. Francine et al., documented in their series that maternal drug intake during pregnancy was positively associated with congenital malformation in the offspring [16].
In this study, a high prevalence of birth defects (8.16 %) was observed in children whose birth weight was less than 2.5 kg, than in those with a birth weight of 4.0 kg and above (0 %). This finding was statistically significant (p=0.003). Multivariate analysis also revealed that birth weight was a significant and important predictor of being born with a congenital abnormality among the neonates in the study. A high prevalence of birth defects was also noted in this study for preterm (less than 37 weeks gestational age) neonates than for term (37 weeks gestational age or more) neonates. This finding was however not statistically significant. A high prevalence of birth defects have also been previously reported in other studies among infants with low or very low birth weight as well as in prematures [16,37,38,39]. More than 20 million low birth weight (LBW) infants are born globally each year, consisting 17 % of all births in developing countries, which is more than the 7 % rate in industrialized nations [40].
involved in LBW being different for premature infants and SGA infants and thus requiring different interventions for prevention [41]. The relationship between growth restriction and malformations may be explained by either the growth restriction as primary and predisposing the fetus to malformations, or as secondary to the presence of malformations, or by coexisting with a malformation due to common etiologic factors [37]. Low birth weight can be caused by various perinatal problems, most frequently by low gestational age [40].The prevalence of low gestational age (less than 37 weeks gestational age) in this study was 25.55 %.
This study had some limitations in that it sought to detect only external (overt) congenital anomalies in neonates within the first 48 hours of birth, relying only on clinical examinations to make a diagnosis. Also neither cytogenetic analysis nor autopsies for stillbirths were done. It has been documented that a specific diagnosis may not be reached for 30-60% of infants with malformations and that diagnosis is not always apparent in the new born period [2]. Notwithstanding the noted limitations, this study provides some information on the magnitude and spectrum of congenital malformations diagnosed soon after birth in neonates in the Kano metropolis of North Western Nigeria.
5. Conclusions
Data from this study show that CNS anomalies which occurred both as single system and multiple system anomalies, were the most common congenital malformations noted in the study population. Also the prevalence of low gestational age (prematurity) in the study was 25.55 %. Given that congenital anomalies are a major cause of morbidity and mortality in developing countries, and that a positive association exist between low birth weight, prematurity and congenital malformations, emphasis ought to be placed on primary prevention of congenital anomalies, targeting those obstetric factors that increase the incidence of prematurity and neural tube defects in the offspring by encouraging routine and comprehensive prenatal care for all expectant mothers, periconceptional use of folic acid containing multivitamin preparations, the avoidance of known teratogens and probable teratogenic agents, as well as preventing and treating disease such as malaria and HIV/AIDs.
Conflict of Interest
None Declared.REFERENCES
AL- Gazali LI, Dawodu AH, Sabarinathan K, Varghese M. [1]
The profile of major congenital abnormalities in the United Arab Emirates (UAE) population. Journal of Medical Genetics 1995; 32:7-13.
Sawardekar KP. Profile of major congenital malformations at [2]
Nizwa Hospital, Oman: 10- year review. Journal of Paediatrics and Child Health 2005; 41: 323-330.
Sallout BI, Al Hoshan MS, Attyyaa RA, Al Suleimet AA. [3]
Antenatal diagnosis, prevalence and outcome of major congenital anomalies in Saudi Arabia :a hospital based study. Annals of Saudi Medicine 2008; 28:272-276.
Ochieng J, Kiryowa H,Munabi I, Ibinga CBR. Prevalence, [4]
nature and characteristics of external congenital anomalies at Mulago Hospital. East and Central African Journal of Surgery 2011; 16: 26-30.
Kingston HM. ABC of Clinical Genetics. 3rd ed. BMJ Books,
[5]
London 2002.
Dastgiri S, Stone DH, Le-Ha C, Gilmour WH. Prevalence and [6]
secular trend of congenital anomalies in Glasgow, UK. Archives of Diseases in Childhood 2002; 86:257-263. Muga RO, Mumah SCJ, Juma PA. Congenital malformations [7]
among newborns in Kenya. African Journal of Food Agriculture Nutrition and Development 2009; 9:814-829. Tomatir AG, Demirhan H, Sorkun HC, Koksal A, Ozerden F, [8]
Cilengir N. Major congenital anomalies: a five year retrospective regional study in Turkey. Genetics and Molecular Research 2009; 8:19-27.
World Health Organization. Sixty- third World Health [9]
Assembly Provisional Agenda item 11.7. A63/10. Geneva 2010.
Penchaszadeh VB. Preventing congenital anomalies in [10]
developing countries. Community genetics 2002; 5:61-69. Walden RV, Taylor SC, Hansen NI, Poole WK, Stoll BJ, [11]
Abuelo D, Vohr BR. Major congenital anomalies place Extremely Low Birth Weight infants at higher risk for poor growth and development outcomes. Pediatrics 2007; 120:e1-e8.
Abdi-Rad I, Khoshkalam M, Farrokh- Islam Lou HR. The [12]
prevalence at birth of overt congenital anomalies in Urmia , Northwestern lran. Achieves of Iranian Medicine 2008; 11:148-151.
Delport SD, Christianson AL, Van den Berg HJS, Wolmarans [13]
L, Gericke GS. Congenital anomalies in black South African live born neonates at an urban academic hospital. South African Medical Journal 1995; 85:11-15.
Queisser- Luft A, Spranger J. Congenital malformations [14]
Deutsches Arzteblatt 2006; 103: 2464-2471.
Dastgiri S, Imani S, Kalankesh L, Barzegar M, Heidarzadeh [15]
M. Congenital anomalies in lran: a cross sectional study on 1574 cases in the North – west of country. Child: Care , Health and Development 2007;33:257-261.
Francine R, Pascale S, Aline H. Congenital anomalies: [16]
Prevalence and risk factors. Universal Journal of Public Health 2014; 2: 58- 63.
Kurinczuk JJ, Hollowell J, Boyd PA, Oakley L, Brockle- [17]
infant mortality. Oxford: National Epidemiology Unit 2010. Available at www.npeu.ox.ac.uk/infantmortality. Accessed 12th April, 2013.
Bakare TIB, Sowande OA, Adejuyigbe OO, Chinda JY, [18]
Usang UE. Epidemiology of external birth defects in neonates in South Western Nigeria. African Journal Of Paediatric Surgery 2009; 6:28 30.
Eluwa MA, Aneosong SA, Akpantah AO, Ekong MB, [19]
Asuquo OR, Ekanem TB. Congenital malformations recorded in four hospitals in central part of Cross River State, Nigeria. International Journal of Pharmaceutical Science Invention 2013; 2:27-30.
Shawky RM, Sadik DI. Congenital malformations prevalent [20]
among Egyptian children and associated risk factors. The Egyptian Journal of Medical Human Genetics 2011; 12: 69-78.
Danborno B, Danladi SB. The incidence of central nervous [21]
system congenital anomalies in Jos, Nigeria. Journal of Research in Bioscience 2008; 4:98-102.
Swain S, Agrawal A, Bhatia BD. Congenital malformations at [22]
birth. India Pediatrics 1994; 31:1187-1191.
Ying Wu D, Brat G, Milla G, Kim J. Knowledge and use of [23]
folic acid for prevention of birth defects amongst Honduran women. Reproductive Toxicology 2007; 23:600-606. Koren G, Goh YI, Klieger C. Folic acid the right dose. [24]
Canadian Family Physician 2008; 54:1545-1547.
Hall J, Solehdin F. Folic acid for the prevention of congenital [25]
anomalies. European Journal of Pediatrics 1998; 157:445-450.
Czeizel AE. Birth defects are preventable. International [26]
Journal of Medical Sciences 2005; 2:19-92.
Bailey LB, Berry RJ. Folic acid supplementation and the [27]
occurrence of congenital heart defects, orofacial clefts, multiple birth, and miscarriages. American Journal of Clinical Nutrition 2005; 81:1213S-1217S.
Narchi H, Kulaylat N. Congenital malformation: Are they [28]
more prevalent in populations with a high incidence of consanguineous marriages. Annals of Saudi Medicine 1997;17:254-256.
Al-Gazali L, Hamamy H, Al- Arrayad S. Genetic disorders in [29]
the Arab world. British Medical Journal 2006; 333:831-834. Fida NM, Al- Aama J, Nichols W, Alqahtani M. A [30]
prospective study of congenital malformations among live born neonates at a University hospital in Western Saudi Arabia. Saudi Medical Journal 2007; 28:1367-1373.
Al Bu Ali WH, Balaha MH, Al Moghannum MS, Hashim I. [31]
Risk factors and birth prevalence of birth defects and inborn errors of metabolism in Al Ahsa , Saudi Arabia. Pan African Medical journal 2011; 8: 14.
Tayebi N, Yazdani K, Naghshin N. The prevalence of [32]
congenital malformation and its correlation with consanguineous marriages. Oman Medical Journal 2010; 25: 37- 40.
Sokal R, Tata LJ, Fleming KM. Sex prevalence of major [33]
congenital anomalies in the United Kingdom: A national population based study and international comparison meta – analysis. Birth Defects Research ( Part A) 2014; 100: 79-91. Graham JM, Edwards MJ, Edwards MJ. Teratogen update: [34]
Gestational effects of maternal hyperthermia due to febrile illness and resultant patterns of defecst in humans. Teratology 1998;58: 209-221.
Moretti ME, Bar-Oz B, Fried S, Koren G. Maternal [35]
hyperthermia and the risk for neural tube defects in offspring: Systematic review and meta-analysis. Epidemiology 2005; 16: 216-219.
Edwards MJ. Review: Hyperthermia and fever during [36]
pregnancy. Birth defects research (Part A), Clinical and Molecular Teratology 2006; 76: 507-516.
Melve KK, Skjaerven R. Families with birth defects: Is birth [37]
weight of non- malformed siblings affected? American Journal of Epidemiology 2002; 155: 932- 940.
Fatema K, Begum F, Akter N, Zaman SMM. Major [38]
congenital malformations among the nemborns in BSMMU hospital. Bangladesh Medical Journal 2011; 40:7-12. Adams – Chapman I ,Hansen NI, Shankaran S, Bell EF, [39]
Boghossian NS, Murray JC, et al. Ten year review of major birth defects in VLBW infants Pediatrics 2013;132:49-61. Moraes AB, Zanini RV, Riboldi J, Giugliani ERJ. Risk [40]
factors for low birth weight in Rio Grande do Sul State, Brazil: Classical and multilevel analysis. Cadernos de Saude Publica Rio de Janeiro 2012; 28; 2293-2305.
Ugwu R, Eneh A. The population of low birth weight babies [41]