IMAGE AND STUDENTS’ LOYALTY TOWARDS
TECHNICAL AND VOCATIONAL EDUCATION AND TRAINING
Abd Hair Awang
School of Social, Development and Environmental Studies Faculty of Social Science and Humanities
Email: hair@ukm.my
Rahim Md. Sail
Department of Profesional Development and Continuing Education Faculty of Educational Studies
Email:rahim@ipsas.upm.edu.my
Khadijah Alavi
School of Psychology and Human Development Faculty of Social Science and Humanities
Email: khadijah@ukm.my
Ismi Arif Ismail
Department of Profesional Development and Continuing Education Faculty of Educational Studies
Email; ismi@putra.upm.edu.my
ABSTRACT
Many stakeholders have a poor perception towards career in technical and vocational field which needs to be improved in line with the national industrial development plan. The purpose of this study was to analyze the perceptions of secondary school students and apprentices of private institutes on the image of and their loyalty towards technical education and vocational training. The sample for this study was 356 form four secondary school students and 102 apprentices’ from private training centres. Survey questionnaires were used to collect data for this study and correlation and regression analysis were used to analyse the data. The results indicate that school students and apprentices did not agree with the statement that technical students and vocational trainees had low academic interest, tend to be juvenile delinquents, problematic and have low interest in furthering their study to tertiary level. Apprentices have a better perception of the image of technical education and vocational training compared to secondary school students. Furthermore, secondary school students demonstrated low interest in continuing education and work in technical and vocational compared to apprentices. Recognition of qualification, work ethics, social values and applicability of course content are major predictors of students’ loyalty towards technical education and vocational training field. Therefore, promoting and recognizing technical and vocational education and training (TVET) qualification, nurturing high-quality, knowledgeable and innovative skilled workforce with strong work ethics and good social values should be projected frequently especially through the electronic media.
1.0 Introduction
Technical education and vocational training (TVET) has been in the Malaysian educational system for nearly three decades. The establishment of technical and vocational schools and technical institutes across the country have spearheaded the government efforts in introducing technical education and vocational training to Malaysia’s future generation.
In moving towards an innovative knowledge-based economy, Malaysia has recognized the importance of having more knowledge workers to support the technology-based work process in industries, improving productivity and continuing to attract foreign direct investment (Fong, 2006; Kanapathy, 1997; Malaysia, 2002, 2001a,b; Tan & Gill, 2000). In order to respond to the concern, the government has expanded resources for public vocational training institutes. The capacity and capability of the public vocational training delivery system are further strengthened to increase the quantity and the quality of skilled manpower. During the Seventh Malaysia Plan (7MP) 1996 – 2000, both public and private vocational training institutes produced a total of 187,440 skilled and semi-skilled manpower. The output of skilled and semi-skilled manpower from these institutions was to be increased to 301,859 in the year 2001 to 2010 (Malaysia, 2001b). The allocation for public vocational training was also increased from RM1.9 billion in 7MP 1996 – 2000 to RM3.8 billion in the Eight Malaysia Plan (8MP) 2001 – 2005 (Malaysia, 2001b).
The public vocational training institutes are managed by several ministries. The training institutes provide vocational training to secondary school leavers. Most secondary school leavers had taken the “Sijil Pelajaran Malaysia” (Malaysia Certificate of Education) at the age of 17 or 18 years old. In the vocational training system, more emphasis is given to practical work to develop competencies in trade skills as required by related industries (Ahmad, 2001). The duration of pre-employment programs varies, ranging from six months to 24 months in industrial skills. The core objective of technical education and vocational training programs is to develop both technical skills and non-technical skills such as work ethics, team work, communication skills and positive values so that they can be employed on a useful and productive basis (Ahmad, 2001). In total, there are 224 public industrial and skills based training institutes. The public technical education and vocational training institutional setting are as follows:
Fourteen Industrial Training Institutes (ITIs) and apprenticeship scheme organized by Manpower
Department and Human Resource Development Fund (HRDF) of the Ministry of Human Resources.
Eleven MARA Vocational Training Institutes (MVTIs) and 130 Giat MARA centers under the
Ministry of Entrepreneur Development.
Fifteen Youth Training Centers (YTCs) under the Ministry of Youth and Sports.
Twenty Polytechnics (POLYs) and 34 Community Colleges under Ministry of Higher Education.
The industrial and skills training institutes offer various programs at certificate and diploma level except for Giat MARA. Giat MARA provides training in basic skills for those who have left the school system early. Wood & Lange (2000) claimed that public training institutes often failed in equipping youths with relevant work related skills both in the UK and elsewhere. Therefore, training strategies were aimed at producing trainees with holistic thinking skills, innovativeness and in general to become more effective and productive workers, citizens and human beings to contribute to the knowledge-based economy (Malaysia, 2002, 2001a). The National Dual Training System (NDTS) was introduced in 2005 to strengthen national vocational training system where public vocational training institutes and private industries collaborate in providing training for trainees. The private industries focus on providing hands-on authentic experience, whereas training institutes concentrate on providing the basic and theoretical aspects.
1.1 Perception towards TVET
most employers attach a positive image to vocational qualifications in terms of work readiness and adequate income (The Guardian, 2008).
Many factors can influence a students’ decision to pursue a vocational training programme. Image of vocational trainings is one of the factors that play an influential role in students’ decisions to enroll in these programs. Parents as well as school counselors with their personal views can also influence a student’s decision in pursuing vocational training. Unfortunately, many have negative view of vocational education as being a suitable educational path for low academic achievers and school drop outs who want to go directly into the workforce (Hoxter 2002). Also, vocational education is often considered suitable for high risk youths, and not having challenging curriculum (Beltram, 2007) as compared to the mainstream academic path in which most of the bright students chose to be in. These negative views can impact students’ decision on whether or not to pursue vocational trainings which will impact a country’s agenda on human recourse development.
2.0 Statement of the Problem
Despite various efforts undertaken by the Ministry of Education and a number of related agencies to promote and inform the public on the advantages and strengths of the existing technical education and vocational training system in Malaysia, most students and parents still prefer the academic stream rather than the vocational stream. Why does this phenomenon persist despite all the publicity done by the agencies? Do they really understand the system? It is therefore significant to understand and investigate on Malaysian students’ and parents’ awareness of technical education and vocational training in Malaysia.
Perception towards vocational training should therefore, be explored from various stakeholders. There are four main stakeholders in vocational training system. The four stakeholders are the learners and their parents, counselors, enterprises (employers) and training providers. The purpose of this study is to investigate the perception of stakeholders on the image of TVET with the interest to understand their influence on students’ decisions to pursue vocational trainings.
2.1 Research Questions
What are the secondary school students and apprentices’ perception of the image of technical 1.
education and vocational training?
To what extent does the image of technical education and vocational trainings’ impacts students’ 2.
career choice in the field?
To what extent does TVET’s image related to students’ loyalty to the program? 3.
3.0 Methodology
The study used the survey design to determine the image and loyalty of secondary school students and apprentices of private institutions.
3.1 Population and Sample
Table 1: Targeted Respondent and Sample Size
Secondary School Form 4 Students Private Training
Institutes Apprentices
Population (N) Sample
(n) Population (N) Sample (n)
Sek. Men. Keb. AU 150 108 Inst. A 95 76
Sek. Men. Keb. BU 75 65 Inst. B 28 26
Sek. Men. Keb. SA 120 92
Sek. Men. Keb. SB 120 91
Total 465 356 123 102
3.2 Instrumentation
The measurement of TVET’s image (independent variable) and students’ loyalty (dependent variable) was based on instruments that have been used in past studies and have been proven to have high reliability and validity. The image of vocational education scale (Gilbertson 1995; Pryor 1983; Wenrich and Crowley 1964) was adapted and blended with previous research (Alandas 2002; Dedeaux 2005; DeLese 2008; Falco 2006; Mclafferty 2006; Shelby 2005; Shultz 1969; von Yeast 2007; Welch 2004) to assess the image of TVET.Students’ and apprentices’ perceptions of the image of technical education and vocational training were measured by seven dimensions. These are low entry qualification, trainers’ credibility, applicability of course contents, training facilities and equipment, recognition of qualification, future career potential, work ethics and social values.
We have considered five subjective measures of students’ loyalty by asking their intentions on: further study, field of interest, priority to stay, career choice, family encouragement. A questionnaire was developed utilizing a five-point Likert scale with (1 = strongly disagree; 2 = disagree; 3 = somewhat agree, 4 = agree; 5 = strongly agree). Respodents were asked to provide the most appropriate response based on their experience and knowledge with pre-amble “I believe technical education and vocational training……” to the each statements. A corelation and regression analyses were used to determine relationships and the contributions each of image dimensions to the students’ loyalty respectively.
4.0 Findings and Discussions
4.1 Respondents’ Profile
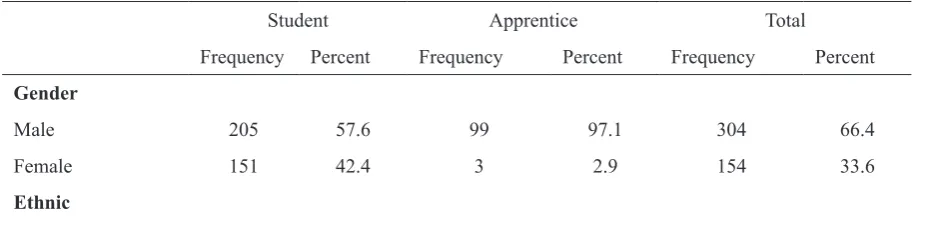
This section presents descriptive statistics the background of respondents. Table 2 exhibits one-third (33.6 percent) of respondents were female. About two-thirds (65.1 percent) of the respondents were Malays, followed by Chinese (20.5 percent) and Indians (12.7 percent). In terms of academic stream, 43.7 percent of them were in economics, business and accounting and 38.9 percent were pure science students. Only 3.7 percent were in technical stream.
Table 2: Demographic Profile and Academic Stream
Student Apprentice Total
Frequency Percent Frequency Percent Frequency Percent Gender
Male 205 57.6 99 97.1 304 66.4
Female 151 42.4 3 2.9 154 33.6
[image:4.595.60.526.667.785.2]Student Apprentice Total
Frequency Percent Frequency Percent Frequency Percent
Malay 245 68.8 53 52.0 298 65.1
Chinese 61 17.1 33 32.4 94 20.5
Indian 43 12.1 15 14.7 58 12.7
Others 7 2.0 1 1.0 8 1.7
Academic stream
Science 145 40.7 33 32.4 178 38.9
Economics, Business & Accounting
169 47.5 31 30.4 200 43.7
Agriculture 1 .3 6 5.9 7 1.5
Arts & Religious 19 5.4 14 13.7 33 7.2
Technical 2 0.6 15 14.7 17 3.7
Others 20 5.6 3 2.9 23 5.0
4.2 Parent Socio-Economic Status
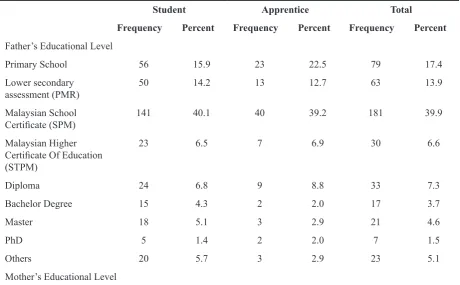
[image:5.595.83.538.53.314.2]Almost 61 percent and 58.8 percent of fathers of secondary school students and apprentices respectively hold secondary school qualifications. Only 17.6 percent of secondary school students’ fathers and 15.4 percent of apprentices’ fathers hold a diploma and university degree. Most of the secondary school students and apprentices surveyed have mothers with Malaysian Certificate of Education qualifications (equivalent to O Levels). Overall, three-quarters of the respondents have parents with relatively low educational background. Table 3 shows that not many parents with bachelor degree (2.0 percent), master degree (2.9 percent) and PhD (2.0 percent) allow their children to engage in apprenticeship programs.
Table 3: Parent Educational Level
Student Apprentice Total
Frequency Percent Frequency Percent Frequency Percent
Father’s Educational Level
Primary School 56 15.9 23 22.5 79 17.4
Lower secondary
assessment (PMR) 50 14.2 13 12.7 63 13.9
Malaysian School
Certificate (SPM) 141 40.1 40 39.2 181 39.9
Malaysian Higher Certificate Of Education (STPM)
23 6.5 7 6.9 30 6.6
Diploma 24 6.8 9 8.8 33 7.3
Bachelor Degree 15 4.3 2 2.0 17 3.7
Master 18 5.1 3 2.9 21 4.6
PhD 5 1.4 2 2.0 7 1.5
Others 20 5.7 3 2.9 23 5.1
[image:5.595.77.538.498.783.2]Primary School 50 14.0 22 21.6 72 16.1
PMR 48 13.5 14 13.7 62 13.8
SPM 155 43.5 41 40.2 196 43.8
STPM 25 7.0 7 6.9 32 7.1
Diploma 30 8.4 10 9.8 40 8.9
Bachelor Degree 13 3.7 5 4.9 18 4.0
Master 4 1.1 1 1.0 5 1.1
PhD 1 .3 1 1.0 2 0.4
Others 20 5.6 1 1.0 21 4.7
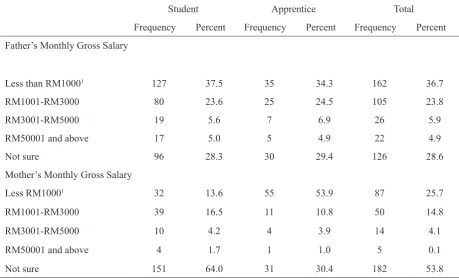
[image:6.595.59.519.325.603.2]Overall, 36.7 percent of secondary students’ and apprentices’ fathers have monthly salary of less than RM1000. Only 5.9 percent have salary of RM3001-RM5000 and 4.9 percent were above RM5001. One-third of apprentices are from low income family, while 24.5 percent have salary between RM1001-RM3000 as shown in Table 4.
Table 4: Parent Monthly Gross Salary
Student Apprentice Total
Frequency Percent Frequency Percent Frequency Percent Father’s Monthly Gross Salary
Less than RM10001 127 37.5 35 34.3 162 36.7
RM1001-RM3000 80 23.6 25 24.5 105 23.8
RM3001-RM5000 19 5.6 7 6.9 26 5.9
RM50001 and above 17 5.0 5 4.9 22 4.9
Not sure 96 28.3 30 29.4 126 28.6
Mother’s Monthly Gross Salary
Less RM10001 32 13.6 55 53.9 87 25.7
RM1001-RM3000 39 16.5 11 10.8 50 14.8
RM3001-RM5000 10 4.2 4 3.9 14 4.1
RM50001 and above 4 1.7 1 1.0 5 0.1
Not sure 151 64.0 31 30.4 182 53.8
Note: 1 included parent with zero monthly income
4.3 Streaming and Educational Information
Table 5 indicates that overall, the choice of educational stream was influenced most by teachers (38.5 percent), followed by own interest (32.9 percent) and parents (12.7 percent). However, when group statistics are compared, interestingly, an astoundingly high percentage of apprentices (83.3 percent) reported that interest was the main factor that influences their educational choice as opposed to only 14 percent of secondary school students who reported that interest played a dominant role in their educational decision.
Table 5: Educational Choice and Source of Information
Student Apprentice Total
Frequency Percent Frequency Percent Frequency Percent Educational choice
Teacher’s choice 155 43.5 3 2.9 158 38.5
Self interest 50 14.0 85 83.3 135 32.9
Parent’s choice 48 13.5 4 3.9 52 12.7
School decided 30 8.4 7 6.9 37 9.1
Peer group 25 7.0 3 2.9 28 6.9
Source of Information
internet 116 44.8 24 23.5 140 34.6
Direct from college or
institute 14 5.4 13 12.7 27 6.7
School counselor 66 25.5 10 9.8 76 18.8
Parent 14 5.4 12 11.8 26 6.4
Peer and relatives 31 12.0 11 10.8 42 10.4
Radio/TV 5 1.9 1 1.0 6 1.4
Newspapers 8 3.1 11 10.8 19 4.7
Magazines 3 1.2 20 19.6 23 5.7
Others 2 0.8 44 43.1 46 11.3
Note: Multiple choices.
4.4 Image of TVET
[image:7.595.72.539.584.763.2]Table 6 depicts the mean scores for seven items on entry qualification, the first dimension of TVETs image. Form four students and apprentices recognized that TVET were accessible to all secondary school students including religious stream, low academic interest, low learning abilities and flexible entry requirements. However, both groups disagreed that TVET students were of low quality, juvenile delinquent, problematic and did not aspire to further their education to advanced or tertiary level.
Table 6: Low Entry Qualification
Item MeanStudent (n=356)Std Apprentice (n=102)
Deviation Mean DeviationStd
Access to all secondary school students 3.64 1.087 4.12 .978
Students with low academic interest 3.54 1.054 3.61 1.162
Students with low learning abilities 3.42 1.132 3.18 1.316
Low and flexible entry requirements 3.18 1.002 3.25 1.158
Low quality students 2.76 1.143 2.16 1.192
For juvenile delinquent and problematic students 2.57 1.235 2.32 1.212
Those who not aspire to higher level 2.55 1.126 2.21 1.238
Trainer credibility is a second dimension of TVET’s image. Most of the respondents perceived their teachers and instructors were competent as shown in Table 7. However, secondary school students and apprentices had slightly low perception in terms of the ability of the school and institutes to provide well-qualified counselors to help students/apprentices develop their course plan.
Table 7: Trainer Credibility
Item MeanStudent (n=356)Std Apprentice (n=102) Deviation Mean DeviationStd
Helpful teachers / instructors 4.06 .905 4.24 .858
Experienced teachers/ instructors 4.02 .916 4.27 .834
Provide ‘real life’ working experience 4.00 .874 4.46 .655 Help students develop their career
plan 3.88 .928 3.92 .941
Qualified teachers / instructors 3.81 .903 4.11 .900
Help students develop their course plan 3.77 1.001 3.75 .909
Notes: Scale 1 = strongly disagree, 2 = disagree, 3 = somewhat agree, 4 = agree, 5 = strongly agree.
From the viewpoints of secondary school students and apprentices, TVET had provided specific job skills, interesting courses, combination of academic and skills, new technology, better career prospects and were more practical. Secondary school students held a slightly lower view of TVET as an alternative educational choice and foundation for continuing higher education as shown in Table 8.
Table 8: Applicability of Course Content
Item MeanStudent (n=356)Std Deviation MeanApprentice (n=102)Std Deviation
Specific job skills needed for career 4.16 .867 4.33 .871
Interesting courses 4.11 .856 4.10 .939
Integrate academic and skills 4.08 .868 4.16 .841
Preparation for technical and vocational
college 4.05 .823 4.09 .785
Application of new technology 3.93 .851 4.38 .690
Provide interesting career prospect 3.91 .850 4.16 .780
Provide for a specific career 3.84 .860 4.27 .810
Offer courses that are more practical 3.83 .868 4.15 .849
Foundation for university education 3.69 .940 3.94 .854
Alternative education program for student 3.55 .990 3.62 .975 Notes: Scale 1 = Strongly disagree, 2 = disagree, 3 = somewhat agree, 4 = agree, 5 = strongly agree.
[image:8.595.68.509.447.679.2]Table 9: Quality of Training Facilities and Equipment
Item MeanStudent (n=356)Std Apprentice (n=102) Deviation Mean DeviationStd
Suitable laboratory/workshop 4.18 .865 4.40 .824
Advanced laboratory/workshop 3.95 .848 4.10 .970
Useful advance and latest technology 3.92 .888 4.10 .970
Sufficient space to support quality education 3.86 .890 4.14 .879
Doesn’t need own expenses and yet is given education
allowance 3.52 1.134 3.69 1.243
Notes: Scale 1 = strongly disagree, 2 = disagree, 3 = somewhat agree, 4 = agree, 5 = strongly agree.
[image:9.595.69.538.352.499.2]Apprentices held a lower image of TVET’s qualification recognition by local universities, overseas higher education institutions and local private companies as shown in Table 10. However, both groups realized that TVET’s graduates were highly employable and earned on par with other academic qualifications.
Table 10: Recognition of Qualification
Item MeanApprentice (n=102)Std Deviation
Employable graduates 4.19 .909
Salary on par with academic qualification 4.12 .998
Recognized by foreign companies 4.03 1.067
Recognized by local private companies 3.93 .957
Recognized by local university 3.59 .968
Recognized by overseas higher education 3.58 1.121
Notes: Scale 1 = strongly disagree, 2 = disagree, 3 = somewhat agree, 4 = agree, 5 = strongly agree.
[image:9.595.75.538.601.730.2]Table 11 indicates that secondary school students and apprentices were optimistic that TVET produced graduates with high future career and job potentials. However, the means of career selection, professionalism and job satisfaction were slightly low for secondary school students.
Table 11: Career and Job Potential
Item MeanStudent (n=356)Std Deviation MeanApprentice (n=102)Std Deviation
High skilled graduate for the nation 4.07 .879 4.31 .890
Easily advance in career. 4.04 .855 4.30 .768
Replace high skilled foreign workers 4.00 .943 4.25 .801
Able to integrate academic knowledge and
technical skills 3.96 .866 4.22 .791
Challenging work with high satisfaction 3.86 .846 4.16 .898
A wide career selections 3.85 .888 4.12 .824
High level of professionalism 3.85 .901 4.19 .876
Secondary school students and apprentices were confident that TVET was able to inculcate and produce graduates with responsible, independent, creative, innovative, self discipline, teamwork, leadership and ICT skills. However Table 12 shows the communication skills and entrepreneur curiosity were perceived to be slightly low.
Table12: Work Ethics and Social Value
Item MeanStudent (n=356)Std Apprentice (n=102) Deviation Mean DeviationStd
Works responsibilities 4.24 .840 4.27 .956
Independent 4.22 .755 4.33 .958
Valuable citizen for society 4.21 .828 4.28 .837
Creativity and innovativeness 4.10 .838 4.10 .907
Teamwork skills 4.09 .836 4.25 .884
Self-discipline 4.08 .910 4.24 .935
Information technology and communication (ICT)
skills 4.04 .877 3.86 .965
Leadership skills 3.97 .868 4.18 .801
Participation in community service 3.93 .893 3.97 .980
Communication skills 3.78 .885 4.06 .921
Inculcate entrepreneurship curiosity 3.77 .943 4.00 .867
Notes: Scale 1 = strongly disagree, 2 = disagree, 3 = somewhat agree, 4 = agree, 5 = strongly agree.
Apprentices perceived of work ethics and social values, future career and job potential, trainers credibility, applicability course content, training facilities and equipment, recognition of qualification of TVET were higher than secondary school students. Both groups of respondents had a neutral perception of low entry qualifications in TVET, as shown in Figure 1.
Figure 1: Overall Image Score
4.5 Student loyalty
[image:11.595.76.539.229.359.2]The total score for students’ loyalty is obtained from the summation of responses based on all the 5 item statements shown in Table 13. A higher mean indicates a higher level of students’ loyalty and inversely, a lower mean indicates a lower level of students’ loyalty. The items with the highest mean among secondary school students’ and apprentices’ loyalty are family encouragement (M=3.78; SD=1.161; M=4.42, SD=.776), intention to further studies in the field of TVET (M=3.65, SD=1.2; M=4.31, SD=.901) and TVET is their field of interest (M=3.62, SD=1.17; M=4.24, SD=.90). However, Table 9 shows priority field of study choice and career preference for TVET exhibited slightly low mean scores. Overall, apprentices at private training institutes had higher loyalty than those at the secondary school.
Table 13: Students Loyalty
Item MeanStudent (n=356)Std Deviation MeanApprentice (n=102)Std Deviation
Family encouragement 3.78 1.161 4.42 .776
Further studies 3.63 1.211 4.31 .901
Field of interest 3.62 1.170 4.24 .903
Priority field of study choice 3.51 1.171 4.23 .866
Career preference 3.27 1.218 4.08 1.012
Notes: Mean classification: 1.00-2.32 = Low, 2.33-3.66 = Moderate, 3.67 – 5.00 = High
4.6 Image Impact on Students’ Loyalty
Table A(in Appendix A) displays inter-correlations among the variables in the study. The correlations were consistent with the educational institutions’ image and students’ loyalty research. The coefficient correlations ranged between low relationship (r =.208) up to moderate relationship(r =.604). However, there was no significant relationship between low entry qualification and secondary school students’ and apprentices’ loyalty.
The equation of students’ loyalty (SL) model,
SL = β0 + β1X1 + β2X2+ β3X3+ β4X4+ β5X5 + β6X6 + β7X7 + ε
Dependent variable Independent variable
SL = overall students’ loyalty SL1 = further study
SL2 = field of interest
SL3 = career preference
SL4 = Priority
SL5= Parent encouragement
X1 = low entry qualification
X2 = trainers credibility
X3 = applicable courses
X4 = training facilities and equipments
X5 = qualification recognition
X6 = career and job potential
X7 = work ethics and social values
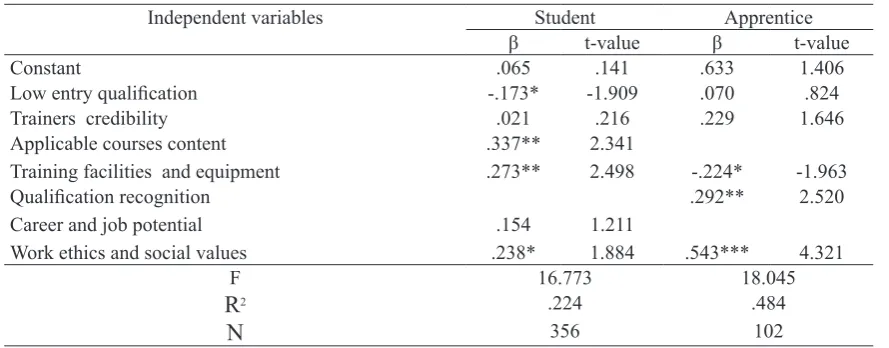
[image:11.595.89.526.526.637.2]The basic assumption of this study was that TVET’s image was significantly related with secondary school students’ and apprentices’ loyalty. The overall image impact in secondary school students’ loyalty showed a strong statistical significance, with ρ<0.001 and the R-square of 0.224. Multi-colinearity does not appear to be a serious concern in this model since the variance inflation factors (VIFs) for these variables are below 3.0 (Hair et al., 1995). The regression model indicates that TVET’s image explained 22.4 percent of the variance in secondary school students’ loyalty. However, applicability of course content, career and job potential were dropped in apprentices’ loyalty model due to high multi-co linearity. Almost 50 percent of the variance in apprentices’ loyalty was explained by this model. Table 15 shows that recognition of qualification [β=0.292, ρ<.05], work ethics and social values [β=0.238, ρ<.10: β=0.543, ρ<.001] and applicability of course content [β=0.337, ρ<.05] were positively related to the dependent variable (loyalty).
Table 14: Overall Image Impact on Students’ Loyalty
Independent variables Student Apprentice
β t-value β t-value
Constant .065 .141 .633 1.406
Low entry qualification -.173* -1.909 .070 .824
Trainers credibility .021 .216 .229 1.646
Applicable courses content .337** 2.341
Training facilities and equipment .273** 2.498 -.224* -1.963
Qualification recognition .292** 2.520
Career and job potential .154 1.211
Work ethics and social values .238* 1.884 .543*** 4.321
F 16.773 18.045
R
2 .224 .484N
356 102Notes: *** p < .001, ** p<.05, *p<.10
5.0 Conclusion
Secondary school students and apprentices disagreed that TVET students are of low quality, delinquencies and problematic with low aspiration for further study. The findings indicated that apprentices tend to have better perception of the image of TVET than secondary school students. With regards to future intention, secondary school students demonstrated a lower loyalty to future TVET career compared to those at private training institutions. The results of the multiple regressions revealed that the images of TVET are directly related to students’ loyalty which is consistent with previous empirical research. Recognition of qualification, work ethics and social values and applicability of course content were considered major predictors of students’ loyalty. Therefore, efforts must be given in promoting TVET.
References
Ahmad S. (2001). Meeting the global challenges in technical and vocational education: the Malaysian experience,
UNESCO TEVT, Asia Pacific Conference. 26-28 March, Adelaide, Australia.
Alandas, S. N. (2002). Attitudes of Freshmen in Saudi technical colleges toward vocational-technical education. PhD
Dissertation: Ohio State University.
Ary, D., Jacobs, L.C., & Razavieh, A. (1996). Introduction to research in education, Ford Worth, Harcourt Brace College Publishers.
Beltram, P.K. (2007). Public perceptions of unified school district’s career and technical education programs. PhD
Dissertation, Northern Arizona University.
Dedeaux, G.J. (2005). Parent perceptions of vocational education: A comparative study between an urban school district and a rural school district in South Mississippi. PhD Dissertation: University of Southern Missisippi. DeLese, M.A. (2008). Identification and analysis of the factors influencing student preference in career vocational
training choice. PhD Dissertation: Temple University.
Falco, L.L. (2006). A quantitative study of image congruence theory as a predictor of college preference. Doctoral of
Business Administration: Anderson University.
Fong Chan Onn. 2006. Managing human capital in the globalised era. Public services conference, 21 August, INTAN Bukit Kiara, Malaysia.
Gay, L.R & Airasian, P. (2000). Educational research: Competencies and application,New Jersey, Prentice Hall. Gilbertson, C. (1995). Attitudes and perceptions held by parents toward vocational education: An assessment of
influential factors. Temple University.
Hoxter, H. (2002). Counseling and guidance: International perspectives, in Hiebert, B & Borgen, W. (ed), technical
and vocational training in the 21st century: New roles and challenges for guidance and counseling. Paris:
UNESCO.
Kanapathy, V. (1997). Labour market issues and skills training: Recent development in Malaysia. Pacific economic
cooperation council human resource development task force meeting, 30-31 May, Montreal, Canada.
Krejcie, R. V., & Morgan, D. W. (1970). Determining sample size for research activities. Educational and Psychological Measurement, 30, 607-610.
Lind, D.A., Mason, R.D., & Marchal, W.G. (2000). Basic statistics for business and economics,Boston, Irwin McGraw-Hill.
Malaysia. (2001a). Eight Malaysia Plan 2001-2005, Kuala Lumpur, National Printing Berhad.
Malaysia. (2001b). The Third Outline Perspective Plan 2001-2010, Kuala Lumpur, National Printing Berhad. Malaysia. (2002). Knowledge-Based Economy Master Plan, Kuala Lumpur, Institute of strategic and international
studies (ISIS).
McLafferty, C. L. (2006). The technical college image in South Carolina. PhD Dissertation: Clemson University. Pryor, W. D. (1983). A study of the attitudes of high school administrators, guidance counselors, and teachers in
Macogdoches County, Texas toward vocational education. PhD Dissertation: East Texas State University. Shelby, R. L. (2005). Attitudes of community college vocational teachers, academic teachers, counselors and
Shultz, F.A. (1969). Selected aspects of vocational image as perceived by a public categorized by occupational levels.
PhD Thesis: Oklahoma State University.
Tan, H.W., & Gill, I. S. (2000). Malaysia. In Gill, I, S.,Fluitman, F & Amit Dar (Ed), Vocational education and training
reform, New York, Oxford University Press. pp 218-260.
The Guardian. (2008). Parents stop children choosing vocational route. Tuesday March 11.
von Yeast, Y.C. (2007). Social skills: Identification of critical social abilities for high school students with mental retardation in the vocational setting. PhD Dissertation: Saint Louis University.
Wenrich, R. C. & Crowley, R. J. (1964). Vocational education as perceived by different segments of the population. University of Michigan: Ann Arbor.
Welch, N.T. (2004). An analysis of perceptions of technical education in South Carolina. PhD Dissertation: Clemson University.
Table
A
Image
Further Study
Field of Interest
Career Preference Priority Parent Student Apprentice Student Apprentice Student Apprentice Student Apprentice Student Apprentice
Low entry qualification
.039 .138 -.015 .1 10 -.010 .051 .030 .188 -.032 .149
Trainers credibility
.322 ** .374 ** .266 ** .390 ** .228 ** .451 ** .230 ** .553 ** .208 ** .545 **
Applicable courses content
.403 ** .479 ** .374 ** .484 ** .361 ** .535 ** .333 ** .595 ** .282 ** .498 **
Training facilities and equipment
.389 ** .319 ** .352 ** .239 * .317 ** .381 ** .344 ** .439 ** .325 ** .414 ** Qualification recognition .453 ** .466 ** .458 ** .590 ** .524 **
Career and job potential
.360 ** .542 ** .344 ** .560 ** .320 ** .567 ** .329 ** .604 ** .346 ** .599 ** W
ork ethics and social values
.389 ** .579 ** .337 ** .551 ** .320 ** .533 ** .313 ** .635 ** .332 ** .565 **
Note: *** p < .001, ** p<.05
Appendix
T
able B
Independent variables
Further
Study
Field of Inter
est Car eer Pr efer ence Priority Par ent Encouragement Student Appr entice Student Appr entice Student Appr entice Student Appr entice Student Appr entice Constant -.701 (-1.304) 1.000 (1.754) .143 (.270) .978 (1.739) .258 (.480) 1.090 (1.914) -.239 (-.426) -.843 (-1.470) .862 (1.613) .941 (1.976)
Low entry qualification
-.1 14 (-1.076) .102 (.954) -.219** (-2.096) .052 (.491) -.202* (-1.904) -.023 (-.215) -.1 10 (-.992) .144 (1.339) -.218** (-2.066) .073 (.821)
Trainers credibility
.140 (1.21 1) -.001 (-.007) .033 (.286) .188 (1.083) -.044 (-.376) .227 (1.293) -.004 (-.033) .360** (2.032) -.019 (-.164) .370** (2.518)
Applicable courses content
.368** (2.182) .430** (2.585) .502** (2.976) .313* (1.776) .070 (.415)
Training facilities and equipment
.323** (2.520) -.208 (-1.438) .266** (2.108) -.443** (-3.1 10) .196 (1.531) -.096 (-.663) .319** (2.379) -.228 (-1.567) .260** (2.040) -.146 (-1.208) Qualification recognition .222 (1.516) .354** (2.451) .216 (1.475) .413** (2.803) .253** (2.069)
Career and job potential
.039 (.265) .139 (.947) .130 (.873) .170 (1.096) .289* (1.955) W
ork ethics and social values