~
Economic and Social
Research Institute
SUBJECT AVAILABILITY AND
STUDENT PERFORMANCE IN THE
SENIOR CYCLE OF
IRISH POST-PRIMARY SCHOOLS
RICHARD BREEN
COUNCII,, 1985-1986
*T. K. WH ITAKER, M.SC. (ECON.), D.ECON., SC., LI,.D., Presidenl oJ’lhe bzslilule. * P. I,YNCH, M.A., M.R.I.A., Chairman oJthe Council.
1). J. BUCKI,EY, Vice Presidenl and General Manager, Merck, Shmp and Dohme (Ireland) Ltd., Co. Tipperao,.
I,. CONNEI~I,AN, B.E., C.ENG., M.I.E.I., Direclor General, Confederation of Irish Induslo,.
*SEAN CROMI EN, B.E., Second Secrelao,, Deparlmenl of Finance. G. 1)EAN, M.I)., F.R.C.P., Medico-~%cial Research Board.
N.J. GIBSON, B.SC.(ECON.), PH.D., Professor, Deparlmenl oJ’Economics, Universil_), of ~’lster, Colemine.
PATRICK A. HALL. B.E., M.S., DIP.STAT., Direclor oJResearch Inslilule of Public ,’1 dminishalion.
*W. A. HONOHAN, M.A., F.I.A.
MICHAEL F. KEEGAN, B.A., B.COMM., D.P.A., F.I.P.M., Secrelao,, Department of Labour.
*KIERAN A. KENNEDY, M.ECON.SC., B.PHIL., PH.D., Director oflhe Institute. T. P. I,INEHAN, B.E., B.SC., Direclor, Cenhal Slalislicr Office.
*I). 1". McALEESE, B.COMM., M.A., M.ECON.SC., PH.D., 1"l’hately P@ssorof 1)olilical Economy, 75inily College, Dublin.
*EUGENIc; McCARTHY, M.SC.(ECON.), D.ECON.SC., Director, Federated Union of Emplo,),ers.
JOHNJ. McKAY, B.SC., D.P.A., B.COMM., M.ECON.SC., Chief Executive Officer, Co. Cavan Vocaliolml Education Committee.
*J. I.’. MElgNAN, M.A., B.L.
* D. N EV I N, (.;eneml Secrelao,, hish Congress of Trade ~ 7nions. *TOM,~S F. O COFAIGH, Governor, Cenlral Bank.
JOYCE O’CONNOR, B.SOC.SC., M.SOC.SC., PH.D., Director, &ciaI Research Centre, Colh’ge of llumanilies, Nalional InsliluleJbr Higher Educalion, Limerick.
I). P. O’MAHONY, M.A., PH.D., B.L., ProJ’essor, Deparlmenl of Economics, Universily College, Cork.
LABHRAS 0 NUALLAIN, D.ECON.SC.
B. PAT’FERSON, B.A., M. I. I.E., A. I. P. M., Direclor General, Irish Management Inslilule. S. SHEI;;HY, B.AGR.SC., PH.D., Professor, Department of Apphed Agricullural Economics,
gStiver~iO, College, Dublin.
J. SPENCER, B.SC. (ECON.), Professor, Department of Economics, The Queen’s University qf Belfasl.
T. C. TONER, B.COMM., M.B.A., Managing Direclor, BH’G Lid.
* B. M. WALSH, B.A., M.A., PH.D., Professor, Nalional Economics of Ireland and Applied Economics, Unicel:rilr College, Dublin.
T. WAI,SH, M.AGR.SC., PH.D., D.SC., M.R.I.A.
*REX". C. K. WARD, B.A., S.T.L., PH.D., Professor, Deparlmenl oJSocial Science, Univer-sily College, Dublin.
P. A. WHITI’, B.COMM., D.P.A., Managing Director, In&tslrial Developmenl Authorily,
l)ublin.
SUBJECT AVAILABILITY AND STUDENT
PERFORMANCE IN THE SENIOR CYCLE OF
IRISH POST-PRIMARY SCHOOLS
Copies of this paper may be obtained from The Economic and Social Research Institute (Limited Company No. 18269). Registered Office: 4 "Burlington Road, Dublin 4.
SUBJECT A VAILABIL1TY AND STUDENT
PERFORMANCE IN THE SENIOR CYCLE
OF IRISH POST-PRIMARY SCHOOLS
RICHARD BREEN
© THE ECONOMIC AND SOCIAL RESEARCH INSTITUTE DUBLIN, 1986
I am gratefuI to the Department of Education for giving me access to the exami-nation data used in this study, and I particularly wish to thank Dr. Martin Newell and the staff of the Central Applications Office, Galway, who, with exemplary efficiency, provided me with these data.
Useful comments oll earlier drafts ofthis paper were received from my Insti-tute colleagues Denis Conniffe and David B. Rottman, and from the Depart-ment of Education, the Teachers’ Union of Ireland, the Irish Vocational Education Association, Terry Corcoran of the Youth Employment Agency, and from an external referee. I have also had useful discussions with’ Gary Keogh of the ESRI concerning the statistical issues raised in Chapter 3 of this study, and June Ryan provided invaluable programming assistance. To all these individuals and organisations I would like to extend my thanks; they, of course, are not responsible for any of the conclusions or views advanced in this paper.
General Summary
CONTENTS
Chapter 1
2
Introduction
Differences in the Availability and Take-up of Leaving Certificate Subjects
Senior Cycle Performance
Summary and Conclusions
References
Appendices 1
2 3 4
Mis-specification and Sample Selection Bias
Indirect School Effects
Indirect Effects Associated with Class Origins
Alternative Models of School Effectiveness
Page 1
22
57
90
98
I01
109
Table
1.1
1.2
1.3
1.4
1.5
1.6
2.1
2.2
2.3
2.4
2.5
2.6
2.7
Educational Level Attained Among Cohorts of Post-Primary Leavers According to Father’s Occupational Group, 1980-82 Weighted Aggregate Results (percentages)
Level of Education Attained According to Pupil Sex and Father’s Occupational Group (percentages)
Level of Education Attained According to School Type Weighted Aggregate Results 1980-82 (percentages)
Percentage Distribution of Second-Level Pupils According to Sex by School Type 1982-83
The Percentage Composition, at Inter Cert, of the Three Different School Types, According to Occupational Background, Among Each Sex
Number of Schools of Each Type in Sample and Distribution of Pupils Across Each School Type
Subjects Making Up Each Subject Group at Intermediate and Leaving Certificate Level
Percentages of Male and Female Leaving Certificate Candidates Taking Various Subjects According to Class Origins
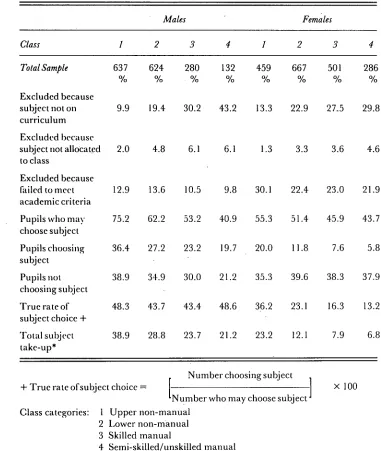
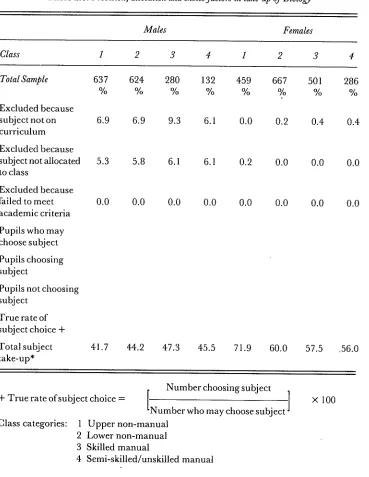
Provision, Allocation and Choice Factors in Take-up of Higher Maths
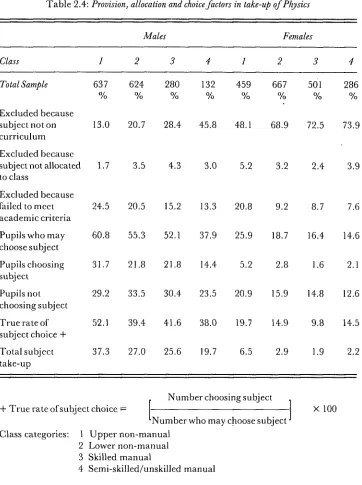
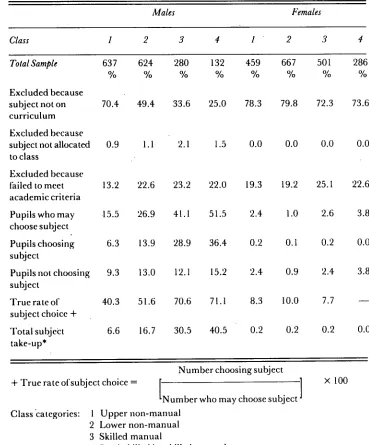
Provision, Allocation and Choice Factors in Take-up of Physics
Provision, Allocation and Choice Factors in Take-up of Chemistry
Provision, Allocation and Choice Factors in Take-up of Biology
Provision, Allocation and Choice Factors in Take-up of Technical Drawing
Page
10
11
13
13
15
21
26
28
30
31
32
33
2.8
2.9
2.10
2.11
2.t2
2.13
2.14a
2.14b
2.15
2.16
2.17
Provision, Allocation and Choice Factors in Take-up of Home Economics (Social and Scientific)
Provision, Allocation and Choice Factors in Take-up of French
Social Class Differences in Effects of Three Exclusionary Factors
Percentage Change in X2LR Associated with Class Eirects on Take-up Rates Controlling for Provision and Allocation (P) and Qualification (Q)
Mean Number of Subjects in Four Areas Taught in Schools, According to Sex and Parental Occupational Group
Mean Number of Leaving Certificate Subjects in Each Area Taught According to School Type
Mean Number of Subjects in Four Areas Taught in Schools According to Pupil Sex and Parental Occupational Group within Each School Type (Boys)
Mean Number of Subjects in Four Areas Taught in Schools According to Pupil Sex and Parental Occupation within Each School Type (Girls)
Mean Number of Subjects in Four Areas Taken According to Sex and Occupational Background
Correlations, Partial Correlations and Associated Significance Levels and Standardised Partial Regression Coefficients of SOCLASS on the Number of Subjects Taken by Pupils in Each Subject Area
Percentage of Social Class Difference in Mean Number of Subjects Taken in Each Curricular Area Attributable to the Effects of (i) Provision; (ii) Performance in Relevant Inter Cert Area; and (iii) Pupil Choice
35
36 38
43
45
46
47
48
50
51
53
3.3
3.4
3.5
3.6
3.7
3.8
According to Grade Point Average, Boys and Girls
Percentage Frequency Distribution of Number of LC Passes According to Pupil Sex
Percentage Frequency Distribution of LC Passes According to School Type and According to Occupational Group
Correlation Matrix, Exam Performance and Class, Sex and School Type
Regression Model Predicting Leaving Certificate Performance
Regression Results, Senior Cycle Performance, Boys and Girls
Maximum and Minimum Direct, Indirect and Total Effects of SOCLASS and Cultural Capital
59
61
61
62
65 84
87
APPENDIX TABLES
Appendix Table
A I Parameter Estimated for Prohibit Models of Probability of Attend-ing a Vocational School and a Community/Comprehensive School
A2 Unadjusted (Col. (1) and Adjusted (Col. (2)), Using Heckman’s Method, Regression of Level of Job Aspirations
A3 Minimum and Maximum Estimates of Direct, Indirect and Total Effects of School Type on Senior Cycle Performance
A4 Standardised Coefficients (Unadjusted) Used in Computing Direct and Indirect Effects of SOCLASS and Cultural Capital
A5 Estimated LCGPA for Average Pupil in Each School Type, using Results of Equation (1)
Page
106
ll0
lll
113
LIST OF FIGURES
Diagrammatic Representation of Model of Provision, Allocation and Choice Applied to One Subject
3.1 Relationship Between Performance and the Intermediate and
Leaving Certificate
3.2 Path Diagram of Effects on Outcome Measure
3.3 Model of Intermediate Certificate Performance
3.4 Model of Leaving Certificate Performance
3.5 Models of Intermediate and Leaving Certificate Performance
Page 25
63
68
75
75
This report focuses on senior cycle education in Irish post-primary schools and, specifically, examines two issues:
(i) the availability of various subjects and groups of subjects to pupils in the senior cycle and the level of subject take-up by pupils;
(ii) pupil academic performance within the senior cycle.
At present, approximately 60 per cent of entrants to post-primary education remain in school to sit for the Leaving Certificate. Thus, the majority of Irish children will experience senior cycle education and for most of them this will represent the culmination of their academic career. As a result the qualifica-tions that most pupils obtain in the senior cycle and the skills that they acquire there, will constitute the credentials they take with them into the labour market when they look for work. And, of course, for those who seek to continue to third level, Leaving Certificate performance is crucial if they are to achieve this.
Data
The data used in this study consist of the replies to a questionnaire adminis-tered to a sample ofjust less than 4,000 Leaving Certificate pupils in the period between January and April of 1981 together with the results they obtained in the Leaving Certificate examination in 1981. The questionnaire data were originally gathered as part of an earlier project dealing with sex differences in post-primary education (subsequently published as Schooling and Sex Roles: Sex
Differences in Subject Provision and Student Choice in Irish Post-Primary Schools by
D. Hannah, R. Breen, et al., 1983). As a result, many of the analyses and results of the present report are directly comparable with those of the earlier study.
Subject Availability and Take-Up
2 SUBJECT AVAII,ABII,ITY AND STUDENT PERFORMANCE
scope for variation both in the particular subjects provided and offered to students by schools, and in the subjects young people study. In Chapter 2 of this report we look at this variation, and in particular we examine, first, the extent to which boys and girls of different social class backgrounds study different sets of senior cycle subjects, and, secondly, how far this is due to variations in the availability ofsubjects to pupils of different social classes and how far to pupils’ own choices. In other words, we ask to what degree can social class differences in subject take-up be explained in terms of class specific patterns of subject choice and to what degree in terms of class specific patterns of subject availabil-ity?
We find that higher proportions of middle class than of working class senior cycle pupils take subjects such as Higher Maths, Physics and French, while Technical Drawing (TD) and Home Economics are taken disproportionately by working class pupils. More generally, the science subjects and modern languages are more popular among middle class pupils, while the technical subjects and, among girls, commerce subjects, tend to be taken by greater percentages of working class pupils. Furthermore, levels of subject provision show variations according to pupils’ social class origins. So, for example, while 87 per cent of male senior cycle pupils of upper non-manual (professional and
managerial) backgrounds are in schools teaching Physics, only 54 per cent of male senior cycle pupils of lower manual backgrounds are in this position.
In our investigation of class differences in the take-up of certain individual subjects we find that the importance of school influences and pupils’ choice vary, depending upon which particular subject we are examining. So, in French, Higher Maths (among boys) and Chemistry (girls only), pupils’ own choices are crucial: clear differences in the take-up of these subjects arise mainly because of class specific patterns of choice. On the other hand, in Physics, Chemistry and TD among boys and Higher Maths among girls, patterns of choice play little or no part in accounting for class differences in rates of take-up. Instead, school provision factors and the way that schools allocate subjects to pupils are crucial. In other words, if we look only at those pupils who are given the opportunity of taking, say, Physics, then we find relatively little differ-ence between social class origins in the proportions who avail of this opportun-ity. On the other hand, there are somewhat larger differences between social classes in the percentages of pupils actually given the option of Physics in the first place.
(e.g., the level of previous performance they require before they will allow a pupil to take a particular Leaving Certificate subject) and the ability of pupils of different social class origins to meet these requirements. At this level (i.e., the level of groups of subjects) pupil choice explains little of the variation in take-up between social classes.
Provision levels in particular subject areas seem to be a significant source of social class differences in subject take-up and we show that they come about in two ways. First, the distribution of pupils over the Secondary/Vocational/ Community and Comprehensive sectors is strongly related ’to sex and class origins: as a result the curricular characteristics of these different school types become, to some extent, the curricular characteristics of social classes. For example, because working class boys are more likely than any others to enter Vocational schools, so the mix of senior cycle subjects available to them depends very heavily (though not exclusively) on the nature of the curriculum in Vocational schools. But secondly, among those pupils in the Secondary sector, similar social class differences in subject availability persist, suggesting that, to a significant extent, the curricula of particular Secondary schools are related to the social class composition of their pupil body.
Senior Cycle Performance
In Chapter 3 we look at senior cycle academic performance, which is defined as the change in a pupil’s exam performance between the Intermediate and Leaving Certificate exams. We adopt this measure for the following reason: among pupils who remain at school to sit for the Leaving Certificate, their Inter Cert results may be seen as a measure of performance at the commencement of the senior cycle, while their Leaving Certificate results are a measure of perfor-mance at its conclusion. Thus, the difference, or change, between Inter and Leaving Certificate performance, is a measure of, among other things, the effect of senior cycle schooling.
4 SUBJECT AVAILABILITY AND STUDENT PERFORMANCE
a source of differences in exam performance that can be attributed to the type of school attended, per se (rather than to the.characteristics of pupils within them) and which would therefore persist, despite changes in the kinds of pupils coming into these schools?
It is important to note that the comparisons we draw in this respect in Chapter 3 are between the three school types taken on average, and not between individual schools. However, we feel that such a comparative study is valuable for a number of reasons, but particularly because it sheds light on arguments concerning the best means of organising a system ofeducational provision ~- an issue which has come to the fore in the proposals concerning Local Education Councils in the Department of Education’s recent Green Paper Partners in Education. Each of the three Irish post-primary sectors is diffe-rently organised: if we believe that any one of these structures or sets:oforgani-sational arrangements is better than any other, then it would seem natural to try to support the preference by showing that schools in that particular sector are, in some sense,better or more effective than schools in differently organised sectors. One useful index of this (bUt, obviously, not the only useful index) would be differences in the level of senior cycle effectiveness.
The conclusion we reach in Chapter 3 is that the majority of the differences in average senior cycle performance between pupils in the different types of school arises because of differences in the pupils in them rather than because of an)’ features ofthe school types themselves. Once we allow for these pupil differ,-ences, the type of school attended has little influence on senior cycle perfor-mance. Among boys there are no statistically significant variations as between performance in each of the three types. Among girls, there is one significant result: Vocational schools appear to depress senior cycle performance among girls, though, in substantive terms, this effect is quite small. Additional analyses carried out using a somewhat different methodology (reported in Appendix 4) give the same result.
Implications of Findings
The implications of our results for educational policy and for educational research are set out in Chapter 4.
The finding of little significant or substantive difference between school types in their senior cycle effectiveness does not necessarily mean that schools do not make a difference. Individual schools, of whatever type, may be particularly effective or ineffective, and perhaps the best way of improving the standards of schools generally would be to investigate and learn from such particular cases. What our findings do point to, however, is that no one of the three sectors (Secondary, Vocational, Community/Comprehensive) provides a form or model of post-primary schooling that is unequivocally or substantially better than another. In other words the different organisational or other distinctive and distinguishing features of the sectors do not appear to make them either more or less effective - at any rate when we measure effectiveness in terms of senior cycle examination results,
On the other hand, if our results cQncerning quantitative school effects in the senior cycle suggest that there is little to choose between the three sectors or models oforganisation, our results regarding qualitative effects in regard to the nature of the curricula of these schools show that there are important differ-ences in this respect. On average, Community/Comprehensive schools teach the largest number of senior cycle subjects and have better levels of provision in all of the four subject areas we identified (Sciences, Commerce subjects, Technical subjects and Modern Languages) than do Vocational or Secondary schools (except in Modern Languages where Secondary schools do best). Conversely, Vocational schools have the smallest curricula and the poorest levels of subject area provision in all areas except Technical subjects.
Such differences between the curricula of Secondary, Vocational and Community/Comprehensive schools are to be expected not alone because they have, to some degree, different educational aims, but also because of differences in their size, Community/Comprehensive schools being somewhat larger, on average, than others. However, because attendance at one type of school rather than another is class and gender related, these school differences in provision translate into gender and class differences in subject availability.
6 SUBJECT AVAILABII.ITY AND STUDENT PERFORMANCE
middle class, pupils. Conversely, subjects associated with third-level entry and with professional and technical jobs- notably the sciences and languages- are
much more likely to be taken by pupils from middle class backgrounds. It would, of course, be naive to suggest thatdifferences in subject provision levels are wholly responsible for this state of affairs. Nevertheless, differential provision levels are an important - possibly the single most important - factor
leading to this, and thus may contribute to an early narrowing of young people’s occupational horizons. The Department of Education has, for many years, sought to encourage schools in particular localities to co-operate in subject provision and, with varying degrees of success, has pursued a policy of
INTR OD UCTION
This paper is concerned with senior cycle education in Irish post-primary schools and, specifically, examines two issues:
(i) the availability of various subjects and groups of subjects to pupils in the senior cycle and the level of subject take-up by pupils;
(ii) pupil academic performance within the senior cycle.
At present, approximately 60 per cent of entrants to post-primary education remain in school to sit for the Leaving Certificate (Breen, 1984a)t. Thus, the majority of Irish children will experience senior cycle education and for most of them this will represent the culmination of their aqcademic careers (given that only about 37 per cent of those who sit for the Leaving Certificate go on to third-level education). As a result the qualifications that most pupils obtain in the senior cycle and the skills that they acquire there, will constitute the credentials they take with them into the labour market when they look for work. And, of course, for those who seek to continue to third level, Leaving Certificate perfor-mance is crucial if they are to achieve this.
Given that there are 32 recognised Leaving Certificate subjects, and that most pupils are actually examined in only about seven, there is obviously scope for wide variation in the particular subjects young people study. Furthermore, given that schools teach on average between 13 and 15 senior cycle subjects (Hannan, Breen, et al, 1983, p.171) there is also scope for variation in the particular subjects provided and offered to students. In Chapter 2 of this report we shall look at some of the variation in these issues. In particular we want to
8 SUBJECT AVAILABIIATY AND STUDENT PERFORMANCE
look at the degree to which boys and girls of different social class background study different sets of senior cycle subjects and how far this is due to variations in the availability of subjects to different social classes and how far to pupils’ own choices. In other words, ifwe find that, say, working class and middle class pupils sit for different subjects at the Leaving Certificate, to what degree can this be explained in terms of class specific patterns of subject choice and to what degree in terms of class specific patterns of subject availability?
In approaching our Second aim - the investigation of pupil academic perfor-mance insenior cycle - our particular interest lies in determining how far such performance is responsive to three main influences. These are, first, pupils’ sex; second, pupils’ socio-economic background (social class for short); and, third, the kind ofschool the pupils attend.
While much research has been carried out on sex and social class effects in education there are relatively few Irish studies which deal with the way in which schools and schooling may exert an influence on educational attainment. The chief exception to this is the work of Kellaghan and his associates (Kellaghan, Madaus, Rakow, 1979; Madaus, Kellaghan, Rakow and King, 1979; see also Gray, 1981, for a critique of some of this material). In addition there is a virtual absence of published research into the Leaving Certificate examination itself.2 On the other hand few people would dispute either that the Leaving Certificate exam is important in determining the labour market prospects of the majority of Irish school leavers, or that the kind of school a pupil attends will have important consequences for her or his educational performance.
In this paper we seek t0 answer some quite basic, but hitherto largely ignored, questions about factors influencing performance. For example: do girls perform better or worse than boys? Do Secondary school pupils obtain
better results, on average, than those in Vocational or Community schools? Is the education a pupil receives in one type of school better or worse than that available in another?
However, rather than simply looking at Leaving Certificate performance, the data we have (which are described later in this chapter) enable us to look at the
~’l’here are some pieces of pul’)lished research into the Leaving Certificate, but for the most part they address luestions not directly relevant to the purpose of this paper. For example, Greaney and Kellaghan (1977) is it largely descriptive account of the l.eaving Certificate with some discussion of the predictive validity of the exant 1in" third-level perl(~rnli|uee. Similarly, ~.|Ol’itu alld (]l’owley (1978/79) looked at the relationship
between leaving Certificate perfiwmance, its indexed by dif[~’reut points scoring systems, and first year university perll)rmauce. Many oftfie papers in Coolahan (1979) address similar questions. Finally, Madaus and MacNamara (1970) concentrate on issues such as marker reliability and the question of the kinds of knowledge that the l,eaving Certificate tests.
effects of senior cycle schooling, in the following sense. The Intermediate Certificate results of pupils who then go on to sit for the Leaving Certificate can be taken as a measure of performance at the start of senior cycle. Equally, the Leaving Certificate measures performance at the end of the senior cycle. It follows, therefore, that the difference between the two is a measure of the change in performance over the period of (generally) two years spent in the senior cycle and is, therefore, a measure of the effects of senior cycle schooling.
The analyses of senior cycle schooling using this measure are undertaken in Chapter 3, where our central aims will be to compare avarage pupil perfor-mance over the three school types (Secondary, Vocational and Community/ Comprehensive) and to assess the effect of the different types of school (rather than of individual schools) on performance. In Chapter 4 we summarise our findings and discuss what policy conclusions they point towards.
In the remainder of the present chapter we seek to do three things. First, we want briefly to review what is already known about sex, socio-economic background and school type effects on educational attainment in Ireland. We shall find that most research has in fact dealt with differences in participation rates rather than in examination performance. Secondly, we shall discuss some of the conceptual and, particularly, the methodological issues surrounding the measurement of the effects of schooling on pupils (or, as it is sometimes termed, the "school effectiveness debate"). Thirdly, we want to address the question of why we should expect sex, socio-economic group and school type to influence exam performance; and, lastly, we describe the data used in this study.
Sex, Socio-Economic Background and School Type
What we already know of the effects of sex, socio-economic background and school type can be summarised quite simply:
Educational participation levels vary by pupils’ sex, social class origins and according to school type. Males and females have different levels of participa-tion in the post-primary system with a higher percentage of each female entry cohort remaining to sit for the Leaving Certificate. For example, estimates by Breen (1984a, p.105) show that among the 1976-77 entry cohort to post-primary education, 69 per cent of females and 50 per cent of males remained at school to sit for the Leaving Certificate. This greater participation of girls at senior cycle has been a feature of the post-primary system since the mid- 1960s.
l0 SUBJECT AVAIl,ABILITY AND STUDENT PERFORMANCE
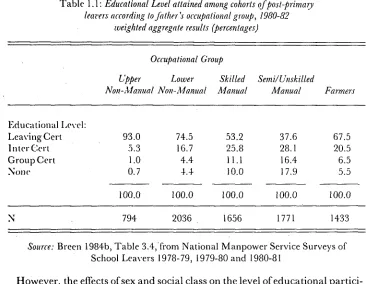
[image:21.474.72.438.195.479.2]class school leavers.3 This table shows that, on average, over the cohorts who left post-primary school in the years 1978-79 to 1980-81, virtually all those leavers whose father was in an upper non-manual (Le., professional, executive or managerial) job left after having sat the Leaving Certificate. At the other extreme, among pupils whose father was a semi-skilled or unskilled labourer, only a minority (38 per cent) left having sat for the Leaving Certificate, and almost a fifth (18 per cent) left having sat for no exam whatsoever.
Table 1.1 : Educational Level attained among cohorts of post-primary leavers according to father’s occupational group, 1980-82
weighted aggregate results (percentages)
Occupational Group
Upper Lower Skilled Semi~Unskilled
Non-Manual Non-Manual Manual Manual
Educational IJevel:
I,eaving Cert 93.0 74.5 53.2 37.6 67.5
Inter Cert 5.3 16.7 25.8 28.1 20.5
Group Cert 1.0 4.4 11.1 16.4 6.5
Ntme 0.7 4.4 l 0.0 17.9 5.5
100.0 100.0 100.0 100.0 100.0
N 794 2036 1656 1771 1433
Source: Breen 1984b, Table 3.4,from National Manpower Service Surveys of School Leavers 1978-79, I979-80 and 1980-81
However, the effects of sex and social class on the level of educational partici-pation interact so that working class girls are much more likely to stay at school longer than working class boys. This can be seen in Table 1.2 which is a further elaborated version of Table 1.I. Among all of the occupational groups STables 1. i, 1.2 and 1.3 are based on data collected by the National Manpower Service’s annual survey of school leavers 1980, 1981 and 1982. Each year in May/June a sample of a little over 2,000 young people who left post-primary school in the previous academic year are interviewed. These young people have left school at all stages of their post-primary career, and while most are in the labour market at the time ofthe interview, about a quarter are in third-level or other post-school full-time education. The samples are, therefore, representative ot* the annual outflow fi’om the post-primary system. The figures presented in these three
identified there, females are more likely than males to leave school after rather than before the Leaving Certificate and this is especially marked in the case of farmers where females are over 11/2 times as likely to leave school after the Leaving Certificate as are males. A higher percentage of males leave school at all levels before Leaving Certificate but particularly after the Group Certificate which is of less importance as a specifically terminal exam among females: indeed a higher percentage of girls leave with no qualification than leave after the Group Certificate.
Table 1.2: Level of education attained according to pupil sex and father’s
occupational group (percentages)
Leaving Intermediate Group No
Certificate Certificate Certificate Exam N
Higher M 89.8 7.6 1.9 0.6 380
Non-manual F 95.8 3.3 0.1 0.8 414
Lower M 68.0 20.3 6.8 4.9 1,075
Non-manual F 81.8 12.7 1.7 3.8 962
Skilled M 43.8 30.0 15.0 11.3 894
Manual F 64.5 20.5 6.4 8.5 763
Semi/Unskilled M 29.2 30.1 23.5 17.2 936
Manual F 47.0 25.9 8.6 18.5 835
Farmers M 54.3 27.3 10.4 8.0 721
F 80.8 13.7 2.4 3.1 712
Source: Re-analysis of NMS school leaver surveys 1980-82, weighted to give
equal weight to each survey.
School type is also related to participation levels with fewer entrants to Vocational schools in particular going on to sit for the Leaving Certificate compared with a very high percentage of Secondary school entrants. Evidence for this is given in Table 1.3 (again taken from Breen, 1984b) wlaich shows that among recent cohorts of post-primary school leavers, those who leave before the
Leaving Certificate are drawn largely from the Vocational and Community/ Comprehensive sectors while those who have sat for the Leaving Certificate are
12 SUBJECT AVAILABILITY AND STUDENT PERFORMANCE
who have sat for the Leaving Certificate. Conversely, Vocational school leavers account for 33 per cent of the total, but only 20 per cent of those with the Leaving Certificate and 62 per cent of those who sat for no exam. At least two reasons for this pattern can be pointed to. First, the different sectors of the post-primary system traditionally have different orientations, despite some recent convergence in their curricula and goals. A Vocational education for males, for example, has been associated with entry into manual work possibly via an apprenticeship taken up after the Group or Intermediate Certificate. On the other hand, Secondary education has been viewed as more academic leading to a non-manual job or to post second-level education.
Secondly, but not unrelatedly, the kinds of pupils found in schools in the different sectors are quite dissimilar. The distribution of pupils across the three major types of post-primary school is strongly influenced by sex and social class origin. In 1981/82, as Table 1.4 shows, almost three-quarters of girls in post-primary education were in Secondary schools with only about one in six in Vocational schools. Among boys, Vocational schools were more popular accounting for almost 30 per cent of male pupils, the Secondary schools being correspondingly less popular. Community and Comprehensive schools were
approximately equally popular with both sexes.
Pupils are differentially distributed across the three school types according to social class. Working class and small farm pupils are concentrated in Vocational schools while children of middle class families are more likely to attend Secondary school (Rottman and Hanna, et al. 1982, 1981; Hannan, 1968, p.345; Greaney, 1973, p.74; Greaney and Kellaghan, 1984; Hannan and Breen, el al. 1983; Breen 1984b). Table 1.5 is taken from Hannan and Breen et
a/. (1983, p.90) and shows the composition of the school types according to
Table 1.3: Level of education attained according to school type weighted
aggregate results 1980-82 (percentages)
Level of Education
All Leaving Intermediate Group
School Type Levels Certificate Certificate Certificate None
Secondary 56.9 71.7 44.9 11.0 26.2
Vocational 32.9 19.6 41.6 78.2 62.2
Community 10.2 8.7 13.6 10.9 11.6
Total 100.0 100.0 100.1 100.1 100.0
N 4,779 1,631 670 666
Source: Breen 1984b, p.101 Table 6.2
Table 1.4: Percentage distribution of second-level pupils according
to sex by school type, 1982-83
Male Female All
Secondary and Secondary Top 58.8 72.5 65.9
Vocational 29.7 18.3 23.9
Community/Comprehensive 11.5 9.1 10.3
Total I00.0 99.9 100.1
N 152,363 161,253 313,616
Source: Department of Education Statistical Report 1982-83, p. 101, Table 17.
14 SUB.JECT AVAILABI LITY AND STUDENT PERFORMANCE
of early school leaving. However, even allowing for this, middle class boys are over-represented (and working class boys under-represented) in Secondary schools to a much greater extent than are middle class girls.
We have already pointed out that males and working class pupils are more likely to leave school early and the cohorts entering Vocational schools have a disproportionately high share of such pupils. Furthermore, entrants to these schools are generally of lower perceived ability as a number of studies have shown (Greaney, 1973; Hannan and Breen, el al., 1983, Chapter 4).
Previous research, then, has shown that sex, social class origins and the type of school attended, are all associated with level of educational attainment. It follows from this that in examining I,eaving Certificate or senior cycle perfor-mance among any cohort of pupils we are dealing with a sub-section of the post-primary school population who have been quite stringently selected. Thus, those who sit for the Leaving Certificate are disproportionately (when comparedwith the overall post-primary population) female, middle class and Secondary educated. In examining sex, class and school effects on Leaving Certificate performance we are putting aside from consideration the effects that these three factors have in determining who gets as far as the Leaving Certifi-cate in the first place. For these reasons then - that is because these variables will have had such marked influences long before the senior cycle - we might expect that their effects on performance at this level would be relatively modest.
Effects on Academic Performance
As part of their study Equality of Opportunity in Irish Schools Greaney and Kellaghan (1984, ppi175-181) report no significant correlations between Leaving Certificate performance, and, respectively, sex, school type (Voca-tional or Secondary) or their measure of socio-economic status. This is somewhat surprising on apriori grounds, which lead us to hypothesise that, for example, working class pupils will tend to perform more poorly than will young people of middle class origins. Of course, among males especially, a high percentage of working class entrants to second-level education will have left school without ever reaching the Leaving Certificate. Thus, those working class male pupils who do get to the Leaving Certificate should be a more highly selected group than, say, their middle class counterParts. On this basis we should expect that class differentials in performance at this level, although present, wotfld be less than they would be if all pupils who entered the post-primary system eventually sat for the Leaving Certificate.
Table 1.5: The percentage composition, at Inter Cert, of the three different school types, according to occupational background, among each sex
Secondary Vocational Community Total
Occupational F M F M F M F M
Backgroundof % % % % % % % %
Pupils*
1. Upper Middle 18 32 8 9 13 15 16 25
2. Lower Middle 38 40 22 28 31 33 35 36
3. Upr. Working 26 18 31 32 31 27 27 22
4. Lr. Working 19 11 39 31 26 26 21 17
Total % 100 100 100 100 100 100 100 100
Number 2,223 2,015 250 587 282 431 2,755 3,033
*(1) Professionally qualified, managerial or executive positions and farmers with over 100 acres;
(2) Senior supervisory, intermediate non-manual workers, and farmers 50-100 acres; (3) Skilled manual workers; and farmers 30-50 acres;
(4) Semi- and unskilled manual workers, and farmers under 30 acres.
Source: Hannan and Breen et al., 1983, p. 90, based on responses of a 1981 national sample of pupils in Inter Cert classes.
which this selection is made (such as class origins) are not entirely related to ability, nevertheless, the overall level of performance among the smaller group of male candidates should be a little higher than among the larger group of female candidates.
16 SUBJECT AVAILABII.ITY AND STUDENT PERFORMANCE
pointed out earlier, our concern in Chapter 3 will be less with Leaving Certifi-cate performance per se than with senior cycle performance: i.e., the change in performance attributable to the period spent in the senior cycle. Since this is a
difference measure, the effects of variables such as sex on senior cycle
perfor-mance will themselves be measures of the difference between the effect of sex on the later (Leaving Certificate) exam and its effect on performance in the earlier (Inter Cert) exam. This technical issue will be clarified in Chapter 3: the point we wish to make here is that while we should expect, and indeed do, find that our variables have clear effects on Leaving Certificate performance, their influ-ence on senior cycle performance will be much weaker and may even be absent.
School Effectiveness
Additional complications and difficulties arise when we try to determine whether or not the kind of school a pupil attends exerts an independent influ-ence oll her or his academic performance (or, indeed, on any other measure of schooling "outcome"). In the context of this study by "kind of school" we mean Secondary, Vocational and Community/Comprehensive and when we discuss "school effectiveness" we refer to differences in the "effectiveness" of school types taken on average rather than to individual schools taken singly. Of course there is no reason why subsequent research should not focus on the relative effectiveness ofdifferent sorts ofschool types- e.g., fee charging as against Free Scheme schools, or schools run by the various religious denominations. At present we are concerned with the sectoral comparison for a number of reasons, which are discussed in Chapter 3. However, it is important to note at the outset that we do not seek to draw comparisons between specific Vocational, Commun-ity and Secondary schools; rather we are examining differences in the effective-ness of these school types taken on average.
To do this, however, we must first tackle some methodological problems. The issue ofschool effectiveness is one of the most debated topics in the socio-logy ofeducation. Put crudely, the point at issue is whether, and to what extent, and by what means, individual schools, or types of schools, exert an influence on the performance of pupils within them. In studies of school effectiveness, performance can be measured in a variety ofways - by results in public exami-nations (Rutter, et al, 1979; Madaus, Kellaghan, Rakow and King, 1979), by. performance in standardised tests (Coleman, et al, 1966;Jencks, 1972; Bidwell and Kasarda, 1975), by the attainment by pupils of a particular level of educa-tion (Hout and Raftery, 1985) or, more diffusely, in terms of indices such as delinquency levels and forms of employment obtained by school leavers (Rutter, et al., 1979, pp. 47-49).
appeared to show that "schools bring little influence to bear on a child’s achievement that is independent of his background and general social context" (Coleman et al., 1966, p.325). In the late 1970s and early 1980s, however, prominence was given to research which attributed greater importance to the process of schooling (Coleman, Hoffer and Kilgore, 1982; Madaus, Airasian and Kellaghan, 1980). As Rutter, et al., (1979, p.1) put it:
Schools do... have an important impact on children’s development and it does matter which school a child attends.
In the United States, the later Coleman study sparked a good deal of debate (e.g., Harvard Educational Review, Vol. 51, No. 4, 1981) centering around Coleman, et al’s (1982, pp. 179-181) conclusion that private schools provide a better education than public schools, or, in other words, that private schools have an independent positive effect on performance when compared with public schools. In Britain, Rutter, et al’s (1979) conclusions with regard to school effectiveness have been challenged (Heath and Clifford, 1980; 1981 ), but a wider controversy has surrounded the report Standards in English Schools
(Marks, Cox, Pomian-Srzednicki, 1981). Among other findings, this report claims that selective schools have positive effects on pupil performance while non-selective (i.e., comprehensive) schools lead to pupil under-achievement (Marks, et al., 1983, p.l16). The ensuing debate was widespread (see, for example Journal of the Royal Statistical Society Series A, Vol. 147, Part 4, 1984) and in some cases has broadened into a more general discussion of the methodology of inter-school comparisons (Oxford Review of Education, Vol. 10, No. 4, November 1984).~
At least two critical issues have arisen in these long-standing debates. First, even that research which claims to have isolated a school effect often produces measures of this effect that suggest it is quite weak, and, indeed, as Murphy (1985, p. 113) has pointed out, some supporters of school effectiveness (e.g., Maughan, et al., 1980) have found school effects that differ very little in magnitude from those isolated by researchers who argue against any school effectiveness. For example, Rutter’s corrected data suggest that about 8 per cent of between school variance in attainment is attributable specifically to school effects, while Jencks (1972), arguing against school effects, puts it at 2 per cent. Thus it is important to distinguish between the existence of a school effect (perhaps judged on statistical criteria) and the magnitude of this effect.
Second, and related to the first point, although there is ample evidence that schools differ in, for example, the average levels of attainment among their pupils, uncertainty surrounds the question of whether and to what degree this 5A survey and critique of several school effectiveness studies will be found in Gray (1981). Guttance (1985)
18 SUBJECT AVAII,ABILITY AND STUDENT PERFORMANCE
is due to characteristics of schools and their schooling process per se, or to the characteristics of the pupils in them. Thus the adjective "independent" in our earlier quotation is crucial. If we are to argue for a school effect we must be able to show that it is independent of the characteristics of schools’ pupils. In their study of the Irish post-primary system Greaney and Kellaghan (1984, p.255) make this point succinctly:
It is difficult to distinguish between the effects of attendance at a school as such and the effects of the characteristics of students who attend different kinds of schools. For example, the particular advantages associated with attendance at a private primary school may be the higher ability and socio-economic status of the students who go to such a school rather than to the education provided by the school.
The most commonly utilised means of controlling for pupil differences in the estimation of school effects simply involves entering into the analysis a number of background variables characteristic of pupils (or, in studies at a school or higher level of aggregation, measures of pupil composition) such as ability at entry to school, social class background, etc., (e.g., Coleman, et al., 1981, Ch. 6). Attempts to utilise control variables in this manner show surprisingly diffe-rent levels of thoroughness: for example, Coleman, et al., (1981, pp.235-243), analysing data at the individual level, use 17 control variables, whereas Marks,
et al., (1983, p.45) using data at Local Education Authority (LEA) level,
include only 4 such variables in their regression analyses.
This method of controlling for background variables, however extensive, is unlikely to prove completely satisfactory because of the existence of variables unmeasured by the researcher which influence both the outcome variable and the type of school the pupil attends. To give a simple example: as Heath and Clifford (1981, p.33) note in their discussion ofRutter, et al (1979) work, the latter controlled for parental occupation and the pupil’s verbal reasoning score on entry to the school, but they did not take into account differences between pupils in parental interest, a factor which is related both to outcome measures and to the school attended.
school, and those same factors which influence choice of school may also be expected to influence examination performance. This problem - technically referred to as self selection - means that it is very difficult to disentangle educa-tional effects on pupils due to a particular kind of school from effects which are attributable to those factors of the pupils’ home background which are associated with the choice of that kind of school in the first place (Murnane, 1981, p.485; Barnow, Cain and Goldberger, 1980, pp.43-59).
The difficulties of making estimates of school effects - which is part of a more general problem termed "sample selection bias" (Heckman, 1976, 1979) -will be discussed more fully in Chapter 3. Our present discussion, however, should alert us to the dangers of drawing incautious conclusions on the basis of differ-ences in the average level of exam performance between schools and types of schools.
Data and Variables
The data used in this study consist of the replies to a questionnaire adminis-tered to a sample of just less than 4,000 Leaving Certificate pupils in the period between January and April of 1981 together with the results they obtained in the Leaving Certificate examination in 1981.
The questionnaire data were originally gathered as part of an earlier project dealing with sex differences in post-primary education (subsequently published as Schooling and Sex Roles: Sex Differences in Subject Provision and Student
Choice in Irish Post-Primary Schools by D. Hannan, R. Breen, et al., 1983). As part
of this project a sample was drawn of 102 Irish schools in which questionnaires were to be administered to all senior cycle pupils scheduled to sit for the Leaving Certificate in 1981. This sample of schools was stratified by religion, whether fee-paying or not, size and sex mix of the pupil body, to be representa-tive of all 850 post-primary schools in the Irish Republic (except in the case of Community/Comprehensive schools which were over sampled, having twice their representation in the sample as in the population). Details of the sampling procedure can be found in Hannan and Breen, et al., (1983, pp. 23-29).
Of these 102 schools, two had closed in the previous year and five refused us access, leaving a sample of 95 schools of which one refused access to the Leaving Certificate pupils while another seven had no Leaving Certificate class in the year 1980/81.
The questionnaire administered to the Leaving Certificate pupils in the remaining 87 schools was reproduced as Appendix 1 of Hannan and Breen, et
al., (1983, pp. 331-352). It contained items relating to background information
2O SUBJECT AVAILABILITY AND STUDENT PERFORMANCE
large number of items dealing with the pupils’ own attitudes towards school and towards aspects of the schoofing process. The final sample size was 3,967. In 1983 the Leaving Certificate results for each of the pupils to whom a questionnaire had been administered were added to the questionnaire data. These examination results were obtained from the Central Applications Office in Galway with the permission of the Department of Education. The matching of Leaving Certificate results with the questionnaire data led to a loss of 17 cases, the majority of whom had no leaving Certificate record, from which we assume that they did not sit for the examination. The final sample size for the present study, therefore, is 3,950.
The sample has also been weighted to counter the over-representation of pupils in Community and Comprehensive schools, giving a weighted sample size of 3,680 made up of 1,715 males and 1,965 females. Table 1.6 shows the distribution of males and females across the three school types in the sample. The vast majority of pupils were in Secondary schools (82.4 per cent of the sample) although boys were clearly less heavily concentrated in Secondary education (79 per cent in Secondary schools) than girls (85 per cent).
In addition to describing the data on which this study is based, we shall take this opportunity to describe the measure of social class or socio-economic background, which we use in this study. As in the previous publication using these data (Hannan and Breen, et al., 1983) we adopt the Hall-Jones scale (Hall and Jones, 1950). Strictly speaking the Hall-Jones scale has been advanced as measuring occupational status or prestige: however, here we follow Whelan
(I 980, p. 22) who argues that it is better viewed as an occupational classifica-tion.
The categories of the full 8-point Hall-Jones scale are as shown below. The allocation of farmers to the categories has been made to suit Irish circumstances. The full sets of occupations making up each category may be found in Oppenheim (1966, pp. 276-284).
1. Professionally qualified and Higher Administrative, plus farmers with more than 100 acres.
2. Managerial and Executive;
3. Inspectional, Supervisory and other Non-Manual (Higher grade) plus
farmers with 50-100 acres;
4. Inspectional, Supervisory and Other Non-Manual (Lower grade);
5. Routine non-manual;
6. Skilled manual plus farmers with 30-50 acres;
7. Semi-skilled manual plus farmers with less than 30 acres;
It follows that the Hall-Jones categories are probably not, in a strict sense, classes as this word is used by authors such as Giddens (1973) and Goldthorpe (1980). Therefore, we use the word "class" to refer to the manual/non-manual distinction between Hall-Jones groups 6, 7 and 8 on the one hand, and 1 to 5 on the other. This simple two class model thus postulates a middle-class (non-manual) and a working class ((non-manual).
The middle classes, then, will have low scores on this scale, the working classes high scores. In our analyses in Chapters 2 and 3 we use the Hall-Jones scores as a scale, rather than as forming separate categories.’Thus we assume that our dependent variables are linearly related to the scale scores and we make no allowance for non-linearities.
Table 1.6: Number of schools of each type in sample and distribution of pupils across school types
School Type
Secondary Vocational Community~Comprehensive
Schools 56 23 8
Male Pupils 1351 223 141
Female Pupils 1680 155 130
Total Pupils 3031 378 271
Note: All tables presented weighted figures unless otherwise stated.
In some of our tabular analyses we group the Hall-Jones categories into four, largely for the sake of ease of interpretation. These are (with the constituent Hall-Jones categories in parentheses).
1. Upper non-manual or upper middle class (1 and 2); 2. Lower non-manual or lower middle class (3, 4, 5); 3. Skilled manual or upper working class (6);
4. Semi-skilled and unskilled manual or lower working class (7 and 8). Outline of the Paper
Chapter 2
DIFFERENCES IN THE AVAILABILITY AND TAKE-UP OF LEA VING CERTIFICATE SUBJECTS
In this chapter we look at differences in subject take-up in the senior cycle and we seek to account for these differences in terms of a model of provision, allocation and choice, which is described below. We first focus on the availabil-ity and take-up ofseven individual subjects, then we move on to look at groups ofsubjects. Our particular concern is with the extent to which subject availabil-ity and take-up show consistent variation among pupils from different social class origins and the degree to which, as a result, senior cycle education shows qualitative differences according to pupils’ social class background.
Subject Availabilily and Choice
According to the Department of Education (1971, p. 12) the aim of post-primary education is the "optimum personal fulfilment" of each child. If this aspiration is to be realised, however, it would seem necessary that schools give expression and accord recognition to the diverse talents and abilities oi~ their pupils. The extent to which this is achieved depends upon the kinds of subjects that are established within the educational system: in other words the kinds of abilities that are publicly attested to and "certified" depend, for the most part, upon the particular set of subjects that are recognised for examination
purposes.
But even within this set of subjects, limitations are imposed on reaching the ideal of optimum personal fulfilment, since not all pupils have access to all the available junior and senior cycle subjects: so, for example, girls who may have practical technical abilities are unlikely to find an outlet for them because almost no girls’ schools teach subjects such as Mechanical Drawing, Metal-work, WoodMetal-work, Technical Drawing, Building Construction or Engineering Workshop and within coeducational schools girls are often excluded either explicitly or implicitly from taking these subjects (Hannan and Breen, et al.,
Of course, no school can offer all possible subjects to its pupils. For one thing Irish schools are not large enough to teach the full range of subjects and, as well as this, very few schools are likely to be able to offer a particular subject simply to meet the demands of a handful of pupils.
Schools, therefore, vary in their curricula and because of this pupils in post-primary education will not have access to the same set of subjects. This is particularly true of the senior cycle where the core component of the curriculum is small and there is, as a result, more scope for variation between schools in the subjects they teach and between pupils in the subjects they take.
Such variation is, of course, inevitable, given that the educational system operates with finite resources, and if this variation were purely random it would give us little or no cause for concern. However, we already know that it is not random: there are, for example, marked differences in subject availability and take-up according to sex (Hannan, Breen, etal., 1983, Chapter 5). Here we shall seek to identify similar non-random variation according to pupils’ social class background. Thus, we shall be asking, implicitly at least, questions such as "are working class boys more likely than middle class boys to have the opportunity of taking Technical Drawing, and if so, are they more or less likely to avail of this?"
Schools vary not only in their curricula but also in the way they allocate subjects to pupils. The fact of a subject’s being on the curriculum does not ensure that it will be offered to all pupils in the school. We have previously termed such school decisions regarding who is allowed to take a particular subject and the way in which it is offered to pupils (as an obligatory or optional subject, for example) as school allocation as distinct from subject provision which refers to whether or not the subject is taught in the school (Hannan and Breen,
et al., 1983, Chapter 5). For example, although a school may teach Technical
Drawing, not all pupils in the senior cycle will necessarily be allowed to take it: so it may not be offered to girls, or it may be offered to lower stream pupils in place of, say, Physics, which is offered to higher stream pupils. Equally it may only be open to pupils who have already sat for, and perhaps only those who received a certain grade, in Inter Cert Mechanical Drawing. Even when a subject is made available to pupils the basis of its availability may differ: for some it might be optional while for others it may be compulsory (part of the core).
24 SUBJECT AVAILABILITY AND STUDENT PERFORMANCE
as Physics or Technical Drawing. Now we seek to discover, using the same analytical model, if comparable differences exist between pupils of different class origins.
Ifa pupil is in a school teaching a given subject and if he or she is allowed to choose that subject, it does not follow that all who are given the option will take it up; therefore, we also want to look at class differences in pupil choice of subjects. Ifa middle class pupil is given the choice of a particular subject is he or she more or less likely to take it up than would be a working class pupil under the same circumstances? The analysis of these three factors - provision,
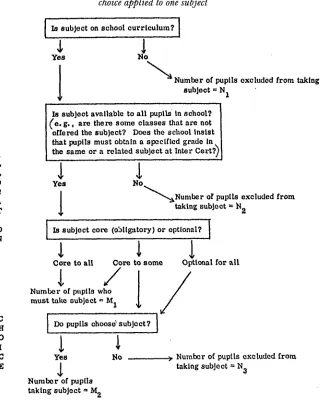
alloca-tion and choice - is carried out for seven subjects. The relaalloca-tionship between provision, allocation and choice is shown diagrammatically in Figure 2.1. As shown here, this model enables us to determine for any group of pupils, the relative importance of these three factors in the final take-up of a subject. So, the number of pupils who cannot take the subject because it is not provided (i.e., not on the curriculum) is labelled N,. The number who cannot take it because, despite its being on the school curriculum, it is not available to them, is labelled
N2. Finally, the number who could take the subject if they wished but choose not to, is N~. On the other side of the coin, the number who must take the subject because it is obligatory is labelled M,, and those who choose to take it, M2. Overall, the take-up rate of the subject is simply M, + M2 divided by the total sample (= M, + M,, N~ + N~), while what we have earlier termed the "true rate of subject choice" (Hannan and Breen, et al., 1983, p. 133). - that is to say, the percentage of those to whom the subject is available who actually choose it
- is, M, divided by M2 + N~, or in other words, the ratio of take-up to
availabil-ity.
The seven subjects analysed are, Higher Maths, Physics, Chemistry, Biology, Technical Drawing, French and Home Economics (Social and Scien-tific). With the exception of French these subjects were chosen because they had previously been analysed in this way to investigate sex diffei’ences in provi-sion, allocation and choice (Hannan and Breen, et al., 1983, Chapter 5). Thus the analysis in the first half of this chapter is directly comparable to that -although here our emphasis is on class rather than sex differences in subject availability and take-up. Using a simple model of provision, allocation and choice we shall attempt to gauge the importance of each in determining the level of take-up of these subjects among pupils of each social class category.
P 11 0 V
I S
I
O
[image:36.476.62.383.96.499.2]N
Figure 2.1 : Diagrammatic representation of model of provision, allocation and
choice applied to one subject
IS subject on school curriculum? ]
,
1
Yes No
~ Number of pupils excluded from taking subject = Nl
IS subject available to all pupils in school? I (’e.g., are there some classes that are not [ offered the subject? Does the school Insist |
I
that pupils must obtain a specified grade In [ the same or a related subject at Inter Cert?)/ A
$
L
,.
1
1
0 Yes No
C
/ Number or pupils excluded from taking subject = N2
T
O Is subject core (obligatory) or optional?
N
Core to al| Core to some Opttc~ml for all
Number of pupils who must take subject = M1
°
I
H Do pupils choose~ subject? O
C Yes No
E
1
Number of pupils taking subject = M2
>, Number of pupils excluded from taking subject = N3
Number of pupils excluded from subject because o~:
lack of provtstoa = N1 lack of allocation = N2 choice = N3
Total taking subject = MI (core) + M2 (optional)
26 SUBJECT AVAILABILITY AND STUDENT PERFORMANCE
Table 2.1 : Subjects making up each subject group at Intermediate and
Leaving Certificate Level
Intermediate Leaving Subject Group Certificate Certificate
Sciences Higher Maths
Science
(]onllllerce COlrllllerce
Modern Languages
Technical
French, Spanish,
German
Mechanical Drawing, Woodwork, Metalwork
Higher Maths, Physics, Chemistry, Biology,
Physics and Chemistry, Applied Maths
Accountancy,
Business Organisation Economics
French, Spanish, German, Italian
Technical Drawing, Building Construction, Engineering Workshop
importance of factors such as provision levels in accounting for the number of subjects of each group taken by pupils. The subjects which we define as making up these groupingsat both Leaving and Inter Cert are shown in Table 2.1.
In general, we have counted the most common subjects in each area to repre-sent the number of subjects of that type a pupil is taking. So, for example, the number of Science subjects taken at Leaving Certificate is based on Higher Maths, Physics, Chemistry, Biology, Applied Maths and Physics and Chemis-try. This measure, therefore, takes no account of whether or not a pupil is taking subjects such as Mechanics, or Agricultural Science. However, these subjects are taken by so few candidates that their exclusion is unlikely to lead to any erroneous results."
Clearly the sciences, languages, technical and commerce subjects do not exhaust the areas examined in the Leaving Certificate. They do not, for example, include the Classical Languages, Irish or English; the humanities -History and Geography; the arts - Art and Music; or the Home Economics subjects. However, they do provide a set of measures based for the most part on commonly taken subjects and they represent some - though not all - of the
major dimensions of ability or knowledge that the Leaving Certificate seeks to examine.
Subject Take-up
Table 2.2 shows the percentages of pupils of each occupational category in our sample taking each of the seven subjects we intend to look at, and these figures are given separately for boys and girls. There are a number of,~ery clear relationships between take-up rates and occupational category. Thus, for both sexes, the percentages taking Higher Maths, Physics, Chemistry and French decrease as we move from the non-manual to the manual categories. Middle class pupils, in other words, are considerably more likely to take these subjects than are those of working class origins. The same is also true of the take-up of Biology among girls. Of course, there are also very great differences in the take-up rates between different subjects and comparing girls’ and boys’ take-take-up of the same subject, but these differences have been dealt with exhaustively elsewhere (Hannan and Breen, et al., 1983, Ch. 5).
The opposite relationship between occupational group and take-up rates holds for Biology and Technical Drawing (TD) among boys, and among girls for Home Economics (Social and Scientific S&S). The take-up rates for these subjects are greater in the manual than the non-manual categories. Lastly, there is no relationship between occupational group and take-up for TD among girls and Home Economics among boys (take-up rates are, in a;ny case, low in these two cases, particularly the former).
On the basis of this evidence, we can say that subjects such as Higher Maths, Physics, Chemistry and French are "middle class subjects" while TD and Home Economics are "working class subjects" in the sense of being, apparently, more popular with one class or certain occupational groups, than others. Furthermore, Higher Maths, Physics, Chemistry and TD are all "boys" subjects, so that, for example, the bulk of candidates for, say, Physics will be male and of middle class origins, while the bulk of candidates for TD will be males of the working classes7 Biology presents an interesting contrast between the sexes in that, for males, it shows a tendency to be more popular among those of working class backgrounds, while it is least popular with this group among females. This may be due to the sex differences in the availability of science
Table 2.2: Percentages of Male and Female Leaving Certificaie candidates taking various subjects according to class origins
ttigher PIg’fics ChemL~/O, Biologr 7"1) " Home Frenth N
Matl~" Economics
(s~s)
Females
© ,H <
1 5.1 6.5 23.2 71.9 0.1 38.3 75.0 459
2 2.4 3.(1 12.3 60.0 0.2 43.0 74.5 667
Class 3 1.8 1.9 7.9 57.5 0.1 44.2 59.2 501
4 2.5 2.3 6.8 56.0 0.0 47.2 56.4 286
Males
I 30.0 38.0 38.9 41.9 6.8 5.9 60.9 637
2 19.3 27.3 28.9 44.3 16.7 4.9 54.8 624
Class 3 11. l 26.1 23.7 48,0 30.5 5.2 42.7 280
4 13.3 19.7 21.2 46.2 40.5 4.5 27.3 132
),
,q .< Z 4
~7 Z
O Class 1 : Upper non-manual;
2: Lower non-manual; 3: Skilled manual;
4: Semi or unskilled manual.
subjects. For girls, Biology may be the only science subject open to them, while for boys, the greater availability of sciences may lead to Physics, Chemistry and Higher Maths being assigned to pupils of higher perceived ability, leaving Biology as a subject aimed at those of lower perceived ability.
Subject Availabililty : Outline of Method
To speak of differences in take-up as being due to differences in subject availability is, of course, to pre-empt what follows in this chapter. Our initial interest lies, in fact, in determining the extent to which the differences in take-up in Table 2.2 can be regarded as being caused by social class differences in the availability of these seven subjects to pupils.
As we noted earlier, we analyse the availability of subjects in terms of provi-sion and allocation, the former referring to whether or not the particular subject is taught in the school, the latter to whether or not, given that the subject is taught, it is made available to individual pupils. This form of analysis is carried out for each of our seven subjects in Tables 2.3 to 2.9, and the figures given there correspond to the categories labelled M and N in Eigure 2.1. This correspon-dence is shown explicitly in Table 2.3 to facilitate interpretation of the figures in this and subsequent tables.
Table 2.3 looks at the availability of Higher Maths to each of our four occupational categories within each sex. So, for example, of the 637 male pupils " of the upper non-manual Category 1, 3.6 per cent were in schools which did not teach Higher Maths, i.e., these pupils are not provided with the subject and constitute, in this case, Category N~ in Figure 2.1. A further 0.2 per cent, although in schools where the subject is taught, were in classes to which it was not open. This left just over 96 per cent of pupils to whom, formally at least, the subject was open. Of these, just under a half (40.9 per cent) were not able to choose the subject because they failed to meet the school’s academic prerequis-ites for taking Higher Maths: in general this means that they either had not sat for or had not done well enough in, Inter Cert Higher Maths. For all classes this can be seen to be the major factor in determining the take-up of Higher Maths in the sense that it is the single largest exclusionary factor.