Abstract—The objective of this paper is to analyze suitability of a particular site for wind turbine installation. The suitability of a particular site is analyzed on the basis of wind speed, built-ups, forests, elevation, land type/ ownership, land interferences, geological structure of earth’s surface, nearest energy installation and a couple of factors related to cost of installation and ecological impacts on living organisms. The dimensionality of the predictors is reduced by using principal component analysis to get a deeper insight into the data. The resulting principal components are then treated as input parameters for multiple regression analysis. The data of 35 different sites of Pakistan is to be collected whereas the data collection is in process. The data will be analyzed by using above two techniques in order to find site’s suitability for wind turbine installation.
Index Terms— Site Selection, Data Mining, Wind Turbine, Principal Component Analysis, Regression Analysis, Renewable Energy.
I. INTRODUCTION
n this era, the world is desperately looking for larger energy reserves. The energy planners are much concerned with the methods and techniques for ensuring sustainable energy development. The sustainability of nation’s energy sector is not only based upon their reserves that meet the needs of today but also shows compliance with the expected consumption of tomorrow [4]. Energy is globally available in different forms but most common forms on which the countries currently excel are hydrocarbons, coal energy, hydel power and nuclear energy.
Pakistan has always been remained in the top few energy producers and consumers on world chart. At the current, hydrocarbons are the major source of energy in Pakistan. The reserves of hydrocarbons in the country are moving towards their depletion point. The detailed statistics of the reserves condition are given in [12]. Despite having enormous potential for renewable energy resources only 1% of total energy is supplied through micro/mini renewable energy installations. Various surveys conducted by Pakistan Council of Renewable Energy Technologies (PCRET) revealed that the country is much fertile for solar, wind, biogas, hydel, bio-diesel, bio-mass, geo-thermal and tidal energies [9]. Along with many others, one of the reason for
Manuscript received Feb 2012; revised March 2012.
Dr. Muhammad Shaheen is with University Institute of Information Technology, University of Arid Agriculture Rawalpindi, Pakistan. (corresponding author: 92-331-4525045; fax: 92-51-9290113; e-mail: [email protected], [email protected]).
Dr. M. Shahbaz is with Department of Computer Science & Engineering, University of Engineering & Technology Lahore Pakistan. (e-mail: [email protected]).
Khalid Afsar Khan Jadoon is with Pak International Consultants & IT Solution Providers, Pakistan. (email: [email protected])
smaller exploitation of renewable energy resources in Pakistan is the overhead and lack of technical expertise required for selecting appropriate places/sites to install and operate solar panes and wind turbines.
The decision of wind turbine installations is always constrained by multiple problems. The locations with higher wind speed and frequent wind blow are not always proved to be the right choice. Some economical, ecological and planning factors can enormously reduce the worth of a site for wind turbine installations. At fine-grained level, wind speed, built-ups at proposed site, land type, land ownership, geological features of surface, nearest energy installations, economic and ecological impact can have great impact on decisions [1][15].
Some analytical science with state of the art techniques can lead towards superior results for switching from conventional energy resources to renewable energy paradigm. Data Mining helps extracting implicit useful knowledge from huge databases. This is a predictive science which can produce better implementable systems both for prediction of a real value as well as classification of existing datasets. It worth mention here that the quality of knowledge derived by using data mining techniques is directly proportional to the size of data repositories [10]. The data classification and real value prediction in data mining is established through two types of classification techniques. (1). Supervised Classification and (2). Unsupervised Classification [11].
In this paper, we used two data mining techniques in order to 1.Reduce dimensionality of datasets for a deeper insight
into data.
2.To predict the suitability of new wind turbine installation on the basis of historical facts.
These techniques are (1). Principal Component Analysis (PCA). (2). Multiple Regression Analysis. The details of these techniques are given in the succeeding sections.
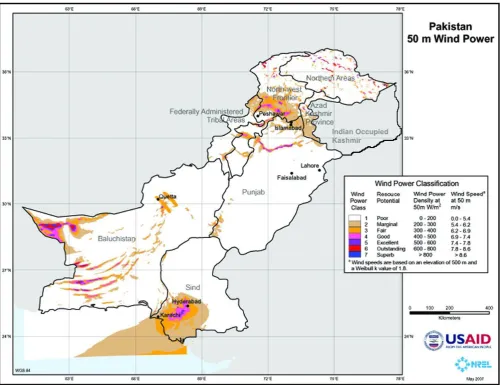
The study area of this research covers two provinces of Pakistan i.e. Sindh and Baluchistan (map shown in Figure 1). The data collection from multiple sites is in progress however the model of study is developed and tested by simulation of sample data.
The paper is organized in a systematic way. Section 2 reviews the techniques of Principal Component Analysis and Multiple regression analysis. Section 3 reviews existing literature related to wind turbine site selection. The proposed methodology including architecture of the system with interaction among its different modules is explained in Section 4. Section 5 outlines the conclusion and future work.
Data Mining For Wind Energy Site Selection
Muhammad Shaheen, Muhammad Shahbaz, Khalid Afsar Khan Jadoon
Fig. 1. Windmap of Pakistan (Baluchistan and Sindh) [USAID / NREL, May 2007]
II.SITE SELECTION
Site Selection is considered to be the most critical decision in wind turbine installation. A number of factors might be considered for reaching to an appropriate decision. The factors are classified into economic, planning, physical and ecological factors by [15] and physical, demographical, economic, policies and environmental factors by [1]. Adul Bennui et al worked out and extracted from literature a list of decisive parameters and exclusive factors for site selection. The factors are shown with descriptions in Table 1 [1].
TABLEI
SITE SELECTION CRITERIA PARAMETERS
S# Name of factor Description
1. Wind Speed Speed of wind in different directions
2. Elevation Elevation from surface of earth 3. Slope Slope of surface at anomalous
points
4. Highways Highways on or near the site 5. Railways Railways on or near the site 6. Built-ups Buildings on or near the site
R Van Haaren et al identified infeasible sites including parks, army grounds, prisons, airports, urban areas, porous and sloppy grounds. The arguments of author concluded on following additional criteria for deciding feasibility of a site [15]. Based on careful analysis of above parameters shown in Table 1 and 2, site selection procedure can exploit many intelligent data analysis techniques.
Before analyzing the data by using intelligent data analysis techniques it is better to visualize the data on a grid suitable for data representation of such diverse data. The layered architecture of GIS is the right choice for representing data in an organized form and making the data easy to analyze.
III. DATA MINING TECHNIQUES
[image:2.595.40.292.648.789.2]discussed the potential of data envelopment analysis (DEA) for energy consumption analysis [2].
TABLEII
SITE SELECTION CRITERIA PARAMETERS -II
S# Name of factor Description
9. Type of land Type of land (fertile, rage etc)
10. Type of built-up Types of built ups like schools, mosques etc 11. Land ownership Whether Govt or private 12. Type of surface Whether rocky or sandy etc 13. Geological structure
of surface
Whether plain geology or mineralac geology 14. Electric line cost Cost of electric
transmission line 15. Electric integration
cost
Cost of integration system
16. Land cost Land cost
17. Access Road cost Cost of road to access site 18. Visual Impact Aesthetic impact to
landscape 19. Safety distances from
urban areas
Safe distance of wind turbine from urban area
20. Noise Mechanical noise of
operative turbine 21. Electromagnetic
interference
Resistive EMI for wind turbine
22. Altitude Height from surface of earth
23. Bird/habitats routes Deaths of habitats
Raj Bhatnagar worked on to discover typical temporal characteristics in energy data and dig out usage patterns by using data mining and artificial intelligence algorithms [14]. Spatial analysis of find farm sites on the basis of economic, planning, physical and ecological parameters by using Geographic Information System (GIS) is proposed by R Van Harren et al [15]. Andrew Kusiak et al used Principal Component Analysis (PCA) for dimensionality reduction of data gathered from wind turbine logs and proposed data mining based prediction for wind power production [3]. A few more similar studies of utilizing data mining techniques for renewable energy data analysis can also be cited from the literature.
In this paper, we used principal component analysis (PCA) for dimensionality reduction of data been mapped in the databases against the attributes given in Table I and II. After getting data with reduced dimensionality which made it suitable for the analysis, we used multiple regression to predict the feasibility of a particular site for wind turbine. Both of the aforementioned techniques are detailed below.
A.Principal Component Analysis
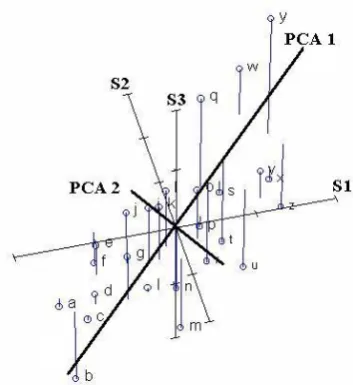
[image:3.595.320.497.50.243.2]Principal Component Analysis (PCA) is a standard tool used to reduce a complex dataset to a lower dimension to reveal some hidden but interesting information. The actual worth of PCA can be visualized only when one understands that this is a technique which remove redundant dimensions from a dataset and identify most meaningful base for re expressing the data [7].
Fig 2 – Principal Component Analysis (http://ordination.okstate.edu/PCA.htm) When multiple dimensions of a dataset are strongly correlated to each other, it become essential to remove those dimensions which are alternatively represented by another dimension and it must be. This is because the high correlation values of two dimensions evident the fact. Such dimension reduction obviously gives more insight into the data. The removal of redundant dimensions from the dataset should not be straight forward , on the contrary every removal should be accounted for. This is established through variance-covariance structure of PCA. PCA consists of following steps [6].
1.Get data containing all the dimensions and subtract the mean from each of the data dimension.
2.Calculate the covariance matrix of all parameters by using the following equation.
1
)
)
)
(
1(
(
n
A
A
A
Variance
n
j j j
A
A
1
)
)(
(
)
,
(
1n
B
A
B
A
Cov
n
j
j
j
B
A
3.Calculate the eigenvalues and eigenvectors.
4.Choose principal components and form feature vectors. Variance is a measure of spread of data in a dataset. The squared standard deviation is called variance. Both of these measures operate on one dimensional data. The standard deviation for each dimension of data can be calculated independent of other dimensions. Covariance measures to find out how much the dimensions vary from the mean with respect to each other. This is infact the accountability been performed against reduction of dimensions from dataset. Covariance matrix displays the result in the following form [6].
B.Multiple Regression
Multiple regression is a data analysis technique that helps us predicting the value of a particular variable on the basis of several other variables. There are two types of variables in multiple regression, Independent and Dependent variables. In multiple regression independent variables are used to identify dependent variables [8]. Linear relationship between the predictor and criterion variable can be found by using this technique. The prediction variable in this technique is always measured on a continuous scale and on a ratio, interval or ordinal scale. The number of records on which multiple regression is to be applied must exceed the number of predictor variables [13].
The equation of multiple regression is given below with explicit explanation of each of its constituents.
X
X
X
Z
33 2 2 1 1
α = The constant quantity or intercept
β1, β2, β3 = Slope for X1, X2 and X3 respectively
X1, X2, X3 = First, Second and Third independent variable
that indicates variance in Z.
There are some other variables that may also be encountered in multiple regression to represent standard errors. The proportion of variance in the values of dependent variables are represented by R2. When a correction is being made to this value, this would be called as Adjusted R2. F shows the significance of equation in explaining Y.
IV. PROPOSED METHODOLOGY
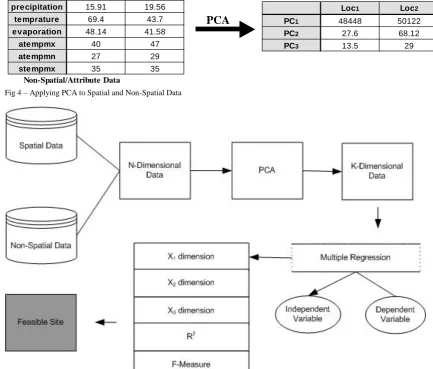
The proposed methodology is based upon the utilization of data mining techniques in wind turbine data analysis for optimal site selection. Multiple locations of Pakistan having potential for wind energy generation are mapped on a Geographic Information System (GIS) using ESRI’s ArcGIS 9.3. The GIS contains the layers shown in Table 3. Since we know that GIS is integrated with two types of databases at the backend. (1). Spatial data (2). Non-spatial/ Attribute data. Spatial data is huge in size and contains number of dimensions hence making data readability and understandability much complex. In our GIS, non-spatial data stored at the backend is integrated with corresponding GIS layers through Graphical User Interfaces (GUIs). The most common GUIs include wind speed data, highways/railways information, data about built-ups, data about forests, electric line cost, electromagnetic interference, altitude etc for ease of visualization and understandability. The structure of GIS is depicted in Figure 2.
As mentioned earlier that spatial data contains enormously large number of dimensions whereas non-spatial data does also have greater number of dimensions affecting the clarity of data. Principal Component Analysis as explained in Section III is used to reduce the dimensionality of data and changed analysis base from individual attributes to principal components.
The extracted principal components i.e. PC1, PC2, …, PCn
are used as input variables for multiple regression analysis for predicting feasibility of site for wind turbine installation. The suitability potential value is given to every site after
multiple regression and sorting of dataset according to this value ranked various sites. The equation of multiple regression encapsulated Z which is the value of potential for a site to have wind turbine. X1, X2, X3…, Xn are different
factors which are replaced by wind speed, slope, elevation and all other attributes shown in Table 1 and 2. The proposed technique is depicted in Figure 5.
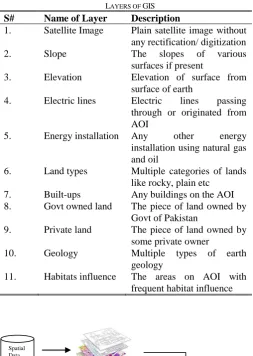
TABLEIII LAYERS OF GIS
S# Name of Layer Description
1. Satellite Image Plain satellite image without any rectification/ digitization
2. Slope The slopes of various
surfaces if present
3. Elevation Elevation of surface from surface of earth
4. Electric lines Electric lines passing through or originated from AOI
5. Energy installation Any other energy installation using natural gas and oil
6. Land types Multiple categories of lands like rocky, plain etc
7. Built-ups Any buildings on the AOI 8. Govt owned land The piece of land owned by
Govt of Pakistan
9. Private land The piece of land owned by some private owner
10. Geology Multiple types of earth geology
[image:4.595.301.555.153.510.2]11. Habitats influence The areas on AOI with frequent habitat influence
Fig 3 – Structure of GIS implemented in the Study
V.EXPERIMENT &RESULTS
The workable model for this study is constrained by some factors that are not addressable at this stage of the project. In order to attain expected accuracy in the results the following should be addressed.
Data: Detailed surveys of potential sites should be carried out to collect all the parameters mentioned in Table 1 and 2. The data collection from 35 sites of Pakistan is in progress with a number of limitations like
Spatial Data
Non spatial
Loc1 Loc2
XPos 13.9874 13.114
YPos 71.3345 70.887
PointM 0.11876 0.1231
SRID 0.34 0.223
GCnM 0.3 0.42
Pol_cor 1.2 2.7
Cir_cor 1.7 2.9
Spatial Data
Loc1 Loc2
wind_mov 53239 52558
precipitation 15.91 19.56
temprature 69.4 43.7
evaporation 48.14 41.58
atempmx 40 47
atempmn 27 29
stempmx 35 35
Non-Spatial/Attribute Data
Loc1 Loc2
PC1 17.226 19.0
PC2 71.3345 68.12
PC3 1.0 1.6
Loc1 Loc2
PC1 48448 50122
PC2 27.6 68.12
PC3 13.5 29
PCA
[image:5.595.67.506.60.399.2]PCA
Fig 4 – Applying PCA to Spatial and Non-Spatial Data
Fig 5 – The Proposed Architecture
lack of technical expertise, weather conditions and nature of survey. After the completion of data collection, it will also be another challenge to fashion data into spatial and non-spatial data. Secondly the data about land ownership, land proprietary rights and other legal obligations cannot be easily obtainable. Similarly there are certain attributes whose data is restricted and negotiations are needed to collect all as per needs. 1.PCA Analysis: After converting attributes into principal
components by using PCA, the attributes do not remain directly traceable. There should be a methodology which keeps track of all individual attributes while converting them to principal components.
2.Type of Attributes: There are certain attributes included in the study which are not quantifiable. During the implementation of the project, some technique need to be considered for dealing with such attributes.
Some simulation studies have been conducted on data which is partially collected from some of the sites which reflects the usefulness of data mining in site selection. However the detailed results about site selection will be presented after completion of study in an extended version of the paper.
VI. CONCLUSION AND FUTURE WORK
[image:5.595.60.494.201.570.2]accelerated way. The country does have renewable energy potential for which the utilization planner of renewable energy need to be restructured. Wind energy infrastructure development can lead the country to ensure sustainability in energy sector for distant future. In wind energy development, site selection is obviously the first step towards successful implementation of wind energy development. The paper proposed an efficient method for utilization of data mining techniques in wind site selection. Since the data to be analyzed for wind site selection is multi dimensional and need to be re evaluated for reduction of dimensions and application of some prediction technique. Principal Component Analysis (PCA) is used for dimensionality reduction and multiple regression analysis is applied for predicting suitability of the site for wind turbine installation. The major limitation in the work is mapping of principal components with individual attributes in order to rank the attributes with respect to their importance in wind site selection. The application of data mining and further reduction of data dimensions will also benefit in reduction of analysis time and cost.
The work will be compiled on actual datasets for which surveys are in progress. After collection of actual data a full fledge data mining framework for renewable energy is also targeted by project team. The work can further be extended to include a mechanism for mapping of principal components with individual attributes. Another extension to the current work can be made by defining a list of sustainability indicators for renewable energy sector and to build a data mining framework for those sustainability indicators in order to provide a holistic approach to assess renewable energy development of a country by using data mining.
REFERENCES
[1] A. Bennui, P. Rattanamanee, U. Puetpaiboon, P. Phukpattaranont, K. Chetpattananondh, “Site selection for large wind turbines using GIS,” PSU-UNS International Conference on Engineering and Environment, 2007.
[2] A. Koretsune, S. Aoki, T. Konzo, H. Tsuji, S. Shimano, E. Mimura, “DEA-based Data mining for energy consumption,” 10th
IEEE Conference on Emerging Technologies and Factory Automation, 2005, pp. 1076 – 1080.
[3] A. Kusiak, H. Zheng, Z. Song, “Wind farm power prediction: A Data Mining Approach”, in Wind Energy, vol. 12, 2009, pp. 275 – 293. [4] G.H.Bruntland, “Our common future,” World Commission on
Environment and Development University Press, Oxford, 1987. [5] I. Aquino, S. A. Oporto, J. K. Chavez, C. O. Perez, G. M. Urbina, H.
Medina, “Daily energy demand forecasting using a neural data mining approach with emphasis on holidays treatment,” International Conference on Artificial Intelligence and Pattern Recognition, 2007. [6] J. I. Smith, “Tutorial on principal component analysis,”
www.cs.otago.ac.nz/cosc453/student_tutorials/principal_components. pdf
[7] J. Shlens, “A tutorial on principal component analysis”, http://www.snl.salk.edu/~shlens/pub/notes/pca.pdf.
[8] J.W.Osborne, E. Waters, “Four assumptions of multiple regression that researchers always test,” in Practical Assessment Research & Evaluation, 2002.
[9] M. A. Sheikh, “Energy and renewable energy scenario in Pakistan,” in Renewable and Sustainable Energy Reviews, vol. 14, 2010, pp. 354–363.
[10] M. Shaheen, M. Shahbaz, Z.U.Rehman, A.Guergachi, “Data mining applications in Hydrocarbon exploration,” in Springer Artificial Intelligence Reviews, vol. 35, 2010, pp. 1 – 18.
[11] M. Shaheen, M. Shahbaz, A. Guergachi, Z.U.Rehman, “Mining Sustainability Indicators to classify Hydrocarbon development,” in Elsevier Knowledge-Based Systems, 2011, In Press.
[12] M. Shaheen, M. Shahbaz, Z.U.Rehman, A.Guergachi, “Mining sustainability indicators to predict optimal Hydrocarbon exploration Rate”, Proceedings of IASTED Artificial Intelligence and Applications, 2010, pp.394 - 400.
[13] N. Brace, R. Kemp, R. Snelgar, SPSS For Psychologist. 3rd Ed.
Palgrave Macmillan.
[14] R. Bhatnagar, “Energy resource management based on Data mining and Artificial Intelligence,” ACEEE Summer Study on Energy Efficiency in Industry, 2005, pp. 14 – 23.
[15] R.V.Haaren, V. Fthenakis, “GIS-based wind farm site selection using spatial multi-criteria analysis: Evaluating the case for New York state,” in Renewable and Sustainable Energy Reviews, vol. 15, 2011, pp. 3332 – 3340.