Language: A Caption Generation System
Vibhu O. Mittal*
University of PittsburghGiuseppe Carenini~
University of PittsburghJohanna D. Moore t~
University of PittsburghSteven Roth~
Carnegie Mellon University
Graphical presentations can be used to communicate information in relational data sets succinctly and effectively. However, novel graphical presentations that represent many attributes and rela- tionships are often difficult to understand completely until explained. Automatically generated graphical presentations must therefore either be limited to generating simple, conventionalized graphical presentations, or risk incomprehensibility. A possible solution to this problem would be to extend automatic graphical presentation systems to generate explanatory captions in natural language, to enable users to understand the information expressed in the graphic. This paper presents a system to do so. It uses a text planner to determine the content and structure of the captions based on: (1) a representation of the structure of the graphical presentation and its map- ping to the data it depicts, (2) a framework for identi~ing the perceptual complexity of graphical elements, and (3) the structure of the data expressed in the graphic. The output of the planner is further processed regarding issues such as ordering, aggregation, centering, generating referring expressions, and lexical choice. We discuss the architecture of our system and its strengths and limitations, Our implementation is currently limited to 2-D charts and maps, but, except for lex- ical information, it is completely domain independent. We illustrate our discussion with yqgures and generated captions about housing sales in Pittsburgh.
1. I n t r o d u c t i o n
This paper describes a framework for generating natural language captions to accom- pany complex graphical presentations of diverse data sets. It describes an implemented system that integrates two robust systems: SAGE--an intelligent graphics presentation system (Roth et al. 1994), and a natural language generator, consisting of a text planner (Young and Moore 1994; Young 1997), a microplanner implementing tactical decisions, and a sentence realizer (Elhadad and Robin 1992).
Graphical presentations can be an effective method for succinctly communicating information about multiple, diverse data attributes and their interrelationships. More than 80% of all business reports these days contain graphic presentations of data (Beat- tie and Jones 1994; Schmid 1983). When a display includes only a small number of data attributes or can make use of conventionalized graphical styles (e.g., spreadsheet
* Current affiliation: Just Research, 4616 Henry Street, Pittsburgh, PA 15213 and Language Technologies Institute, .Carnegie Mellon University, Pittsburgh, PA 15213. E-marl: [email protected]
t LRDC and Computer Science Department Intelligent Systems Program
Computational Linguistics Volume 24, Number 3
graphics), it is easy for a viewer to understand h o w to interpret it. However, one of the main goals for automatic presentation systems is to allow users to see complex relationships between different attributes and perform problem-solving tasks (e.g., summarizing, finding correlations or groupings, and analyzing trends in data) that involve many data attributes at the same time. A number of research groups have de- veloped systems that can automatically design sophisticated presentations to support a task--presentations that are both novel and complex (e.g., Casner 1991; Mackinlay 1986; Roth et al. 1994). These graphics are often difficult to understand (Shah 1995). Clearly, such graphics can only be fully effective for supporting analysis tasks if ac- companied by explanations designed to enable users to understand h o w the graphics express the information they contain. Studies have shown that the presentation of captions with pictures can significantly improve both recall and comprehension, com- pared to either pictures or captions alone (Nugent 1983; Large et al. 1995; Hegarty and Just 1993). This suggests that the generation of captions for statistical graphics is an important application area in which natural language generation techniques can make a significant contribution.
In our system, the graphical displays are designed by an automatic presentation component, SAGE (Roth et al. 1994), and are often complex for several reasons. First, they typically display many data attributes at once. The mapping of many different data attributes to multiple graphical objects in a single display can be difficult to determine from the graphics alone. Second, integrating multiple data attributes in a display requires designing graphics that are unfamiliar to users accustomed to spread- sheet graphics that create simple displays of individual data attributes. While these integrated displays can be very useful once they are explained, it is often difficult to understand them completely without accompanying explanations. Finally, the nature of the data with which we are concerned is inherently abstract and does not have an obvious or natural visual representation. Unlike depictions of real world objects or pro- cesses (e.g., radios [Feiner and McKeown 1991], coffee makers [Wahlster et al. 1993], network diagrams [Marks 1991]) and visualizations of scientific data (e.g., weather, medical images), visualizations of abstract information lack an obvious physical ana- logue.
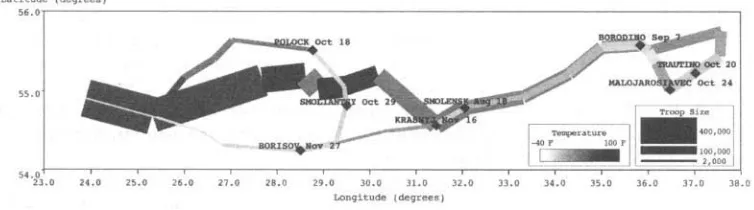
As an example of the type of data we are concerned with, consider the graphic shown in Figure 1. This is a SAGE-generated version of the famous graphic drawn by Minard in 1861 depicting Napoleon's march of 1812 (Roth et al. 1994). 1 The graphic relates seven different variables: position (latitude and longitude), size, direction of movement, temperature, and dates and locations of battles. Unless one has seen this graphic (or a very similar one) before, it can be very difficult to understand. Indeed, Minard accompanied the original graphic with a paragraph of text, the first half of which is about h o w the graphic expresses the information it contains. 2
Consider h o w the following human-generated caption for the graphic in Figure 1 explains the picture and the underlying data: 3
This map shows march segments and battles from Napoleon's 1812 campaign. The map shows the relation between the geographic locations, temperature and number of troops for each segment. Each line shows the start and end locations for the march segment. Its color shows the temperature, and the thickness shows the number of troops. The temperature was about 100 degrees for the initial segments in the west (the wide, dark red lines on the left), about 60 degrees in
later segments in the east (the narrower, light red lines on the right) and about -40 degrees in the last segments, also in the west (the narrowest, dark blue lines on the left). The number of troops was 400,000 in the earliest segments, 100,000 in the later segments, and 10,000 in the last segments. The city and date of each battle is shown by the labels of a yellow diamond, which shows the battle's location.
This caption can help users understand the various attributes and the underlying relations between them--conveyed so succinctly by the graphic.
Although several projects have focused on the question of how such intelligent graphical presentations can be automatically generated (e.g., Casner 1991; Mackinlay 1986; Roth and Hefley 1993; Kerpedjiev 1992), they have not addressed the problem of generating the accompanying textual explanations. Without this ability, automatic graphical presentation systems will necessarily be limited to generating convention- alized graphics that do not use novel means to express complex relationships among data attributes, or risk generating displays that users will find difficult to fully com- prehend and utilize.
In designing our framework for generating natural language captions we have adapted and integrated work in natural language generation (NLG) by a number of researchers--including ourselves--in different subareas: text planning, aggregation, centering, computing referring expressions, example generation, and linearization. Given the applied nature of our work, in selecting specific NLG techniques we fol- lowed a parsimonious approach. For each subtask we selected the simplest technique that was capable, in conjunction with the behavior of the other subtasks, of producing coherent text that could express the propositions we needed to convey.
The generation process starts with content selection. For this process, we use LONCBOW, a domain-independent discourse planner originally developed as part of a project aimed at generating tutorial explanations (Young and Moore 1994). Using plan operators that encode discourse strategies devised for the task of generating captions, the planner determines what information should be included in the cap- tions (and consequently what should be left out), and how to organize the selected information. Operator constraints analyze the structure of the graphic presentation and the perceptual complexity of the graphical display to enable the planner to se- lect and apply appropriate strategies. The output of the text planning stage is then further processed by a microplanner, a sequence of modules implementing inter- and
Figurative map of the losses, expressed in men, of the army during the Russian campaign. 1812-1813
Print by M. Minard. Retired general inspector of the "Ponts et Chaussees."
The number of men is represented by the width of the colored zones, where one millimeter corresponds to ten thousand men; moreover, they (number of men) are written across the zones. Red indicates men entering Russia, black indicates men exiting it. The information used to fill this map would have not been available without M. Thiers, de Segur, de Frezerisac, de Chambray and the journal of Jacob, army pharmacist since Oct. 28th. To help the eye judge how the army shrank, I assumed that the regiments of Price Jeroms and Marchal Davons, that were detached in Minsk and Mobilov, and rejoined near Orscha and Wiltesk, always walked together with the army.
Computational Linguistics Volume 24, Number 3
intraclause ordering, aggregation, and referring expression computation. The module performing intraclause ordering is of special interest because it uses a novel technique based on centering theory. Although we have devised such a technique specifically for generating captions, it is general and can be applied to any discourse structure. The other three microplanning modules use standard NLG techniques. Ordering and aggregation are based on text genre (i.e., descriptions of information graphics) and domain-specific (e.g., real estate sales or stock market data) heuristics. The referring expression module uses a well-known domain-independent algorithm that, given an intended referent, builds a description uniquely identifying it. The referential problems in our application did not require more sophisticated referring algorithms; there was also no interaction between computing the referring expressions and inter- and intra- clause ordering. Once microplanning is complete the FUF/SURGE realization module generates the actual English. The modules of our NLG system are discussed in detail in Section 5.
In addition to these NLG techniques, generating textual captions for information graphics requires the following knowledge sources:
• a representation of the syntax of graphical displays, that is, the
structural, spatial and other relations among graphical objects and their properties. For example, the relationship between the end points of the lines in Figure 1 to positions on the map, the fact that an axis conveys the positional values for all the objects within a chart, 4 the difference between alternative uses of color: (i) constant color, (ii) color used to distinguish between different attributes, and (iii) color used to encode data values
• a representation of the semantics of graphical displays, i.e., the mapping from data objects and their attributes to graphical ones. For example, in Figure 1 the fact that the temperature during a march segment is m a p p e d to the color of the corresponding graphical segment.
• a mechanism for determining which aspects of graphical displays must be explained based on their perceptual complexity or the complexity of the data attributes they express. This mechanism must take into account information about the underlying data and the perceptual complexity of the w a y in which data attributes and relations have been m a p p e d to graphical entities.
We describe these knowledge sources and the discourse strategies in the following three sections.
2. SAGE: A System for Automatic Graphical Explanations
SAGE is a knowledge-based presentation system that designs graphical displays of
combinations of diverse information (e.g., quantitative, relational, temporal, hierarchi- cal, categorical, geographic). The inputs to SAGE include: (1) sets of data represented as tuples in a relational database, (2) a characterization of the properties of the data that are relevant to graphic design, and (3) an optional set of design specifications, expressing a user's preferences for visualizing the data set.
L a t i t u d e ( d e g r e e s ) 56.0
, , , , , , , , , , , ,
[image:5.468.37.414.63.168.2]54"~'3,0 24.0 25.0 26.0 2 7 , 0 28.0 29.0 30.0 31.0 32.0 33.0 34.0 35.0 36.0 3 7 . 0 38.0 L o n g i t u d e ( d e g r e e s )
Figure 1
A SAGE-generated version of the well-known Minard graphic.
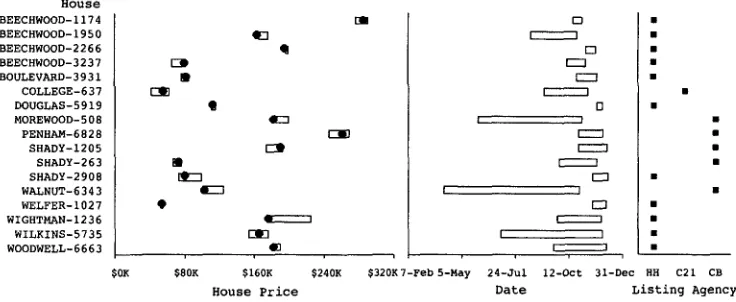
SAGE'S output consists of one or more coordinated sets of 2-D information graphics that use a variety of graphical lechniques to integrate multiple data attributes in a single display. SAtE integrates multiple attributes in three ways:
• by representing them as different properties of the same set of graphical objects. For example, both the left and the right edges of the bars in the left most chart in Figure 2 are used to map attributes
(asking-price
andselling-price
respectively)• by assembling multiple graphical objects into groups that function as
units to express data. For example, the interval bar and the mark in the left most chart in Figure 2 are used to show different types of
price-related attributes:
asking-price, selling-price,
and theagency-estimate.
• by aligning multiple charts and tables together with respect to acommon axis. For example, the three charts in Figure 2 are aligned on the Y-axis, which indicates the house.
Creating a graphic that integrates data in this way is partly an encoding process in which the values of data attributes are converted into graphical values of properties of objects (e.g., color, shape, and spatial position of polygons). Interpreting the infor- mation in a graphic is a decoding process, where people must translate visual symbols back into data values. SAGE creates graphics that enable people to efficiently perform information-seeking tasks (e.g., searching for clusters of data values that are different from the rest and looking up other facts to understand what makes them different). In designing graphics, however, SAGE only considers how effectively attributes can be mapped to graphical properties to support a task. For example, a requirement to be able to search for particular values by name might result in the relevant attribute being arranged along an axis in lexicographic order; on the other hand, if it is important to find the maximum and minimum values in a set, SAGE might order these values in terms of magnitude. SAGE, like other automated presentation systems (Casner 1991; Mackinlay 1986), does
not
take into account perceptual complexities associated with the resulting graphic. For instance, SAGE does not explicitly reason about the difficul- ties users m a y have in translating bicolor saturation scales to exact numerical values, sComputational Linguistics Volume 24, Number 3
SAGE can also design complex presentations that have overlapping objects, or use (:luster composition to define a novel combination or grouping of graphical objects in the presentation. This can make understanding some of the graphics that SAGE generates quite difficult. Fortunately, the picture representation used in S A G E contains a complete declarative representation of the content and structure of the graphic in a form that can be used for reasoning b y other components. Thus, this representation can be used to reason about possible sources of user confusion arising from mappings that are either complex or ambiguous to the user.
SAGE'S representation serves three functions in explanation generation. First, it helps define what a viewer must understand about a graphic in order to obtain useful information from it. It does this b y defining the elements of a graphic and the w a y they combine to express facts (i.e., h o w they map to data). Second, the representation describes the structure of both the graphical presentation and the data it presents, so that they can be explained coherently. Finally, the representation helps derive judg- ments of complexity for specifying graphical elements needing text explanation. To understand these three functions, we briefly review the representation.
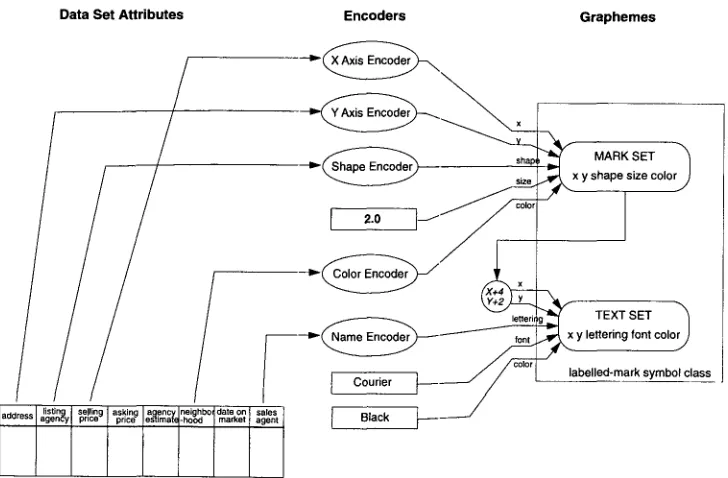
Graphemes are the basic building blocks for constructing pictures. Marks, text, lines, and bars are some of the different grapheme classes available in SAGE. Each grapheme type consists of a definition of the parameters that control the appearance of all graphemes of that type; different grapheme subtypes can be created by varying specific parameters. Individual graphemes can be generated by providing appropriate values for all the input parameters. For instance, individual marks can be generated by providing values for the parameters: x-coordinate, y-coordinate, shape, size, and color
to an instance of a mark class encoder; individual line segments can be generated by providing values for the coordinates xl, yl, x2, and y2, thickness; and color to the line class encoder.
Symbol classes are used to organize graphemes into structures that express facts in the data set. A labelled-mark, an interval bar, and a bar with an attached label are some of the more familiar symbol classes available in S A G E . Each symbol class consists of a definition of the spatial relationship among a set of graphemes and the correspondence between the parameters of this set and attributes types in a data set. A labelled-mark, for instance, w o u l d be defined as a combination of a mark and a text label and the spatial relationship between them. Consider the labelled-marks in the chart shown in Figure 3. The spatial position of the label is dependent on the position of the mark: it is offset slightly to the right and above the mark. Symbol classes in SAGE can be either predefined (some of the more common ones, such as a labelled-mark have already been defined), or created by the system based on rules about combining different graphemes into clusters.
Encoders are used to relate specific data values and graphical values to each other. Horizontal/vertical axes, color keys, size keys, and shape keys are some of the different encoders available in S A G E . Each encoder class consists of a definition of the relation between a family of data set attributes and a particular graphical type. SAGE can then use this information to map data values to graphical values in designing a picture, and provide a frame of reference (e.g., axes, keys, etc.) that can be used to visually interpret specific values in the picture. For instance, a color encoder could map data values "less than 5" to the graphical value "blue" and others to "red." A schematic of the encoders used in the chart shown in Figure 3 is shown in Figure 4.
House BEECHWOOD-ii74 BEECHWOOD-1950 BEECHWOOD-2266 BEECHWOOD-3237 BOULEVARD-3931 COLLEGE-637 DOUGLAS-5919 MOREWOOD-508 PENHAM-6828 SHADY-1205 SHADY-263 SHADY-2908 WALNUT-6343 WELFER-1027 WIGHTMAN-1236 WILKINS-5735 WOODWELL-6663 $0K £3D m [ m S
q 3 q Q C ~ m ~ 3 4£Z3 m £13 4 8 $80K $160K $240K
H o u s e Price
$320K 7-Feb 5-May
E) •
l I •
[]
:
i :i:':"',, i •
[] •
r •
i ~ l •
r •
•
I •
•
i i •
I I •
i I •
2 4 - J u [ 1 2 - 0 c t 3 1 - D e c HH C21 CB Date Listing Agency
Figure 2
A sample graphic generated by SAGE.
House BEECHWOOD-ii74 BEECHWOOD-1950 BEECHWOOD-2266 BEECHWOOD-3237 BOULEVARD-3931 COLLEGE-637 DOUGLAS-5919 MOREWOOD-508 PENHAM-6828 SHADY-1205 SHADY-2263 SHADY-2908 WALNUT-6343 WELFER-1027 WIGHTMAN-1236 WILKINS-5735 WOODWELL-6663 $0K
D L o r r a i n e - H u r w i t z O S-Smith • L o u i s e - D w y e r
m M i l t - S t r a h l O Judy-Armitage
• J i l l - B o l n e r
• S u s i e - S i l v e r s m i t h
Listing Agency
• H A N N a
CENTURY-21 COLDWELL
~ B r i a n a - N a s s i f
• N a t a l i e - K l e i n • S u s i e - S i l v e r s m i t h
• G a y l e - P o l l o c k ~ D e e - Y u r k o v i c h • M a r i a n - W i l e
O V a n c e - H e t r i c k • L o r r a i n e - H u r w i t z
• S - S m i t h
i i !
$80K $160K $240K
Neighborhood O POINT-BREEZE O SHADYSIDE O SQUIRREL-HILL
! $320K House Price
Figure 3
A graphic generated by S A G E to illustrate the use of encoders.
relationships among data (e.g., the relation between the endpoints of ranges or between the two coordinates of a 2-D geographic location), and the functional dependencies among attributes in database relations (e.g., one:one, one:many, many:many). As we will show later, the latter is an important factor in selecting a high-level discourse strategy for generating explanatory captions.
[image:7.468.41.409.63.214.2] [image:7.468.32.412.240.515.2]Computational Linguistics Volume 24, Number 3
sembling these techniques into composites that can integrate information in a single display. SAGE uses this graphic design knowledge together with the data characteri- zation knowledge to generate displays of information.
To summarize, the portion of s i g n ' s knowledge base that is most relevant for generating explanatory captions is its graphical syntax and semantics. The syntax includes a definition of the graphical constituents that convey information: spaces (e.g., charts, maps, tables), graphemes (e.g., labels, marks, bars), their properties (e.g., color, shape), and encoders--the frames of reference that enable their properties to be interpreted/translated back to data values (e.g., axes, graphical keys). The syntax also defines the ways in which graphemes can be combined to form symbols---composites that integrate multiple data attributes (e.g., a label attached to a mark). The syntac- tic structure of a graphical display, like the linguistic structure of text, can provide guidance for creating structurally coherent explanations.
The representation of the semantics of graphics conveys the way data is m a p p e d to the syntactic elements of displays. It also provides guidance for organizing explana- tory captions by grouping graphical elements that express data attributes that form a coherent group. The data characterization provides knowledge of the structure of the data and therefore also influences the structure of the explanation.
3. Discourse Strategies for Generating Captions
Explanations about informational graphics can be classified into at least three cate- gories based on the structural properties of the picture, the structure of the underly- ing data attributes, and their mapping to spaces and graphemes. These explanation strategies reflect the overall structure of the graphic presentation: whether the spaces are aligned along a common axis, and around the functionally independent attribute (FIA). An attribute is functionally independent if it uniquely determines the values of all other attributes. For example, in one of our current data sets about house sales, the house's street address has been specified as the FIA; it uniquely determines
asking-price,
selling-price,
and the other attributes in the database. In contrast, the listing agency does not uniquely determine any of the other attributes in the house-sales relation.In addition to the factors mentioned above---used to select the overarching dis- course strategies--the system makes use of additional information about the symbols and their mappings used in the display to select and organize information to be pre- sented in the caption. For instance, the system uses graphical information to determine the order in which information is presented. This reasoning can occur at various levels of the picture representation: at the space level (all objects in a space are described before objects in another space), at the grapheme cluster level (all objects in a clus- ter are described together), and at the encoder level (all objects that map the same attribute type are described together). SAGE'S representation of the graphical display thus provides additional information that can be considered w h e n text explanations are generated.
The process of generating natural language explanations can be divided into three conceptual stages: (i) select a discourse strategy to provide the overall organization of the explanation based on the structural properties of the graphical presentation, the relations expressed in the data set, and the data-to-grapheme mappings; (ii) within each space of the presentation, use the complexity metric to determine the amount of detail to be included in the explanation; and (iii) reason about the tactical decisions in sentence planning.
Data S e t A t t r i b u t e s E n c o d e r s
color
r 2.°
letterir
- - - S . -
color i
listin p .... price eas~iimnaCl market sans
add .... gen~y! selling ... g I_,~ibo, d . . . agent 1 g laCk ~ ' ~ ' ~
G r a p h e m e s
MARK SET .,x y shape size colorJ
" E X T S E '
[image:9.468.45.409.60.299.2]y lettering font color.J labelled-mark symbol class
Figure 4
Encoders used in mapping attributes to a labelled-mark in the chart shown in Figure 3.
systems cannot afford to generate a paraphrase of the entire knowledge base. As illus- trated by Figure 5, an explanation that includes all the facts in the underlying picture representation or data set for even a simple graphic in SAtE would be extremely verbose. Most of the facts expressed in such a caption would be both obvious and unnecessary for the average user. Studies have shown approximately three-fourths of the time spent by users in interpreting a graphic is used in understanding the data- to-grapheme mappings (Shah 1995; Cleveland and McGill 1987). Therefore, our initial goal was to generate captions describing only those mappings that might be either complex or ambiguous for the average user. The system can currently analyze a pic- ture representation for five different types of complexities and ambiguities; these are discussed in greater detail in the following section (Section 4). This section discusses the three strategies used by the system to structure the content during text planning. The sentence planning phase is discussed in Section 5, where the individual compo- nents implementing the tactical decisions in the microplanner are described in detail.
Computational Linguistics Volume 24, Number 3
These three charts show information about houses from data set PGH- 23. Each chart has two axes. The Y-axis identifies the houses in the three charts. The data set countains 17 items. The X-axis in the first chart indicates house prices. The origin is at zero and there are 4 ticks on the axis, with the maximum value being $320,000. The difference between each tick is $80,000. The values mapped to the axis range from $55,000 to $310,000. The left edge of the bar shows the selling price of a house whereas the right edge of the bar shows the asking price of a house. Selling prices shown range from $55,000 to $304,000. Asking prices range from $61,000 to $310,000. The horizontal position of the square mark shows the agency estimate. These range from $55,000 to $305,000. For example ...
Figure 5
A fragment of one possible verbose caption for the graphic in Figure 6.
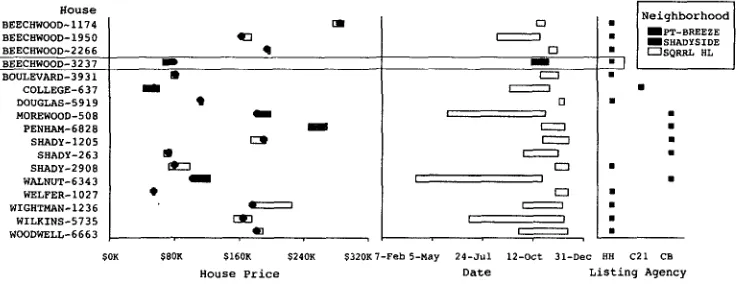
In such cases, the strategy attempts to reinforce the organizing role of the func- tionally independent attribute. The explanation strategy identifies the anchor and the independent attribute first. Then, it describes each space in the picture relative to the anchor. Domain attributes mapped in the graphic are also mentioned in the context of the FIA and the type of relationship defined between them (one:one or one:many). Two SAGE-generated graphics and the associated explanations that illustrate this organizing principle are shown in Figures 6 and 7. These two figures illustrate the importance of a caption generator in this application. Both figures present the same data set about house sales. However, the presentations generated b y SAGE are different, make use of different mappings, and give rise to different perceptual complexities. Consequently, the content of the captions generated is also different. However, in both the captions, the overall discourse strategy is the same: to emphasize the aligning Y-axis, the func- tionally independent attribute--the house-address--and structure the description of the other attributes in terms of the FIA.
3.2 Strategy 2: Single Space Organized Around Dependent Attributes
In cases where the graphic is organized around dependent attributes, the explanation cannot be structured around any of them. This is because the attribute may be defined in either one:many or many:many relationships in the dataset and cannot therefore be used as an identifier. This is the case in Figures 8 and 9. In these two figures, the attributes that are mapped to the axes of the charts are dependent attributes such as
H o u s e B E E C ~ D ~ I i 7 4 BEECHW~D-1950 BEECHWOOD-2266 ~EECHWOOD-3237 BOULEVARD-3931 COLLEGE-637 DOUGLAS-5919 M O ~ W O O D - 5 0 8 P E N H ~ - 6 8 2 8 S ~ D Y - 1 2 0 5 SHADY-263 SHADY-2908 WALNUT-6343 WELFER-1027 WIGHTMAN-1236 WILKINS-5735 WOODWELL-6663 m D m ~ 3 q I i C3D 4w ~ 3 G 8 C3 i O l CZ3 i |
D CUi3 C ~ 3 I .... I
U 3 )
C3 i i
$0K $80K $160K $240K $320K 7-Feb 5-May 24-Jul H o u s e P r i c e Date
N e i g h b o r h o o d Imm
~ I P T - B ~ E Z E ISHAD¥SIDE ~ S Q ~ L HL
, , ~
12-Oct 31-Dec HH C21 CB Listing A g e n c y
These three charts show information about houses from data set PGH-23. The Y-axis identifies the houses in the three charts. In the first chart, house prices are shown by the X-axis. The house's selling price is shown by the left edge of a bar, whereas the asking price is shown by the right edge. The horizontal position of the mark shows the agency estimate. For example, as shown in the highlighted tuple, the asking price of 3237 Beechwood is $82K, its selling price is $75K, and the agency estimate is $81K. In the second chart, the house's date on the market is shown by the left edge of a bar, whereas date sold is shown by the right edge. Color indicates the neighborhood. The third chart shows the listing agency.
Figure 6
Graphic with caption generated using strategy 1.
3.3 Strategy 3: Multiple Spaces Aligned along an Axis with Dependent Attributes The second strategy discussed above is only applicable if there is a single space in the presentation. However, SAGE is capable of designing presentations with multiple spaces that are aligned along dependent attributes in the data set. In such cases, the explanation generator cannot describe all the concepts in the presentation using strat- egy 2. This is because if one of the spaces in the presentation happens to have the FIA mapped to its non-aligned axis, a description such as "this space shows the (one:one) relationship between the {FIA/ and (attribute-2 I" would not be natural. In such cases, it is more natural to use strategy 1 to describe the mappings in that space. Therefore, strategy 3 allows the system to organize the captionf0r each space accordingly, depend- ing upon whether the FIA is mapped along its nonaligned axis. Figure 9 shows such a graphic and the corresponding caption. The two charts in Figure 9 are aligned along the X-axis, which is used to encode house-price. In generating the captions for the two charts, the system describes each one independently, using either strategy 1 or 2, as appropriate. It describes the top one first (following the structure of the graphic) and then the bottom one. Each of them, in this case, is described using strategy 2 because they both have dependent attributes mapped along the axes.
4. Graphical Complexity: The Need for Clarification
[image:11.468.41.410.62.204.2]C o m p u t a t i o n a l L i n g u i s t i c s V o l u m e 24, N u m b e r 3
A g e n c y ~ H a n n a m Century-21
[~]Coldwell $124Ei $199KI, $175K $175K $61~
$ 8 0 K ~ $ 6 5 K
$76K[ I$66K
$225~
$189K
H o u s e
BEECHWOOD-ii74 BEECHWOOD-1950 BEECHWOOD-2266 BEECHWOOD-3237 BOULEVARD-3931 COLLEGE-637 DOUGLAS-5919 MOREWOOD-508 PENHAM-6828 SHADY-1205 SHADY-263 SHADY-2908 WALNUT-6343 WELFER-1027 WIGHTMAN-1236 WILKINS-5735 WOODWELL-6663
14-Feb-89 5-May-89 I 24-Jui-89
House Price I $ 2 9 0 K ~ $ 2 7 6 K $285K
$165K $163K $ 1 9 8 K ~ $ 1 9 6 K $195K $80K $ 8 5 K ~ $ 7 6 K $82K $41K $55K $ 1 1 5 K m $ 1 1 0 K $I12K I$184K $182K $269KI I$245K $261E $192KI I$174K $190K $73K $ 9 9 K ~ $ 7 3 K $80K I$I03K $I03K
$ 5 5 K ~ $ 5 2 K $54K $177K $176K $153K $165K $182K $182K
I
12-Oct-89 31-Dec-89 D a t e
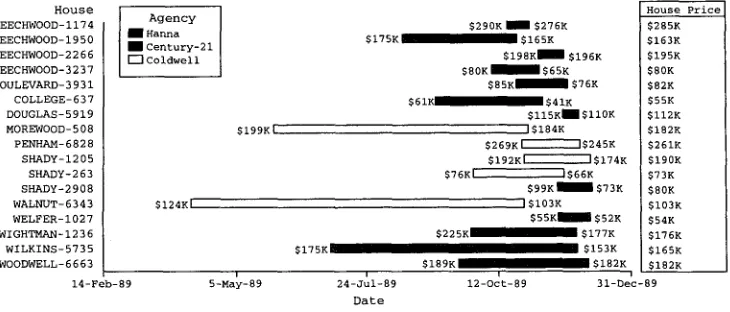
This chart and table show information about house sales from data set PGH-23. The Y-axis identifies the houses in the two spaces. In the chart, dates are shown along the X-axis. The house's date on the market is shown by the left edge of a bar, whereas the date sold is shown by the right edge. Color indicates the listing agency. The label to the left of a bar indicates the asking price, whereas the label to the right indicates the selling price. The table shows the agency estimate.
F i g u r e 7
C a p t i o n for a n a l t e r n a t i v e p r e s e n t a t i o n o f the d a t a s e t u s e d in Figure 6.
below, that can make it difficult for a user to understand complex data-to-grapheme mappings. 6
4.1 Encoder Complexity
To read data values shown in a picture, users must understand the encoders used in designing the picture. Encoders allow the user to map between graphical values and attribute values. Two examples of encoders are the axes (which allow users to map between positional values in the picture and data values along the axes), and graphical keys (these can illustrate mappings between variables such as size and shape and attribute values). Complexities can arise either (i) when an encoder is complex, or (ii) when an encoder mapping uses a scale that is complex.
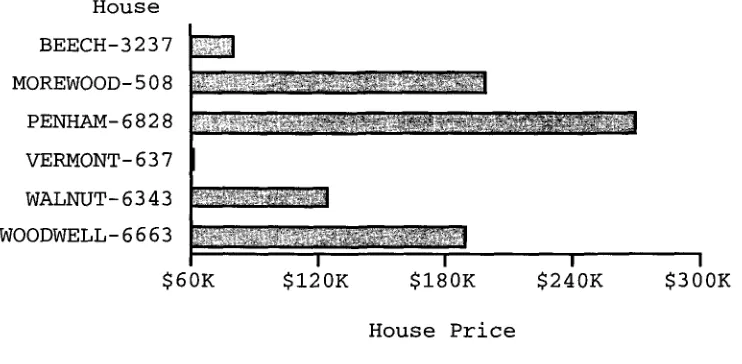
Consider for instance, Figure 10. Among the encoders used in this picture are the X and Y axes, which map positional information to house prices and house addresses, respectively. In the chart shown here, the X-axis does not have a zero origin (presum- ably in order to make the differences between the data items clearer by having more screen real estate to display a smaller range of data values). Because of this translation of the origin, it is no longer possible to conclude in this chart that a bar twice as long as another bar encodes a value twice as large (for instance, bars representing houses WALNUT-6343 and VERMONT-637 in Figure 10). Both axis translation and truncation-- to compress empty regions in quantitative data----can lead to false inferences. Similar decoding problems can occur with other encoding techniques as well, as when a quan-
[image:12.468.62.427.61.217.2]D a y s o n M a r k e t 240-
180 °
120.
60.
6123
U O - - - ~
N e i g h b o r h o o d
N HANNA
N CENTURY-21
[ ~ C O L D W E L L
I 4) i
U23
[D U3
i N C] El3
l I i l
$0K $90K $180K $270K $360K
H o u s e P r i c e
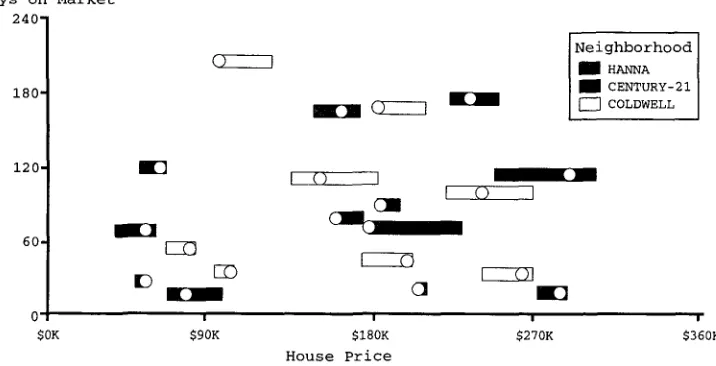
This chart shows information about house sales from data set PGH-23. It emphasizes the rela- tionship between house prices and the number of days on the market. The X-axis shows the house prices, whereas the Y-axis shows the house's number of days on the market. The house's listing agency is indicated by color. The selling price is shown by the left edge of the bar, whereas the asking price is shown by the right edge. The position of the mark shows the agency estimate.
Figure 8
Graphic with caption generated using strategy 2.
titative attribute is mapped to the area of a circle, or nonlinear scales are used along axes.
A more complex example of encoding technique complexity can be seen in Fig- ure 1. Saturation and color are combined in a single encoding technique to express temperature. Dark red indicates 100 degrees and dark blue indicates - 4 0 degrees. As the color gets paler (less saturated) it indicates a less extreme temperature. For exam- ple, pale red (pink) indicates 65 degrees, while pale blue indicates - 5 degrees. White indicates a transition point. 7 Thus both the frame of reference (the color saturation key) and the technique are potentially complex here. Figure 1 also illustrates range complexity: the user must determine what the transition point is (whether it is the center of the scale, or some special value, such as 32 degrees F). The graphic is not explicit about whether the two ranges on both sides of this special transition point are balanced.
4.2 Grapheme Complexity
Although the encoder (e.g., positional encoding on an axis) and the mapping (e.g., the scale used along file axis) may both be simple, a grapheme that uses that encoder and mapping may still be difficult for users to interpret. This may occur for a variety of reasons ranging from too m a n y mappings to problems in identifying the mappings.
[image:13.468.51.409.68.251.2]Computational Linguistics Volume 24, Number 3
Number of Rooms
1 0
• • • • • • • • m • •
• • • O •
Lot Size
16000 l 12000 -
8000
400001
$0K
• % o o % ,
~ • ~ 8 o • • •
I I I I
$120K $240K $360K $480K
House Price
[image:14.468.55.425.61.243.2]These charts show information about house sales from data set PGH-23. In the two charts, the X-axis shows the selling prices. The top chart emphasizes the relationship between the number of rooms and the selling price. The bottom chart emphasizes the relationship between the lot size and the selling price.
Figure 9
Graphic with caption generated using strategy 3.
Complexities of this type can arise from:
• multiple grapheme properties: In some cases, the presentations can
include graphemes that have a large number of geometric properties used in mapping data attributes. Consider, for instance, Figure 11. While the encoders in the figure are relatively straightforward, the fact that four different mappings are used here--x-position, y-position, shape, and color--can hinder comprehension.
• unclear geometric properties: Circular marks and horizontal bars are
usually familiar to most readers and SAGE chooses them whenever possible. However, in some cases the system may have to use graphemes that are not as common. In such cases, the reader has to not only
understand the encoder and the mapping technique, but also understand which property of the grapheme is being used in each encoding.
Consider, for instance, if a triangular mark is used in a plot chart: in order to interpret its positional property, it is essential to know which of its three vertices (or the center) is used in the mapping.
House
BEECH-3237
~ MOREWOOD-508 L ~PENHAM-6828 I
VERMONT-637
WALNUT-6343
WOODWELL-6663
~I
$60K
$120K
I$ 1 8 0 K
I$ 2 4 0 K
I$300K
I [image:15.468.42.413.66.248.2]House Price
Figure 10
Comprehension can be hindered by encoding technique complexities (e.g., a truncated X-axis.)
4.3 Ambiguous Mapping Complexity
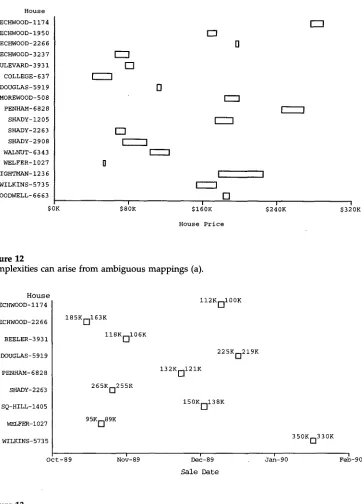
A user's ability to identify the mapping of even simple techniques can be hindered when dissimilar graphemes (or dissimilar properties of a grapheme) are used to map to similar attribute types. Consider for instance, the charts in Figures 12 and 13. The left and right edges of the bar in Figure 12 refer to the
selling-price
andasking-price
of a house in the domain. However, the X-axis representsprices in
general, and there is no w a y to distinguish between the two from the figure itself. Similarly, in Figure 13, the two text labels refer to two different prices, but the two attributes cannot be distinguished from one another solely from the figure, s4.4 Composition Complexity
When multiple graphemes occur in a space, they can be confusing at first until their relationships to each other are clarified. Compositions can result in clusters of two types:
• Cooperative Graphemes: For example, consider the chart shown in
Figure 14. The mark and label graphemes form an aggregate that must be considered together. In this case, since the label conveying the real estate agency is slightly offset from the position on the X and Y axes, it cannot be interpreted as being related to a particular house and a date of sale on its own. Grapheme composition results in multiple graphemes being displayed as a spatially grouped conceptual unit--these need to be understood as such and interpreted accordingly.
• Interfering Graphemes: Unfortunately, grapheme composition does not
always result in a cluster where the graphemes are distinct and
Computational Linguistics Volume 24, Number 3
House
BEECHWOOD-ii74 BEECHWOOD-1950 BEECHWOOD-2266 BEECHWOOD-3237 BOULEVARD-3931 COLLEGE-637 DOUGLAS-5919 MOREWOOD-508 PENHAM-6828 SHADY-1205 SHADY-2263 SHADY-2908 WALNUT-6343 WELFER-1027 WIGHTMAN-1236 WILKINS-5735 WOODWELL-6663
$0K
©
[]
[]
A
[]
[]
[]
[]
[]
A
A
A
[]
Neighborhood
• POINT-BREEZE Q SHADYSIDE O SQUIRREL-HILL
Listing Agency
• CENTURY-21 COLDWELL
[]
[]
[]
$80K $1 OK $240K $320K
Rouse P r i c e
Figure 11
Comprehension difficulties can result from complex graphemes with multiple properties being used in the encoding.
non-occluding. Consider, for instance, the chart shown in Figure 8. The mark indicating the agency estimate of the selling price often overlaps with the interval bar showing the actual asking and selling prices. In some cases, the asking and selling prices are so close that the mark indicating the agency estimate actually occludes the interval bar. Clusters such as this can hinder interpretation and it is important that such mappings be clarified.
4.5 Alignment Complexity
As illustrated in Figures 6, 7, and 9, alignment of multiple charts and/or tables can be a useful technique for supporting comparisons, rapid lookups for many attributes of the same object, and for maintaining consistent scales. Whenever an alignment occurs, all but one of the charts become separated from the aligning axis labels and the relation between the aligned axis and the rest of the charts may not be clear.
[image:16.468.59.424.60.305.2]H o u s e
BEECHWOOD-Ii74
BEECHWOOD-1950 BEECHWOOD-2266
BEECHWOOD-3237
BOULEVARD-3931
COLLEGE-637
DOUGLAS-5919
MOREWOOD-508
PENHAM-6828
SHADY-1205
SHADY-2263
SHADY-2908
WALNUT-6343 WELFER-1027
WIGHTMAN-1236
WILKINS-5735
WOODWELL-6663
$0K
[] I I
C 3 I
C 3
D
I
I I
[]
I i
$80K $160K
H o u s e P r i c e
[113
I I
!
$240K
!
$320K
Figure 12
Complexities can arise from ambiguous mappings (a).
H o u s e
BEECHWOOD-ii74
BEECHWOOD-2266
BEELER-3931
DOUGLAS-5919
PENHAM-6828
SHADY-2263
SQ-HILL-1405
WELFER-1027
WILKINS-5735
Oct-89
1 8 5 K ~ i 6 3 K
I i O K ~ i 0 6 K
2 6 5 K ~ 2 5 5 K
95K[]89K
ii2K[~i00K
132K[]i21K
2 2 5 K o 2 1 9 K
150K[~i38K
3 5 0 K o 3 3 0 K
I i i i
Nov-89 Dec-89 Jan-90 Feb-90
Sale Date
Figure 13
Complexities can arise from ambiguous mappings (b).
shown in Figure 6. In this case, the mapping between the attribute asking-price and
[image:17.468.50.412.57.561.2] [image:17.468.42.412.70.322.2]Computational Linguistics Volume 24, Number 3
House
B E E C H - 3 2 3 7
M O R E W O O D - 5 0 8
P E N H A M - 6 8 2 8
V E R M O N T - 6 3 7
W A L N U T - 6 3 4 3
W O O D W E L L - 6 6 6 3
2 0 - O c t - 8 9
H a n n a
C o l d w e l l
C o l d w e l l
C e n t u r y - 2 1
I I I
i - N o v - 8 9 1 3 - N o v - 8 9 2 5 - N o v - 8 9
D a t e
C o l d w e l l
H a n n a
[image:18.468.37.431.63.255.2]I 7-Dec-89'
Figure 14
Presentations can have clusters of cooperative graphemes.
Data attribute temperature troop-size start-position stop-position battle-city battle-date battle-location
Graphical Element grapheme, property grapheme, property grapheme, property grapheme, property grapheme, property grapheme, property grapheme
[image:18.468.95.387.315.464.2]Complexity Type encoding complexity range complexity grapheme complexity compositionn complexity (i) grapheme complexity composition complexity (i) grapheme complexity composition complexity (i) composition complexity (c) ambiguous mapping composition complexity (c) ambiguous mapping composition complexity (c)
Figure 15
Result of the complexity assessment module for the "Minard Graphic" in Figure 1 (i and c are used to indicate interfering and cooperating graphemes respectively).
overlap and occlude each other (indicated by i for "interfering"). The annotated picture representation can then be used as one of the knowledge sources in the NLG system to select and structure information appropriately in generating the captions.
5. Generating Explanatory Captions
Data attribute Graphical Element Complexity Type
house axis
asking-price
selling-price agency-estimate date-on-market date-sold listing-agency
grapheme, property
grapheme, property grapheme
grapheme, property grapheme, property grapheme
[image:19.468.82.371.63.211.2]alignment complexity grapheme complexity ambiguous mapping composition complexity (i) grapheme complexity ambiguous mapping composition complexity (i) composition complexity (i) grapheme complexity ambiguous mapping grapheme complexity ambiguous mapping
Figure 16
Result of the complexity assessment module for Figure 6.
Text Planning Module. The text planner takes as input the goal to generate a caption, the picture representation generated by SAGE (annotated by the complexity module), and generates a partially ordered text plan. The leaves of the text plan represent speech acts about propositions that need to be conveyed.
Ordering Module. The ordering module takes a partially ordered text plan and imposes
a total order on the speech acts. This may be based on (i) domain-specific knowledge about orderings (for instance, knowledge about temporal order of events), or in the absence of this, (ii) knowledge about graphics (e.g., the left edge of a bar is discussed before the right edge of a bar).
Aggregation Module. The output of the ordering module is passed to an aggregation module that can combine multiple propositions into fewer, more complex ones. For instance, the module may combine some propositions regarding a grapheme into one complex proposition for more natural output.
Centering Module. Once clauses are ordered and aggregated, coherence of the generated
text can be further improved by selecting appropriate orderings between arguments of each clause. For this task, we have developed a selection strategy based on the centering model.
Referring Expression Module. The referring expression module analyzes the picture rep-
resentation and uses the discourse plan to determine appropriate referring expressions for the concepts in the speech acts.
Lexical Choice and Realization Modules. This lexical choice module picks lexical items and transforms the speech acts to functional descriptors (FDs) to be processed by FUF/SURGE (Elhadad and Robin 1992; Elhadad 1992), the realization module used to generate the English text.
5.1 Text Planning Module
Computational Linguistics Volume 24, Number 3
action operators and decomposition operators. Action operators capture the conditions (preconditions and constraints) under which an action can be executed, and the effects the action achieves if executed under the appropriate conditions. Preconditions specify conditions that the agent should plan to achieve (e.g., the hearer knows a certain term), while constraints specify conditions that the agent should not attempt to plan to change (e.g., facts and rules about the domain). Effects describe the changes that a discourse action is intended to have on the hearer's mental state. If an action is composite, there must be at least one decomposition operator indicating h o w to break the action d o w n into more primitive steps. Each decomposition operator provides a partial specification for a subplan that can achieve the action's effects, provided the preconditions are true at the time the steps in the decomposition are executed.
As an example of h o w action and decomposition operators are used to encode dis- course actions, consider the two operators in Figure 18. These two operators describe the discourse action describe-space-mappings, whose only effect is achieving the state in which the reader knows all the data-to-grapheme mappings shown. The first oper- ator is an action operator and it indicates that d e s c r i b e - s p a c e - m a p p i n g s c a n be used to achieve the state where the reader knows about the mappings. The second operator in Figure 18 is one of the decomposition operators for the d e s c r i b e - s p a c e - m a p p i n g s
action. The decomposition of a nonprimitive action can be expressed either in terms of subactions (:steps slot), or in terms of subgoals of one action's effect ( : r e w r i t e slot), or in terms of both. For instance, the :rewrite slot of the decomposition in Figure 18 specifies that one w a y to achieve describe-space-mappings's effect of having the hearer to know all the mappings in one space is to achieve the three subgoals of having the hearer to know all the interfering, cooperating, and vanilla mappings in that space. 9 This example also illustrates h o w the graphical complexity metrics are used for con- tent selection by the text planner: just as this operator can be used to describe spaces in which all three types of graphemes are present, there are other operators that deal specifically with encoder complexities, compositional complexities, etc.
As illustrated by the second operator in Figure 18, decomposition operators may also have constraints, which indicate the conditions under which the decomposition may be applied. Such constraints often specify the type of information needed for particular communicative strategies, and satisfying them causes the planner to find content to be included in explanations. For example, the constraints of the second oper- ator not only check that a single space is being described, but also find the graphemes of the three types used in the explanation, and the anchor mapping in this space. When the planner attempts to use a decomposition operator, it must try to satisfy all of its constraints. If a constraint contains no unbound variables, it is simply checked against the knowledge source to which it refers. However, if the constraint contains free vari- ables (e.g., ?int-graphs in the second operator), the system must search its knowledge bases for acceptable bindings for these variables. In this way, satisfying constraints directs the planner to select appropriate content to include in explanations. In the case of the operator shown in Figure 18, the two preconditions that must be satisfied are (i) that the reader must be able to
recognize
the space (i.e., know which space is being discussed, and the data set being visualized), and (ii) know what the anchor mapping in the space is (if any). Anchor mappings refer to the mapping between a functionally independent attribute (FIA)---usually thekey in
the database schema--and the axis it is mapped to. Thus, action and decomposition operators specify h o w information can be combined in a discourse to achieve effects on the hearer's mental state.Inpu~cData Data Characterization
Plan Operator
Library
I
f
I Graphic
[image:21.468.48.400.63.619.2]~ L
SAGE j j ~ K N N ~ [ Presentation
|pictore
\
, represe~,on
~ Complexity ~
[ Metric Module ]
I suggestions
for
~_
J
] picture modification
~.. f
~
/
to highlight examples
--| Text P l a n n i n g ~
_ ~
Example
I
~ ~ _
Module rig---generation ModuS)
Ordering ~
[ Optional
Domain
Specific Ordering
Module 7
I
Strategiesspeech acts ordered
Aggregation)
Module
~ speech acts aggregated
(
Module
)
I iscourse
plan annotated with
centering information
(
Referring ~
Expression
Module
I onceptual descriptions in plan leaves
replaced by referring expressions
Lexical Choic/
Module ~1
I FDs
FUF/SURGE)
~ English sentences
T h e s e t w o c h a r t s s h o w i n f o r m a t i o n a b o u t ...
picture representation
annotated with
complexity assignments
Figure
17Computational Linguistics Volume 24, Number 3
(define (action describe- space-mappings )
:description "describe all mappings in a
:parameters (?space)
:primitive nil
:effect ( (know-all-mappings ?space) ) )
space"
(define (decomposition describe-space-mappings )
:descnption "Describe mappings : +C+I+V"
:constraints ( (space-p ?space)
(single-space? ?space)
(get-interfering-graphemes ?space ?int-graphs) (get-cooperating-graphemes ?space ?coop-graphs) (get-vanilla-graphemes ?space ?vanilla-graphs) (get-anchor ?space ?anchor-axis ?anchor-domain))
:preconditions ((recognize-space ?space)
(know-mapping ?space ?anchor-axis ?anchor-domain))
:steps ((begin (start ?space))
(end (finish ?space)))
:rew~tes (((know-all-mappings ?space) ((forall ?ig in ?int-graphs
(know-all-interfering-mappings ?ig ?space)) (forall ?cg in ?coop-graphs
(know-all-cooperating-mappings ?cg ?space)) (forall ?vg in ?vanilla-graphs
(know-all-vanilla-mappings ?vg ?space))))))
Figure 18
Sample plan operators.
5.1.1 Generating Discourse Plans. Planning begins when a set of communicative goals are posted to the text planner. The system generates a plan by iterating through a loop that refines the current plan (either decompositionally or causally), checking the plan after each refinement to ensure that it has not introduced any errors. Decompositional refinement selects a composite action and creates a subplan for that action by adding instances of the steps listed in the decomposition operator to the current plan. Causal refinement selects an unsatisfied precondition of a step in the plan and adds a causal link to establish the needed condition. This is done either by finding a step already in the plan that achieves the appropriate effect, or by using an action operator to create a new step that achieves the needed condition as one of its effects. For a complete definition of the algorithm, its computational properties, and its utility for discourse planning, see Young, Pollack, and Moore (1994), and Young and Moore (1994).
In the remainder of the section, we present the modules that follow the text plan- ning process and implement tactical decisions. To clarify the discussion, we describe how each module contributes to the generation of clauses (3) to (5) in the sample caption shown in Figure 19.
5.2 Ordering Module
Sample caption
(1) This chart presents information about house sales from data-set TS-2480. (2) The y-axis shows the houses.
(3) The house's selling price is shown by the left edge of the bar (4) whereas the asking price is shown by the right edge.
(5) The horizontal position of the mark shows the agency estimate.
Figure 19
A representative caption used to illustrate our discussions.
do not have causal links between them dictating the ordering. The ordering module takes as input the discourse plan, with links specifying the ordering relations between subtrees, and orders the leaf nodes--the speech acts--based on a set of heuristics. In our application, for instance, unless otherwise indicated, the system will describe the left edge of the bar before the right edge} °
The ordering module sorts first on the basis of the space ordering. This is based on the assumption that in the absence of any other discourse strategy (such as the need to emphasize or compare properties of a concept across multiple spaces), the reader will browse the spaces from left to right. After the plan steps have been sorted on a space-by-space basis, the module sorts plan steps on the basis of their graphical mappings, using the following ordering heuristics:
position > color > shape > size > text > others
Finally, within each resulting subset, the module orders steps by grapheme type using the following ordering:
line set > bar set > mark set > text set > others
The strategy of ordering first by graphical mapping and then by grapheme type is based on our analysis of hand-generated captions. We found that most captions tended to be structured along the mappings rather than along the graphemes.
Let us now examine how the system's ordering rules determine the ordering among clauses 3-5 of the sample caption shown in Figure 19. First, clauses 3-5 are grouped together because they are all mappings to position. Second, clauses 3-4 pre- cede clause 5 because bar set must precede mark set. Finall.~ clause 3 precedes clause 4, because of the conventional preference for left-to-right ordering between edges of floating bars.
So far, we have examined the ordering strategy that the system will follow by default. However, the ordering module can also take an optional input, a functional specification, which can be used to determine plan step orderings that do not con- form with the default ordering. Using this optional specification, the system can take advantage of domain knowledge, such as temporal sequencing, which can play an important role in discourse sequence. For instance, in general it m a y be preferable to state the mappings of the left and right edges of a bar in that order. However, if the left edge of a bar indicates selling-price and the right edge indicates asking-price, and the usual temporal ordering between the events suggests that one discuss the asking
Computational Linguistics Volume 24, Number 3
price of a house before the selling price, this would lead to mentioning the right edge before the left edge, contrary to the default ordering.
5.3 Aggregation Module
Once the speech acts are ordered, they are passed to the aggregation module. In the general case, aggregation in natural language is a very difficult problem (Dalianis 1996; Shaw 1995; Huang and Fiedler 1996). Fortunately, our generation task requires a type of aggregation that is relatively straightforward. Our aggregation strategy only conjoins pairs of contiguous propositions about the same grapheme type in the same space. The module checks for grapheme types rather than specific graphemes to cover circumstances where, for instance, a chart may have a number of grey and black bars (which are different graphemes of the same type). This enables the system to generate text of the form "The grey bars indicate the selling price of the house, whereas the black bars indicate the asking price."
When two propositions are combinable, namely they are about the same grapheme type in the same space, the system checks to see ff the two properties being discussed are contrastive in some way. For instance, whether the two properties under consider- ation are the opposite edges of a bar, or are the X and Y axes, etc. If so, the system picks a contrastive cue phrase (e.g., whereas) to merge the clauses resulting from the two propositions, otherwise the system picks the cue phrase and.
Let us now briefly examine h o w aggregation affected clauses 3-5 of the sample caption in Figure 19. Clauses 3-4 were conjoined because they are about the same grapheme type, a horizontal bar, in the same space. Moreover, the module placed a
whereas cue phrase between the two clauses, because the opposite edges of a bar are considered contrastive properties.
5.4 Centering Module
Once clauses are ordered and aggregated, coherence of the generated text can be fur- ther improved by selecting appropriate orderings between arguments of each clause. For this task, we have developed a selection strategy based on the centering model. Focus (e.g., Sidner 1979; Grosz 1977) and centering (e.g., Grosz, Joshi, and Weinstein 1995) models are attempts at explaining linguistic and atttentional factors that con- tribute to local coherence among utterances. Although focus and centering models were originally developed as foundations for understanding systems, they have fre- quently been proposed as effective knowledge sources for NLG systems. In particular, for generating referring expressions (including pronominalization) (see Dale [1992], Ap- pelt [1985], and Maybury [1991]), for deciding when to combine clauses (subordination and aggregation) (see Derr and McKeown [1984]), and finally for choosing appropri- ate inter/intraclause orderings, namely, ordering between clauses and between their arguments (see Maybury [1991], Hovy and McCoy [1989], and McKeown [1985]).
Details on centering theory and its relation to discourse structure can be found in Grosz, Joshi, and Weinstein (1995), Walker (1993), Walker, Iida, and Cote (1994), Grosz and Sidner (1993), and Gordon, Grosz, and Gilliom (1993); for lack of space in this paper, we only provide a minimal introduction to the basic terminology of centering theory.