THE SPAWNING OF ECHINUS ESCULENTUS AND
SOME CHANGES IN GONAD COMPOSITION
BY F. C. STOTT, B.SC.
Herdman Research Scholar in the University of Liverpool.
(Received z6th August, 1930.)
(With Six Text-figures.)
I. INTRODUCTION.
THE gonads of Echinus esculentus, by reason of their size and ease of dissection, are excellent material for a study of the biochemical changes involved in the maturing process of development. Through frequent visits to the Biological Station, Port Erin, Isle of Man, extending from November 1929 to July 1930, an attempt has been made to follow the changes in the condition of the gonads and correlate them with the sea temperature cycle on the one hand, and the water, glycogen, fatty acid, and to some extent the total carbohydrate content on the other. Throughout the latter work the sexes have been examined separately with a view to finding if any marked sexual differences in metabolism existed. All the sea urchins examined were be-tween 9 and 12 cm. horizontal diameter.
II. THE HABITAT AND MIGRATION OF ECHINUS ESCULENTUS • AT PORT ERIN, ISLE OF MAN.
There are two well denned regions at Port Erin where this sea urchin can be obtained throughout the year:
(1) On the concrete blocks of the ruined breakwater, where at low water spring tides a minimum of twenty to thirty can be obtained using a 3-foot hand net. (2) From the Scallop Beds, a gravel patch, about a mile offshore in 20 fathoms of water, where scores can always be obtained using a drag net.
The animals used for biochemical work were all freshly collected off the breakwater.
Six comparable sets of readings are given in Table I and are shown graphically in Fig. i. Since large quantities of sea urchins are collected each Easter off the break-water both by students and fishermen, the inshore migration is really greater in magnitude than that recorded; the June count should doubtless be increased for the same reason.
Table I.
Date
1929. Nov. 6 1930. Jan. 14
Feb.14
„ 27
Mar. 31 June 27
Depth of tide in feet
19 21 22 20 22 22
Approximate number seen
5°
100 200 400 400 200
Sea surface
Calm Calm Calm Calm
Calm after rough cold spell Calm
The distribution of Echinus at Millport as described by Elmhirst (1922 b) closely resembles that at Port Erin. Elmhirst points out that a similar shoreward spawning migration is known to occur in eight other invertebrates, chiefly boreal species. Occasionally single individuals were obtained high and dry on the breakwater in November, December and January at dead low water springs. In February and March as many as forty stranded individuals have been seen on the portion of the breakwater kept under observation. A summary of records of the occurrence of Echinus on the foreshore in the British Isles is given by Orton (1929). E. esculentus is completely absent from the foreshore in the Plymouth district and north Cornish coast, whilst at Millport and Port Erin reliable records show its regular occurrence there. At Robin Hood's Bay, Echinus occurs low in the intertidal zone at equinoxial springs. Orton (1929) suggests that there may be a critical temperature above which natural spawning takes place. At Plymouth such a temperature is attained in March in offshore waters and, moreover, exposure of the foreshore at low water springs always occurs here about noon in the heat of the day. At Port Erin and Millport, by reason of their more northerly latitudes, offshore sea temperatures are lower than at Plymouth: inshore migration results, therefore, in the exposure of some animals to a zone of higher temperature particularly at low water springs, which here occur in the early morning and late afternoon, and at the same time avoids the high temperatures associated with the noonday sun. It is perhaps, however, significant that this inshore migration takes place in late February when the gonads are depleted of their chief carbohydrate reserve—glycogen—and provides an oppor-tunity for a more abundant carbohydrate diet, since the richer Laminarian zone is invaded.
III. THE SEASONAL CONDITION OF THE GONADS AND SEA TEMPERATURE.
firm and transverse section revealed the presence of oocytes embedded in a germinal matrix, each with a nucleus and vesicular space. In February, puncture of the testes resulted in the outflow of a little sperm suspension: the ovaries, too, were more mature, as shown by their gelatinous appearance and ease of fracture. Judging from general appearance the gonads were ripe at the end of February. The first recorded spawning occurred on February 27th—a female which had been kept in the tanks for 2 days. The resulting eggs were fertilised with sperm obtained by cutting a testis, and successful development took place to at least the gastrula stage. Throughout March and early April there were constant spawnings of individuals kept in the tanks: this can only be taken however as indicating the ripeness of the gonads. No spawnings of individuals on the breakwater were observed, and no spent individuals were obtained at this time. Prof. Orton informed me that between April 9th and 22nd the gonads of all Echinus examined by the Easter Class were full, i.e. natural spawning had not taken place. All gonads of a total of sixty individuals examined at the end of June and beginning of July were spent. It was at this time extremely difficult to distinguish the sexes, since very few active sperms were present in the testes and numerous clear gonocytes, which at first sight looked like young oocytes, were present. In the spent ovaries there were a few eggs, together with numerous small cells resembling senescent spermatozoa and larger clear spherical cells. It was therefore concluded that natural spawning had taken place in late April, May and perhaps early June.
Routine sea (taken from the breakwater steps) and air temperature observations made each day by the Biological Station staff at 9 a.m. and 4 p.m. were recorded.
By averaging each group of fourteen weekly observations the accompanying Table II and Fig. 1 were drawn up.
Table II. Weekly means, sea and air temperatures, Port Erin Bay, 1929-30.
Week ended Nov. 2 9 16 23 3° Dec. 7 14 2 1 2 8 Jan. 4 1 1 18 25 Feb. 1 8 15 2 2 Air (°F.)
4 9 6
5 0 0
43 9 4 7 9
4 8 2
47-4 4 6 6 44-1
4 2 9 4 5 9 4 3 7
43 7 44-5 39'2 39'4
3 9-6
3 8 7
Sea (°F.) 53-2 53-i 5i-4 5i-3 5i-3 51-2 50-2 4 9 7 4 8 7 4 8 5 48-1
4 7 1
4 7 4 4 6 4 45-3 4 4 6 44'5 Week ended Mar. 1 8 I S 2 2 2 9 Apr. s 1 2 19 26 May 3 1 0 17 2 4 3 i June 7 14 21 28 Air (°F.) 41-8 45-2
4 0 7
39-3 4 6 6 4 6 8 4 6 7 4 6 7 5 1 1 55-6 52-8 SS-6 S7-i 64-2 6 7 7 6 4 3 687 649
Sea
(°F.)
44'S
4 5 °
44-8
4 3 7
4 4 7 4 5 '1 45'2 4 5 7
4 6 0
4 6 3
4 7 1 4 7 9
49'4 5U 4 C I "C
J x J C2" T 5* 1 529 54-6
F. C. STOTT
Elmhirst (1922 a) states that spawning continues until the end of August at Millport but not only were the gonads practically free from eggs and active sperm in all individuals examined at the end of June at Port Erin but their water and glycogen contents were vastly different from those of ripe individuals.
Orton (1920) has shown that a broad correlation exists between sea temperature and breeding in some marine animals. The European oyster—Ostrea edulis—begins to spawn at a mean temperature of i5°-i6° C. throughout its geographical range, and continues to produce sexual products so long as the temperature remains above that figure. In the case of the mackerel, Scomber scomber, spawning occurs above 12-130 C. throughout its geographical range. Amirthalingam (1928) has shown that in Pecten opercularis, at Plymouth, spawning takes place periodically whilst the temperature is below the critical temperature of n ° C.
r400 70c
65°
60°
55C
50c
45C
40<
COUNTS of ECHINUS on .200 BREAKWATER
MINIMUM
SEA TEMP
NOV. JUNE
Fig. 1. Weekly means, sea and air temperature, Port Erin Bay, 1929-30, and spring inshore migration of Echinus on the breakwater.
In Echinus, natural spawning occurred at Port Erin during 1930 in late April, May and perhaps early June, when the sea temperature is rapidly rising between 460 and 510 F. Examination of spawning data from other regions may bring to light some correlation, since E. esculentus is fairly widely distributed between the limits of Iceland to the north, Finmark to the east, and Portugal to the south, according to Mortensen (1927).
IV. GLYCOGEN IN THE GONADS. (a) Introduction.
Fehling method. Sixteen estimates were performed, the percentage glycogen in dry tissue being calculated on the assumption that the gonads contained 82-8 per cent, water in each case. Their results are summarised in Table III and show that: (i) Using this particular method of estimation, there is considerable individual variation in the glycogen content of gonads but no constant difference between the sexes.
(ii) After a period of 19 days' starvation there is no considerable reduction in glycogen content.
This last conclusion can only be taken tentatively owing to the paucity of the estimates.
Table I I I . Glycogen as percentage of dry weight gonad {Moore, Whitley,
and Adams).
Date
Aug. 22, 1911
Estimate (1) Estimate (2) Estimate (3)
Apr. 10, 1912
Normal fed individuals
<?
H"3 8-66
7-14
7-6
?
u - 6
9 3 6 8-4
6 2
Unfed for 19 days
10-84 7-91 11-13
I I - I
$
7'47
2 - 1
S'39
9-1
Remarks on estimation
On fresh gonads
On gonads extracted with hot alcohol Extracted with cold alcohol
On hot alcohol extract
Delaunay (1927) gives one estimate for the glycogen content of the gonads (sex and season not stated) of the sea urchin, Paracentrotus Hindus. He used the Pfliiger method, and the percentage of glycogen in the wet tissue is given as 1-50, which is equivalent to 8-8 per cent, of the dry tissue.
There is thus evidence that glycogen is present in the gonads of the sea urchin in quantities which suggest that its role is that of a reserve material of some kind. Daniels (1921) has shown that the depletion of glycogen in the tissues of the mussel, Mytilus edulis, is correlated with the maturing of the gonads. This is substantiated by Creighton's (1896) microscopic observations that decrease in glycogen in the follicle cells round the ovary and testis takes place as they mature. The Government chemist (Fisheries Investigations 1923) working on the seasonal variation in the chemical composition of the oyster, Ostrea edulis, found that a minimum of both carbohydrate and glycogen occurred at the end of May prior to spawning: decrease in glycogen was not correlated with increase in percentage carbohydrate other than glycogen. Russell, in discussing these results, concluded that glycogen has a dual function, for not only does it serve to maintain the animal's metabolism during the winter non-feeding period, but it is certainly utilised in the development of the sexual products.
The investigation herein described was undertaken to ascertain:
[image:5.451.34.413.121.358.2](ii) The physiological state of the glycogen as shown by its stability post mortem and on raising the temperature of isolated tissue. It is well known that the glycogen in all muscular tissues so far examined and in the liver of vertebrates, is extremely unstable and rapidly disappears post mortem. This disappearance is probably due to the presence of a sensitive enzyme system and to the rapid removal, either by oxidation or further combination, of the end products of glycogenic breakdown. In the oys.ter, the Government chemist (1923) states that the glycogen content was lowered by about half on drying the tissues at 6o° C , and in the mussel Daniels (1921) found, on leaving the animals out of water for 4 days, that a dis-appearance of about one-third of the total glycogen occurred. Although much larger quantities of glycogen are being dealt with in these molluscs, its disappearance is relatively very much slower than in muscle, a fact which can be readily understood if the glycogen in these invertebrates is to be elaborated as a food reserve for the ripening gametes, instead of being immediately combusted to provide energy.
The estimation of glycogen necessitates the use of wet tissue: the results, how-ever, should be calculated on the basis of dry weights, so as to ensure against possible seasonal variations in water content. The seasonal water content of the gonads was, therefore, examined along with their glycogen content.
(b) The water content of the gonads.
Since no vacuum drying oven was available, the tissues had to be dried in air with the consequent possibility of error due to oxidation of such constituents as unsaturated fats which have been shown to be present. Two methods were com-pared, the one giving greater loss in weight being adjudged the more efficient. Twelve pieces of gonad were taken—a pair from each of six individuals. The first set, after weighing, were dried in porcelain basins for three hours on a boiling water bath, and then, after cooling, left in a vacuum desiccator over strong sul-phuric acid. The dry weight was determined next day. The second set were cut up and spread out in Petri dishes 11 cm. in diameter, and dried for one day {i.e. to constant weight) at 48°-5O° C. The results are shown in Table IV-and graphically in Fig. 2.
Table IV.
Indi-vidual No.
1 2
3 4 6
Method 1
Wet weight gonad
(gm.)
24-00 3092 21 -oo
997 13-12 8-84
Dry tissue
(gm.)
4-23 5-66 428 183 2-2O i-6o
Loss in weight (%)
82-4 81-7 796 8i-6 83-2 819
Method 2
Wet weight gonad
(gm)
24-25 17-50 17-18 6-42 1801 1295
Dry tissue (gm-)
377 248 301 117 297 233
Loss in weight (%)
84-4 858
825 8i-8 83-5 82-0
Table V and Fig. 3 show the dry weight estimates of the gonads of 118 different individuals of size between 9 and 11 cm. horizontal diameter: 47 of these, up to and including February 1st, were of unripe gonads; 50 of nearly or fully mature gonads;
8 6r
85
84
1 82
to 81
80
METHOD 1
[image:7.451.127.329.135.355.2]1 2 3 4 5 6 No. of individual
Fig. 2. A comparison of methods for estimation of water in the gonads.
•§>
1
•a
DEC. JAN. FEB. MAR. APR. MAY JUNE
Fig. 3. Seasonal variation in percentage dry weight of gonad.
[image:7.451.62.397.400.567.2]spermatozoa contain large amounts of nuclear material in contrast to the eggs. Spent gonads have a lower water content, the female having slightly less water present than the male, as might be expected if the developing eggs drew on the water resources of the rest of the gonad.
Table V. Percentage dry weight of entire gonad Echinus esculentus.
Condition Immature Nearly mature Mature Spent Date Dec. s Feb. 1 Feb. is
»
2°
» 28 Mar. 15 Apr. 2 July 1 No. sampled 17 3° 8 6 1 2 6 18 2 1
Dry weight (%)
3
i6-s
19-9 1 6 6
1 6 6 1 8 0 1 8 1 1 8 0 2I-I 1 8 1 1 6 3 1 6 1
18-2 19-9 1 9 9 1 9 1
2 1 7 22'4
2O-I
17-9 1 9 1
1 9 7 18-2 18-5 21'2 19-3
2 0 3 21-3 21-2 19-0 19-1
1 9 0
1 8 8 18-2 22-2
14-9 1 7 7 1 6 7 17-2 I7-O 17-2 1 6 2 —
19-4 2 0 7
17-3 — 19-9 18-9 22"I 2O-O 2O-I 18-8 2O-8 1 8 6
—
1 9 7 20-8 19-4 19-6 2 1 7 19-1 1 9 7
Average for<J
18-6
17-3
1 9 5
1 8 7
20-8
19-0
1 9 3
1 9 9
Dry weight (%) $ 19-5 17-1 17-9 16-2 iS-6 1 6 5
1 1 7 17-2 i 8 -5 1 8 0 1 7 7 16-0 1 7 5 1 7 2
13-9
!S-4
14-1 1 4 9
IS'O 14-1 13-1 14-1 13-8 12-2 I4-I
13-0 11 7 1 2 9
20-2 2 1 5 1 8 6 2 1 7
I9'6 17-2 I3'2 iS-4 I7-S 1 8 0
14-8 •179
1 6 8 17-2 1 3 6 17-4 1 5 7
iS-6 1 4 7
14-4 —
I5g3 1 4 7 IS-3
12-6 —
1 4 0 1 4 9 1 3 8 i5-i —
I9'O 2 0 8
2 2 0
—
Average for?
17-0
i6-S
1 4 9
14-5
14-6
i3-5
I3-S
20-5
The specific gravity of the gonads. Sixteen determinations of the specific gravity of the gonads were made; ten on February 1st and six on April ist, that is, on unripe and ripe gonads respectively. The gonads were simply attached to one arm of a balance by means of a thread with a hook at the end and weighed in air and in water. The results are shown in Table VI.
Table VI.
141
Date
Feb. 1
Apr. 1
Specific gravity of female gonads
1 -040 1 -043 1-058 1-053 1-040 1-051 1-040 1-041 1 046 —
Average for female
1-048
1-042
Specific gravity of male gonads
1 -046 1 -048 1-052 1-052
1-052 1-054 I'OOI
Average for males
1-049
1-056
(c) Method of estimation of glycogen.
Essentially the procedure described by Pfiiiger (1905) was adopted, the reducing sugars being estimated by the Hagedorn and Jensen (1923) method.
In the majority of gonads it was sufficient to cut free only one piece of gonadic tissue: this was quickly weighed, placed in a porcelain basin with 0-25 c.c. of 60 per cent, potash for each gm. of tissue and left for 3 hours on an evaporating bath, a little water being added from time to time to prevent the formation of caramel. After cooling, the solution was made up to 65 per cent, alcohol and the glycogen sludge so formed left to settle overnight or, if convenient, for a whole day. It was then filtered off, using a Buchner funnel with very slight suction, and, after washing with 65 per cent, alcohol, transferred to a porcelain basin with 50 to 100 c.c. of hot 3 per cent. HC1 and left for 5 hours on a boiling water bath. The hydrolysate after filtration was made up to exactly 200 or 250 c.c. and an aliquot portion taken for sugar estimation using the Hagedorn-Jensen reagents of strengths given by Boyland (1928). Periodically the HC1 and KOH were tested for reducing substances, the results being always negative.
This method is only of use in showing seasonal variation, and not variation in absolute amounts, since:
(i) The percentage of Echinus glycogen converted to glucose in 5 hours' hydrolysis is unknown and, from the figures given by Harden and Young (1902), there is considerable variation in percentage glycogen hydrolysis (from 93 to 98-3 per cent.) between the glycogens from rabbit, yeast, oyster and mussel. All calcu-lations have, for convenience, been made on the assumption that 100 per cent, conversion took place.
(ii) Sugar values tend to be too high, due to the presence of protein degrada-tion products. Holden (1926) and, later, Needham (1927) have shown the Hagedorn and Jensen method to be less sensitive to error from amino acids than copper reduction methods, but the following experiment demonstrates that a small error is present, due to a coupled oxidation of glucose and amino acid occurring in the presence of the ferricyanide: the sugars in the hydrolysates from three different gonads were estimated: a known amount of pure glucose solution was added to each and the estimations again performed. The percentage recovery of glucose was calculated. The results are given in Table VII.
Table VII. Titre values Hydrolysate alone (H) S-7 8-o 4-8 Glucose alone (6) S-6 S-7 6-o Hydrolysate + glucose together (H+b) n-4 I3'7
I I - I
Theoretical H+b " 3 13-7 io-8 Recovery of glucose (%) 101-7 ioo-o 105-0
(d) Seasonal variation in glycogen content.
All the sampling was done on individuals having tests of a horizontal diameter between 9 and 12 cm. collected from the breakwater shortly before the performance of the estimation. The results of 163 estimates are set out in Table VIII and Fig. 4.
Table V I I I . Percentage glycogen worked out on wet weight tissue.
Date Nov. 5 Dec. 30 Jan. 12 Feb. 1 Millport Feb. 15
»> 2 0
„ 28
Mar. 1 s
„ 18
Apr. 2
July 1
N o .
7 6 16 3° 1 2 1 0 1 2 16 18 18 18 1-9
i - 3
1-9 i-S 2-1 1-2 o-8 0-7 o-8
I - I
o-8 i-o 07 o-6 o-6 o-8 o-i o-i 2-3 3-3 i - 3
i - 8
2-1 I-I
i - 4 i - o I-I o-8 o-6 o-6 o-5 O-2 o-6 O-2 0-4 O-2 2-7 2 9 Male
i - S 2 - 0
1-7
o-g i-3 o-g
i - 9
0-7 i-o o-S 1-2 0-2 o-i O-2 o-5 3'3 2-7 2-O 1-7 1-3 i - 4
I - I
i - 6
I - I
i - o
0-7 o-8 0-7 o-i o-i o-i 2-7 2-6
i - 3
1-2 i - 6 o-8
0-9
o-6
i - 4
o-6
1-2
o - i
2-O 2-6 Av. 1-7 1 7 i-6 1-2 I-O o-8 0 9 o-6 o-S
0 - 2
2 7 1-7
1 9
i-6 i - o
0-7 1-2 I-O 0-7 o-8 o-6 0-7 o-6 0-3 o-6 03 o-6 O-2 O-2 2-3 3'3 Female 1-7 1-2 i-S I-O I - I
i-8 i-4 i - o
0-4 o-6 0 4 0-4 0-4 0-2 o-i 2-4 27 2 0 1 9 i-3
I - I
i - 8 i - 6 2-2
o-8
o-8
I-O
0 - 4
0-4 o-i o-i 0-4 3 0 2-8 i-3
I - I
i-4 2-O i-o
I - I
i - o
o-5 o-6 o-6 0-3 o-i 04 2 7
i ' 4
1-2 0-9 I-O i-o 0-9 o-6 o-S o-S
o - i
2 9 Av.
i - 8
i - 7
i - 3
i - 3
0-9 0-7 0 7 o-5 0 4 O-2 2-8
The percentage of glycogen has been calculated on the basis of dry weights by using the figures previously given for the percentage dry weight of gonad tissue.
3 Or
I 2-0 8
"5b 3
1-0
0-5
0-0
[image:11.451.53.404.118.297.2]NOV. DEC. JAN. FEB. MAR. APR. MAY JUNE
Fig. 4. Seasonal variation in percentage glycogen expressed as percentage of wet weight.
13
11
I
"5b
c
4J
DEC. JAN. FEB. MAR. APR. MAY JUNE
Fig. 5. Seasonal variation in percentage glycogen in dry tissue gonad.
[image:11.451.58.394.337.568.2]144
Table IX.
Date Dec. s Feb. i „ is „ 20 „ 28 Mar. 15 Apr. 2 July 1 Male (%) Dry weight 186 I7'3 I9'5 187 208 19-0 193 199 Glycogen on wet weight 17 I'2 1-0 o-8 0-9 o-6 0-2 27 Glycogen on dry weight 9 1 7-1 5'i 4'3 4'3 3'2 i-o 136 Female (%) Dry weight 170 16-5 149 I 4I
14-0 13-5 135 20-5 Glycogen on wet weight 17 1-3 09 07 07 o-S O-2 2-8 Glycogen on dry weight IO -O 7-9 60 4-8 47 37 i-5 137(e) Glycogen in ripe sperm and eggs.
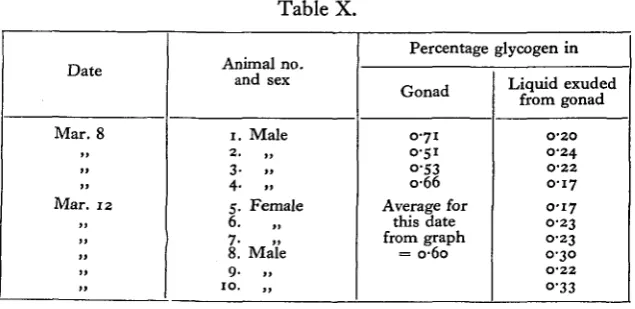
Mature gonads were cut and suspended, the fluid which dripped out being collected in porcelain basins. In the first four cases glycogen estimates were per-formed on uncut pieces of gonad taken from the same individuals as the cut ones. Undoubtedly unripe cells and interstitial tissue were collected along with the sperm or eggs. The results given in Table X show quite definitely that the ripe gametes have much less glycogen in them than the gonad tissues. It might be contended that this result was due to the higher water content of the liquid collected from the gonads, but dry weight estimates showed this to be untrue.
Table X.
Date
Mar. 8
Mar . 12
Animal no and sex 1. Male 2- „ 3- .» 4- .. 5. Female 6. 7* »» 8. Male 9- .. 10. „ Percentage Gonad
0 7 1 0-51
°-53
0 6 6
Average for this date from graph = o-6o glycogen in Liquid exuded from gonad O'2O 0-24 O-22 0 1 7
0-17 0-23 0-23 0-30 O'22 °-33
145
(/) The stability of glycogen in the gonads.
Ritchie (1927) comments on the failure of many observers to find glycogen in fish and crustacean muscle, and remarks that "it is due to their not realising the rapidity of its disappearance post mortem. " In the gonad of Echinus, however, there is only a slow disappearance of glycogen post mortem, as in the case of the mussel— Daniels (1921), and oyster—Government chemist (1923).
The following experiment was performed on gonads rich in glycogen taken from the July 1st catch: one piece of gonad was removed from each of five different individuals and, after weighing, removed to a porcelain basin, covered with watch glass, and kept for 94 hours at room temperature (= 18° C). Glycogen estimates were immediately performed on a corresponding set of gonads, and eventually compared with those obtained from the stored gonads. The results are set out in Part A of Table XI, and show that never more than 67 per cent, of the glycogen disappears on keeping for this length of time. Experiment B, performed on February 24th, when the glycogen content was about 0-9 per cent., demonstrates the stability of the glycogen at a temperature particularly favourable for enzyme action, viz. 280 C. The figures given in column 3 of Table XI represent the percentages of glycogen found in gonads after keeping for 4 ! hours at this tem-perature.
Table XI.
Animal no. and sex
A. 1. Male 2. „ 3. Female 4- »
5-B. 1. Male 2. „ 3. Female 4- .,
Percentage glycogen
(1) In fresh gonad
23 27 3 0 2-3 2'4
1 - I
4 0-56
I-OI 0-90
(2) post mortem
94 hrs. at 18° C. i - 6 '•4
i-3 i-4
o-8
4f hrs. at 280 C.
10
°'55 0-89
0-70
Glycogen loss as percentage of total glycogen
30
48 57 39 67
7
2 11 21
Thus the stability of the glycogen in Echinus gonad, the mussel and oyster, offers a strong contrast to its state in the muscles of other marine poikilotherms.
V. TOTAL CARBOHYDRATE IN THE GONAD.
F. C. STOTT
removal of undecomposed protein, basic substances, and certain amino acids, all of which would reduce the ferricyanide solution later on in the Hagedorn-Jensen sugar estimation, was accomplished by addition of 20 per cent, phosphotungstic acid made up in 5 per cent, sulphuric acid. It was found necessary to add about 6 c.c. of this solution to bring about complete precipitation. The filtrate was neutralised with saturated barium hydroxide solution, and excess barium removed by addition of weak sulphuric acid. The clear solution was then evaporated down to a convenient bulk, and the glucose estimated in an aliquot portion by the Hagedorn-Jensen method.
[image:14.451.59.394.331.548.2]Only fifteen estimates were performed, but fortunately the time with which they are concerned was a critical one when the percentage of glycogen was falling rapidly. The percentage of glycogen was estimated in pieces of gonad from the same individuals as those used for the total carbohydrate estimation, so that the percentage of other carbohydrates besides glycogen could be calculated, and these results are set out in Table XII. Using average figures the table shows that whereas glycogen has decreased between March 18th and April 2nd from o-6 to 0-2 per cent., the carbohydrates other than glycogen have increased from 0-4 to 1-2 per cent. The conclusion, however, that glycogen is transformed in the maturing gonads to other carbohydrates is tentative and awaits the performance of further estimates.
Table XII.
Date
Mar. 18
Apr . 2
Animal no. and sex
I. Male
2 .
3-4. Fer
5-6. 7-8. 9. Ma
1 0 . 1 1 .
12. Fer 13-
14-, nale
t
I
le
t
nale
15. Male
Percentage of
(1)
Glycogen
o-8 0 7
o-6 o-6 o-S
0-4 0-4 0-3
O-2
0-4
O-2 O-2 O-2 O-I O-I
(2)
Total carbo-hydrate
i - o
< <
c [ - 0 [ • 1 [ - 2 [ - 2
5-6 5-5
[ - 2
5-7
t-9
[ - 1
[•4 t-I • I
8
By subtrac-tion, carbo-hydrates other than glycogen
0 - 2
0 3
°'S o-6
0-7
O-2 O-I
0-9 o-S 1-5 0-9
1-2
0 9 i - o 1 7
VI. THE FATTY ACID CONTENT OF THE GONADS.
soluble substances at the same time. The results of 56 estimates are set out in Table XIII. The differences between individuals are great, but there is no significant alteration in the average figures for the pre-spawning and spawning periods.
Table XIII.
Dates
Nov. 5, Dec. 29, Jan. 5
(Immature gonads)
Feb. 18, 28, Mar. 18, Apr. 2
(Maturing and mature gonads)
Percentage crude fatty acid
Male
3'5 3'9 3 0 3 ° 4 4 4-4 3-6 3 0 28
Average = 3-5
1-7 2-4 4-5 5-0 2-6 3-5 I-I 3 2 4-3 37 3 5 1 "9 58 4-2 4 7
Average = 3-5
Female
3-1 4-6 3-3 4 2 3 6
3-3 2-8 3 3 4-2 5-1 2-4 4-2 33 3-6
Average =3-6
I-I 2 9 3 4 3 0 3 0 5 0 31 2-9 27 31 3-0 3-6 2-7 27 3-2 5-0 2-s 3-0
Average = 3-1
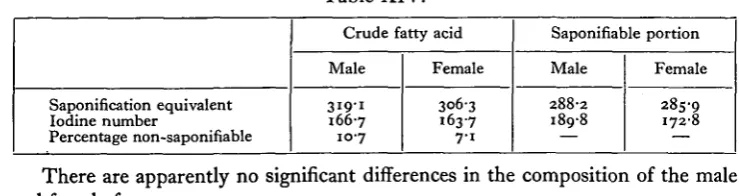
[image:15.451.38.408.327.425.2]The analyses set out in Table XIV were made by research workers in the Department of Industrial Chemistry, Liverpool University, through the kindness of Prof. Hilditch.
Table XIV.
Saponification equivalent Iodine number
Percentage non-saponifiable
Crude fatty acid
Male
319-1
166-7
10-7
Female
3063 163-7 7-1
Saponifiable portion
Male
288-2 189-8
Female
285-9 172-8
There are apparently no significant differences in the composition of the male and female fats.
VII. DISCUSSION.
It has been shown that a fall in the percentage of glycogen in the gonads takes place during February, March, and early April, when the gonads are almost or fully mature, but unfortunately it is not known if a further decrease takes place during April, since no estimates were performed between April 2nd and July 1st.
148
those months": hence the glycogen minimum occurs prior to the maximum spawning time. In oysters on the Whitstable beds spawning begins usually about the middle of June, so here again there is a glycogen minimum prior to spawning. The succession of times of onset of spawning is, therefore, in the order Mytilus, Echinus, Ostrea, which is the order of occurrence of glycogen minima.
34
31
JUNE
Fig. 6. Seasonal variation in percentage glycogen in Echinus gonad and flesh of Mytilus and Ostrea.
Table XV.
Echinus
Date
Dec. 5
Feb. I „ IS •' 2S „ 28 Mar. i s
Apr. 2
July 1
(gonad only)
Glycogen
9-6 7'5 5-6 4'5 4"5 3 5 1-3 1 3 7
Mytilus
Date
Dec. 16 Jan. 17 Feb. 17 Mar. i s
Apr. 20
June 23
(whole flesh)
Glycogen
1 6 1 9 2 4 3
7 6 285
Ostrea
Date
Dec. 17 Jan. 14
Feb.13 Mar. 12
Apr- 9 May 14 June 11
July 9
(whole flesh)
Glycogen
34-3I 3203 24-97 23-04 20-50 1956 19-34
"Glycogen-fall" may be due to two main reasons. Firstly, glycogen may be utilised as a fuel and combusted to carbon dioxide and water, or secondly it may be converted to a more complex substance such as a glycoprotein, which acts as food reserve in the ripe eggs or sperm. There is some indication that the latter occurs in Echinus, since there was an increase in the content of carbohydrate other than glycogen from 0-45 to 1-2 per cent, between March 18th and April 2nd, when "glycogen-fall" was most pronounced. The carbohydrate estimates require amplifying, however, before this can be taken as a definite conclusion. Another rather remarkable instance of the utilisation of glycogen by a growing tissue is given by Elmhirst (1920) who observed that the glycogen stored up in the polyps of Clava squamata before dying down in the autumn, was "chiefly in nests where new outgrowths will appear from the old encrusting hydrorhiza" in the following spring.
SUMMARY.
1. The spring inshore migration of Echinus at Port Erin in 1930 started in early February and reached its maximum in the middle of March. Mature gonads were found at the end of February and throughout March and early April. At the end of June all gonads examined were spent. The sea temperature throughout this period was observed. It is probable that May was the chief month in which natural spawning took place.
2. A cycle of changes in the composition of the gonad are recorded from November 1929 to July 1930. The chief of these are:
(a) In the males an increase in percentage dry weight as the gonads mature; the opposite taking place in the females.
(b) A large and simultaneous decrease in percentage glycogen in both male and female gonads prior to spawning followed by a great post-spawning increase. The fatty acid content does not alter with the maturation of the gonad, but an indication is given that an increase in the percentage of carbohydrates other than glycogen occurs. Hence it is suggested that glycogen is transformed in the maturing gonad into carbohydrate food reserves for the ripe eggs and sperm.
REFERENCES.
AMIRTHALINGAM, C. (1928). Journ. Mar. Biol. Assoc. 15, 605. BOYLAND, E. (1928). Biochem.Journ.2Z, 239.
CREIGHTON, H. (1896—9). Microscopic Researches on Glycogen. London. DANIELS, W. J. (1921). Lancashire Sea Fisheries Report, 30, 205.
DELAUNAY, S. (1927). Recherches biochimiques sur I'excretion azotie des Invertibrh. Bordeaux. ELMHIRST, R. (1920). Scottish Marine Biological Association Annual Report.
(1922 a). Scottish Marine Biological Association Annual Report, 27. (1922 b). Nature, 110, 667.
FISHERIES INVESTIGATIONS (1923). Series I I , 6, No. 1.
GRAY, J. (1928). Brit. Journ. Exp. Biol. 5, 345.
HAGEDORN, H. and JENSEN, B. J. (1923). Biochem. Zeit. 135, 46. HARDEN, A. J. and YOUNG, W. J. (1902). Journ. Chem. Soc. 81, 12. HOLDEN, H. F. (1926). Biochem. Journ. 20, 133.
MOORE, B., WHITLEY, E. and ADAMS, A. (1913). Biochem. Journ. 7, 127.
MORTENSEN, T. (1927). Handbook of the Echinoderms of the British Isles. Oxford University Press. NEEDHAM, J. (1927). Brit. Journ. Exp. Biol. 5, 6.
ORTON, J. H. (1920). Journ. Mar. Biol. Assoc. 12, 339. (1929). Journ. Mar. Biol. Assoc. 16, 1.
PFLUGER, A. (1905). Das Glycogen. Bonn.