Identification of Tooth Damage in a Gearbox by
Vibration Signal Analysis
Dhanush D1, Dr. Ajit Prasad S L2
1
M. Tech Scholar, PES College of engineering, Mandya, 2Professor, PES College of Engineering, Mandya.
Abstract: The gearbox is used in power transmission unit for various mechanical systems such as automotive, aerospace and industrial machineries. The performance of these mechanical systems depends upon the health condition of the gearbox. The present work is to study the vibration characteristics of a gearbox to monitor its health condition. The signals are collected from healthy and faulty gears which are operated under different speed and torque conditions. The vibration signals are sensed by an accelerometer which is mounted on gearbox casing. The results discuss the gearbox vibration characteristics using time domain, frequency domain and order track parameters. The variation of vibration characteristics is useful for recognizing the fault in the gearbox.
Keywords: Gearbox, Gear Mesh Frequency (GMF), Gear Natural Frequency (GNF), sidebands.
I. INTRODUCTION
Gearbox is necessary for prime movers to transmit the power from one part to another. Gearbox contains many parts such as gear pairs, bearings, shafts, coupling etc., and each part has its own vibration characteristics due to reasons such as the shaft misalignment because of over load or bent shaft, the coupling looseness because of loosened fasteners, defects in inner race, outer race, rollers and cage of bearings, misalignment due to improper mounting of gear and looseness due to backlash effect. Hence health condition monitoring of gearbox is very essential for ensuring designed performance levels of the mechanical systems. The vibration analysis is employed for condition monitoring of gearbox. Condition monitoring of the gearbox is effective, if the gear failure is detected early to prevent severe damage of the gearbox [1]. There are many types of defects in the gear such as tooth breakage, pitting, scoring, tooth wear etc.
Teeth defect is one of the major faults in gearbox which can be identified using vibration signals [2]. Vibration processing techniques should be effective for detection of gear faults [3]. The condition of gear operating under fluctuating loads can also be monitored through vibration signals [4].
Typically the vibration analysis is carried out using techniques such as time domain analysis, frequency (spectral) domain analysis, order tracking analysis, time frequency analysis, time synchronous averaging, wavelet analysis, model based analysis etc. [5]. Fast Fourier Transformation (FFT) converts time domain signals into frequency domain signals and order analysis converts time domain signals into angular domain signals.
The major difference between the spectra and order analysis are while frequency does not vary with time in the spectrum signal, the frequency may vary with time in case of order analysis [6]. The disturbances occurring in the system causes demodulation of vibration signals. Any amplitude variation in time domain is called as amplitude demodulation and in same way any frequency variation in frequency domain is called as frequency demodulation. In damaged gear condition the spectral signal contains frequency demodulation which causes sidebands around gear mashing frequency and these sidebands give sufficient information about the damaged gear [7].
Gear teeth in a power transmitting gearbox are subjected to fatigue loading. Minute defect in the gear material like micro voids or machining marks at the roots of the gear teeth can lead to creation of micro cracks, when subjected to fatigue loading. With continuous loading, these micro cracks can coalesce and form a macro crack, which can grow with further loading causing tooth breakage. Once a tooth breaks in a gear train, it can lead to higher impact force causing breaking of more number of teeth, leading to catastrophic failure of the system.
II. METHODOLOGY
Fig 1: Schematic representation of gearbox test rig.
[image:2.612.172.443.411.560.2]Back to back or power recirculating type of gear test rig has been used to carry out the vibration analysis of gearbox in the present work. Fig 1 shows the schematic representation of gearbox test rig. The test rig consists of two spur gear pairs one serves as test gear pair and the other as master or slave gear pair. Both the gear pairs have the teeth ratio of 45/28. The load is applied on pinion through the load coupling assembly using the loading arm. The test rig has provision for easy assembly and disassembly of test gear pairs. Specifications of gear pairs used in present work are shown in table 1
TABLE 1
Specifications of gear pair
SL.NO. Parameter Gear Pinion
1 Material Mild Steel Alloy 20MnCr5 2 Number of Teeth 45 28
3 Module (mm) 2.5
4 Pressure Angle (deg) 20 5 Face Width (mm) 25
6 Pitch Circle Diameter
(mm) 112.5 70.0
7 Center distance (mm) 91.25
Operating parameters selected in the present study, are shown in table 2 and gear designations in table 3.
TABLE 2 Operating parameters
SL. NO.
Operating
parameters Value
1 Loads (N-m) 0, 07.85, 19.62 and 39.24
[image:2.612.192.421.610.695.2]TABLE 3 Gear designation
Three different faulty gears are shown in fig 2.
a) F1 b) F2 c) F3
Fig 2: Different types of faulty gears.
Frequency response function (FRF) analysis is carried out to estimate modal parameters of the gearbox by conducting impact hammer test. Vibration measurement is carried out by using uniaxial accelerometer which is placed in vertical (radial) direction near the bearing housing of the gearbox. Raw vibration signals collected in the time domain are converted into frequency domain by carrying out Fast Fourier Transformation (FFT) of collected signals. The vibration characteristics obtained from time domain and frequency domain signals and order tracking analysis are used for assessing the condition of the gears.
III. RESULTS AND DISCUSSION
[image:3.612.82.526.72.382.2]A. Frequency response function (FRF)
Fig 3: FRF signal of the gearbox.
Fig 3 shows FRF signal obtained from impact hammer test of the gearbox. From the FRF analysis, first three Gearbox Natural Frequencies obtained are 100Hz, 185HZ and 408Hz.
Healthy gear H
Gear with one broken
tooth F1
Gear with two broken
teeth F2
Gear with four broken
[image:3.612.77.533.484.690.2]B. Time domain analysis
The time domain signals of gearbox for healthy and faulty gears are shown in fig 4, for speed of 192rpm and torque of 07.85N-m.
a) H b) F1
[image:4.612.86.531.94.427.2]c) F2 d) F3
Fig 4: The time domain signal of gearbox for healthy and faulty gears.
Comparison of RMS level for different operating conditions of healthy and faulty gears are shown in fig 5. There is no significant difference in RMS levels of healthy and faulty gears. But the RMS values of the signals are observed to increase significantly with increase in both load and speed.
Fig 5: Comparison of RMS level for different operating condition of healthy and faulty gears.
For a speed of 192rpm, the operating frequency is 3.2Hz and time period is 0.3125sec. The zoomed time domain signals of gearbox for healthy and faulty gears are as shown are fig 6.
0.00 2.00 4.00 6.00 8.00 10.00
0 7.85 19.62 39.24
A C C ELA R A TI O N i n m /s ^ 2
TORQUE in N-m SPEED=800rpm H F1 F2 F3 0.00 2.00 4.00 6.00 8.00 10.00
200 400 600 800
A C C ELA R A TI O N i n m /s ^ 2
SPEED in rpm TORQUE=39.24N-m
H
F1
F2
[image:4.612.81.529.490.683.2]a) H b) F1
[image:5.612.82.525.73.325.2]c) F2 d) F3
Fig 6: The zoomed time domain signals of gearbox for healthy and faulty gears.
In the fig 6a there is no sudden rise in amplitude or pulse in the signal that indicates no fault or healthy condition of gear. Fig 6b shows one pulse for a revolution of shaft which indicates one broken tooth in the gear train. Also two and four pulses created for every revolution of shaft as seen in fig 6c and 6d indicates the presence of two and four broken teeth in the gear pair respectively.
C. Frequency domain analysis
Frequency domain signals obtained after carrying out FFT of time domain signals are shown in fig 7 (a-d) for gearbox with healthy and faulty gears.
a) H b) F1
c) F2 d) F3
[image:5.612.83.527.437.714.2]For the gear speed of 400rpm, gear shaft and pinion shaft frequencies are 6.67Hz and 10.72Hz respectively and the corresponding Gar Mesh Frequency (GMF) is 300Hz. Dominant peaks can be observed at GMF which are increasing with the number of broken teeth. The vibration level of healthy gear in fig 7a is low when compared to other faulty gear conditions shown in fig 7 (b-d).
Fig 8 shows the zoomed spectra around GMF for H and F1 condition.
a) H b) F1
Fig 8: Zoomed spectra of healthy and faulty gears around GMF.
It can be observed that sidebands with significant strength appear in case of defective gear when compared to that in healthy gear. Also the sidebands are found to exist at frequencies which are harmonics of gear shaft frequency.
[image:6.612.84.531.423.589.2]And also in fig 7b some predominant peaks observed around 130Hz and 190Hz. The zoomed spectra around this frequency are shown in fig 9.
Fig 9: Zoomed spectra of faulty gear F1 around 131Hz and 190Hz.
These peaks are caused by the harmonics of gear and pinion shaft frequencies, which are close to the GNF of 100Hz and 185Hz.
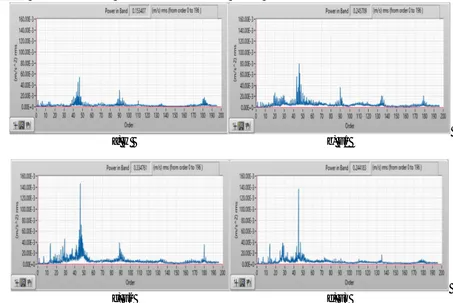
D. Order tracking or Angular domain analysis
a)H b) F1
[image:7.612.76.529.75.378.2]c) F2 d) F3
Fig 10: Order signal for healthy and faulty gears at the speed of 400rpm and torque T1 07.85N-m.
Comparison of sidebands around the 1st GMF for healthy H and fault F1 is shown in fig 11.
Fig 11: Comparison of sidebands around the 1st GMF for healthy H and fault F1 gearbox.
IV. CONCLUSIONS
Following conclusions are drawn from the vibration characteristics of gearbox, obtained from the study.
A. Time signal analysis gives number of pulses for every revolution of shaft which depends on the number of broken teeth in the gear. This is clear indication of presence of broken teeth in the gearbox.
B. The RMS levels of the signals increase with increase in load and speed conditions, but do not differ significantly between healthy and faulty gears.
C. FFT signals show dominant peaks at gear mesh frequencies, whose magnitude are found to increase with the number of broken teeth.
D. The faulty gear spectrum as well as order signals show higher amplitude of sidebands around gear mesh frequency, which are harmonics of gear shaft frequency.
E. Significant peaks are observed around gear natural frequencies as well as sidebands which are caused by the harmonics of gear and pinion shaft frequencies.
0.00E+00 5.00E-02 1.00E-01
40 41 42 43 44 45 46 47 48 49 50
A
c
c
e
la
r
a
ti
o
n
(R
M
S
)
in
m
/s
^
2
Order (Gear Ravolution
)
Order Signal
[image:7.612.154.451.411.540.2]V. ACKNOWLEDGEMENT
PG center in machine design, Department of mechanical engineering P.E.S.C.E, Mandya. First I would like to thank my Guide Dr. Ajit Prasad S.L. and also our beloved HOD Dr.H.P Raju who gave me the opportunity to do the project on the topic, Identification of tooth damage in a gearbox by vibration signal analysis.
REFERENCES
[1] Wang, W., and McFadden, P- Early Detection of Gear Failure by Vibration Analysis .I. Calculation of the time-frequency distribution, Mechanical System and Signal Processing, 7(3), 193-203, 1993.
[2] Fakhfakh, T., Chaari, F., and Haddar, M.- Numerical and experimental analysis of a gear system with teeth defects. Int. J Adv Manuf. Technol., 25:542-550. 2005.
[3] Dalpiaz, G.; Rivola, A.; Rubini, R.: Effectiveness and sensitivity of vibration processing techniques for local fault detection in gears. Mechanical System and Signal Processing, 14, 3, pp. 387-412, 2000.
[4] Stander, C. J., Heyns, P. S. and Schoombie, W. - Using Vibration Monitoring for Local Fault Detection on Gears Operating Under Fluctuating Load Conditions, Mechanical Systems and Signal Processing, Vol. 16, No. 6, pp. 1005-1024, 2002.
[5] Fyfe K. R., Munck E. D. S., Analysis of computed order tracking. Mechanical Systems and Signal Processing, 11, (2):187-205, 1997.
[6] Tian H., Luan J., Application of order tracking analysis in gear wearing fault diagnosis, Journal of Ordnance Engineering College,.10, 17(5):57-60, 2005. [7] Blankenship G. W. and Singh R., "Analytical Solution for Modulation Sidebands Associated with a Class of Mechanical Oscillaotrs," Journal of Sound and