Visualization Through Knowledge
Representation Model for Social Networks
D. M. Akbar Hussain, Muhammad Athar Javed and Zaki Ahmed
∗Abstract–Knowledge management is a systematic and organizationally specified process and knowledge management system is all those technological com-ponents; software, hardware, people and processes supporting knowledge management initiative. These initiatives includes work flow maps, web sites, por-tals, document/team management system, data ware-houses, data mining processes, databases, contact lists, virtual teams, collaboration tools, customer re-lationship management, applications and news (Dav-enport and Prusak 1998, Jashapara 2004) [1, 2]. Knowledge is not important per se [3] (Agostini et al 2003) instead the process of knowing, learning and creating knowledge is the relevant aspect [4] (Non-aka and Takeuchi 1995). In this paper knowledge representation is presented in 3D style for the under-standing and visualization of dynamics of complex so-cial networks by developing a TANetworkTool (Task Analysis Network Tool). The standard or normal rep-resentation of a typical social network is through a graph data structure in 2D. The dynamics of larger social networks is so complex some time it becomes difficult to understand the various levels of interac-tions and dependencies just by mere representation through a tree or graph. Although, many analyti-cal methods provide relationship dependencies, role of different nodes and their importance in the net-work. In this paper we are presenting a visualization of networks by rotating the network through vari-ous dimensions to provide a more realistic view to understand the dynamics of complex social networks and complimenting the analytical results. This rep-resentation can also help authorities not necessarily having specific scientific background to understand and perhaps take preventive actions required in cer-tain specific scenarios for example dealing with ter-rorist/covert networks.
Keywords: Social Networks Analysis (SNA), Terror-ism, Models, Intellective Simulation Model.
∗Manuscript submitted January, 2011 Dr. M. Akbar Hussain
is member of IEEE, IDA, IAENG and works at the Department of Electronic Systems Aalborg University, Niels Bohrs Vej 8, 6700 Esbjerg, Denmark. Email: [email protected]. Dr. Zaki Ahmed is working as a chief Scientist at PILO (Pakistan Institute of Laser and Optics). Email: [email protected]. Muhammad Athar Javed, Expert on South Asian Affairs, Copenhagen, Denmark. Email: ma−javed@hotmail.com.
1
Introduction
To have an insight visualization of any network, typical focus is on the characteristics of the network structure. Social Network Analysis is a mathematical method for ’connecting the dots’. SNA allows us to map and measure complex, and sometimes covert, human groups and orga-nizations [5]. Given any network where the nodes/agents are individuals, groups, organizations etc., a number of network measures such as centrality or cut-points are used to locate critical/important nodes/agents. Many traditional social network measures and the information processing network measures can help in revealing impor-tance and vulnerabilities of the nodes/agents in the net-work. Networks visualization is semantically presented in the form of a graph in which the nodes represent entities and the arcs represent relationship among nodes.
In this paper we are presenting a framework for visual-izing the network. The reference point could be any of the well known centrality measures in the context of so-cial network analysis, for example Degree, Betweenness or Closeness. Once the important nodes based on these measures are determined our developed novel technique, adjust and rotate the network in 3D for a better visu-alization view. The nodes distinctiveness classification is a challenging task. Typically, social network analysis identifies the following characteristics:
• Important individual, event, place or group.
• Dependency of individual nodes.
• Leader-Follower identification.
• Bonding between nodes.
• Vulnerabilities identification.
• Key players in the network.
• Potential threat from the network.
• Efficiency of overall network
• An individual or group that if given new information can propagate it rapidly.
• An individual or group that has relatively more power and can be a possible source of trouble, po-tential dissidents, or popo-tential innovators.
• An individual or group where movement to a com-peting group or organization would ensure that the competing unit would learn all the core or critical information in the original group or organization (in-evitable disclosure).
• An individual, group, or resource that provides re-dundancy in the network.
Many traditional social network measures and the infor-mation processing network measures can help in reveal-ing importance and vulnerabilities of the nodes/agents in the network [7, 8, 9, 10]. Application of existing tools on these complex socio-technical networks/systems is very demanding to winkle out the required information. Most of the measures and tools work best when the data is complete; i.e., when the information is inclusive about the interaction among the nodes. However, the difficulty is that covert and terrorist networks are typically dis-tributed across many boundaries for example from cities or countries and data about them is never complete-correct at a certain instant of time. Normally, a sampled snapshot data is available some of the links may be in-tentionally hidden. Also data is collected from multiple sources for example news (print/tv), open source Inter-net data, security agencies, etc., and at different time in-stants. In addition inclusive and correct information may be prohibitive because of secrecy. Obviously, there could be other difficulties but even these provide little guid-ance for what to expect when analyzing these complex socio-technical systems with the developed tools. The next section provides a survey of the standard centrality measures used in the social network analysis. These mea-sures are important as they have been used as a reference point for visualization of the network. In this investiga-tion we have considered many examples to demonstrate the impact of having this multi-dimensional visualization for knowledge representation to understand networks dy-namics using our TANetworkTool.
2
Network Analysis Measures
Social networks provides mapping and the social network analysis measure relationships and movement between people, groups, events, organizations or other informa-tion/knowledge processing entities. People, organization and groups are represented as nodes in the network while the links show relationships or movement between the nodes. SNA provides both visual and mathematical anal-ysis of human relationships. This methodology could also
be used by the management to perform Organizational Network Analysis [5].
2.1
Centrality (Degree)
To comprehend networks and their participants, we eval-uate the location of participants in the network. Degree provides the relative importance and the location of a particular node in the network. Degree and similar mea-sures indicate the various roles of the nodes in a network, for example leaders, gatekeepers, role models etc. A node is central if it is strategically located on the communica-tion route joining pairs of other nodes [7, 8]. Being cen-tral it can influence other nodes in the network, in other words potentially it can control the flow of information. The potential of control makes the centrality conceptual model for these nodes.
The idea of centrality is not new it was first applied to human communication by Baveles in 1948 [7, 11]. In this study relationship between structural centrality and influence in group processes were hypothesized. Fol-lowing Baveles it was concluded that centrality is re-lated to group efficiency in problem-solving, perception of leadership and the personal satisfaction of partici-pants [12, 13, 14]. In the fifties and sixties more research was conducted on these measures and it was concluded that centrality is relevant to the way groups get orga-nized to solve problems. The following references pro-vide a very deep and pioneering work on these measures [15, 16, 17, 18, 19, 20, 21, 22, 23, 24, 25, 26].
Figure 1: Network Example
1 through node 3 and 5 is a geodesic as the other path for the same pair is also reachable through node 3, 4, 6 and 5 but has longer distance.
Nieminen has provided a very systematic elaboration of the concept of degree [32]. Scott has extended the concept based on degree beyond immediate (first) neighbors by selecting the number of points an individual can reach at a distance two or three [9]. Similarly, Freeman produced a global measure based on the concept of closeness in terms of the distances among the various points [30]. The simplest notion of closeness is obtained from the sum of the geodesic distances from an individual to all the other points in the graph [33].
2.2
Betweenness
Betweenness measures to what extent a node can play the role of intermediary in the interaction between the other nodes. The most popular and simple betweenness measure based on geodesic path is proposed by Freeman and Anthonisse [30, 31]. In many real scenarios how-ever, communication does not travel exclusively through geodesic paths. For such situations two more between-ness measures are developed first based on all possible paths between couple of nodes [34] and second based on random paths [10].
2.3
Closeness
Another more sophisticated centrality measure closeness based on geodesic distance can be defined, which is the mean geodesic (i.e., shortest path) distance between a node and all other nodes reachable from it. Closeness can be regarded as a measure of how long it will take information to spread from a given node to other nodes in the network.
3
Simulation Test
Although, we conducted tests for a number of networks ranging from 10 - 150 nodes however, we are only pre-senting results and observations from three networks with twenty, thirty and sixty nodes respectively. The connec-tivity density is also differently selected for these net-works. Density means the numbers of edges a node can posses in other words the maximum degree of a node. It is selectable through a defined window range, set by the system designer (normally it has a default value of 6).
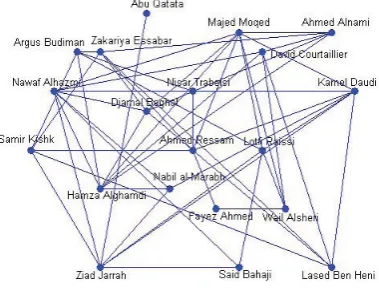
[image:3.595.325.515.400.544.2]For the first two scenario networks density (degree) is in the range of 4 - 8 maximum and for the third net-work it is a bit higher. In the first two netnet-works it is kept normal or low to show our information processing sequence for knowledge representation. Figure 2 shows a network with 20 nodes. The network data is gener-ated by the data genergener-ated software engine DataGA, at present we have a small database with names and nation-alities mostly known so far from open sources database like trackingthethreat.com etc. The DataGA takes the name and create links/edges (connectivity) with other nodes randomly, however the names are not shown on the transitional phases to avoid unnecessary text and lines mix up. The DataGA engine selects the positions of each node and the edges between them randomly from a normal distribution. After that the network visualiza-tion tool TANetworkTool determines the three central-ity measures namely, degree, betweenness and closeness. These measures are necessary because the TANetwork-Tool needs one of these measures as a reference tool to place nodes at their appropriate locations to make visu-alization of the network more meaningful. For this net-work (figure 1)we are using degree as a reference measure. When degree is the reference measure the system tries to place nodes with higher degree at the periphery of the network and subsequently the remaining nodes inside of it. Obviously, during this process the network may go through rotation and skewing.
Figure 2: Network of 20 Nodes
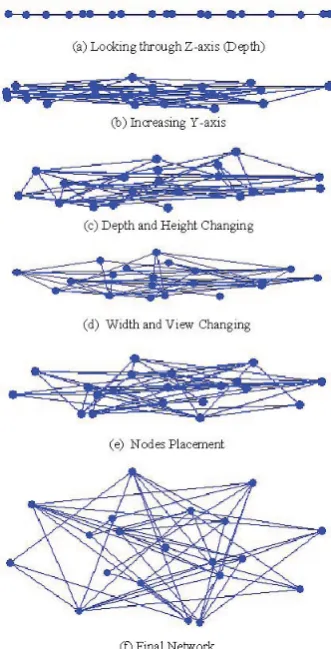
The different selected phases for the network of figure 2 are shown in figure 3 (a - f). One can see that although this particular network was not a complex one to visual-ize even in its original form (figure 2) but still the final representation is visually more structured.
Figure 3: Selected Phases
[image:4.595.344.497.49.149.2]multiple nodes. Therefore, to avoid system saturation in some cases it does not move the positions of those nodes.
[image:4.595.339.499.298.422.2]Figure 4: Network of 30 Nodes
Figure 5 shows the final phase, the intermediate phases are not shown here to avoid repetition as the idea is sim-ilar to figure 3. However, we can eventually see better visualization and also nodes closer to each other can be seen more clearly.
Finally we present a network of 60 nodes as shown in figure 6 with a relatively high density and one can see how complex the network looks. For this network we are using betweenness as a reference measure. The system tries to place nodes of higher betweenness in the inner periphery. As for this network, connectivity is a kind of worst case scenario, normally for a functional and viable
Figure 5: Final Phase of the Network
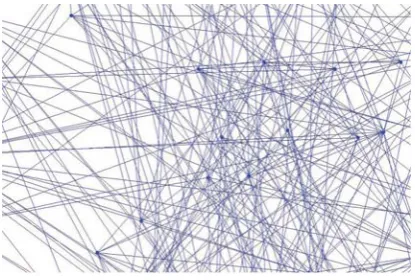
[image:4.595.93.226.463.544.2]social network the average connectivity is 6 degree for a node. But the idea here is to show that our representa-tion of the available informarepresenta-tion produce better results. The final phase after intermediate transitions is shown in figure 7. In addition to this processing the system can also blow up (Zoom) a particular area of the network to see the details more clearly. One such blow up of an area selected through a rectangle is shown in figure 8.
Figure 6: Network of 60 Nodes
Figure 7: Final Phase of the Network
4
Conclusion
[image:4.595.335.502.465.593.2]Figure 8: Blow-up of Selected Area is also Possible
of representation is very important and useful for those making critical decisions regarding destruction of terror-ist/covert networks. Through simulations we have shown a better visualization of nodes connectivity. Although, our method is simple but it gives a more controlled ap-proach to see the network from various dimensions and the system is quite flexible and interactive. However, we have found that when the connectivity density is very high, the visualization deteriorates and the only option left is to use the blow-up version of the algorithm.
References
[1] Davenport T and Prusak L.:. Working knowledge: Managing what your organization knows, harvard business school press, boston, ma, 1998.
[2] Ashok Jashapara:. Knowledge management - an integrated approach, prentice hall, 2004, isbn-0273682989.
[3] R. Boselli G. De Michelis F. De Paoli R. Dondi: Agostini, S. Albolino. Stimulating knowledge dis-covery and sharing, proceedings of the 2003 interna-tional acm siggroup conference on supporting group work, sanibel island, florida, usa, pages: 248 257, 2003 isbn: 1-58113-693-5.
[4] Nonaka I. and Takeuchi H.:. The knowledge creating company, oxford university press, oxford 1995.
[5] Valdis Krebs:. Connecting the dots, tracking two identified terrorists, 2002.
[6] Kathleen M. Carley Ju-Sung Lee David Krackhardt:. Destabilizing networks, dept. of social and decision sciences, carnegie mellon university, pittsburgh, pa 15143, november 2001.
[7] Bavelas A:. A mathematical model for group struc-tures”. human organization 7: Pages 16 - 30, 1948.
[8] Shaw M. E:. Group structure and the behaviour of individuals in small groups, journal of psychology, vol. 38, pages 139 - 149, 1954.
[9] Scott J:. Social networks analysis. 2nd edition, sage publications, london, 2003.
[10] Newman M. E. J:. A measure of betweenness cen-trality based on random walks, cond-mat/0309045, 2003.
[11] Bavelas A:. Communication patterns in task ori-ented groups”. journal of the acoustical society of america vol. 22, pages 271 - 282, 1950.
[12] Leavitt Harold J:. Some effects of communication patterns on group performance. journal of abnormal and social psychology vol. 46, pages 38 - 50, 1951.
[13] Smith Sidney L:. Communication pattern and the adaptability of task-oriented groups: an experimen-tal study. cambridge, ma: Group networks lab-oratory, research laboratory of electronics, mas-sachusetts institute of technology, 1950.
[14] Bavelas A. and D. Barrett:. An experimental ap-proach to organizational communication. personnel vol. 27, pages 366 - 371, 1951.
[15] Mulder M.:. Groepsstructuur en gedrag. nederlands tgdschrift voor de psychotogie i i: Pages 85 133, 1956.
[16] Mulder M.:. Groepsstnrctuur, motivatie en prestatie. den haag: C.o.p, 1958.
[17] Glanzer M. and R. Glaser:. Techniques for the study of team structure and behaviour. part ii: Empirical studies of the effects of structure. technical report, pittsburgh, american institute, 1957.
[18] Glanzer M. and R. Glaser:. Techniques for the study of group structure and behaviour. part ii: Empirical studies of the effects of structure in small groups. psychological bulletin 58, pages l - 27, 1961.
[19] Cohen A. M:. Communication networks in research and training. personnel administration 27, pages 18 - 24, 1964.
[20] Shaw M. E:. Communication networks”, in l. berkowitz (ed.), advances in experimental social psy-chology, vol. vi, pages 111 - 147, new york, academic press, 1964.
[21] Stephenson K. A. and Zelen M:. Rethinking cen-trality: Methods and examples, social networks 11, pages 1 - 37, 1989.
[22] Flament C:. Applications of graph theory to group structure. englewood cliffs, nj, prentice hall, 1963.
[24] Snadowski A:. Communication network research: an examination of controversies”. human relations 25, pages 283 - 306, 1972.
[25] Rogers D. L:. Socio-metric analysis of inter-organizational relations: application of theory and measurement. rural socioeonv 39, pages 487 - 503, 1974.
[26] Rogers E. M. and R. Agarwala Rogers:. Communi-cation networks in organizations. communiCommuni-cation in organizations, pages 108 - 148, 1976, new york, free press.
[27] Cohn B. S. and M. Marriott:. Networks and centres of integration in indian civilization. journal of social research i, pages 1 - 9, 1958.
[28] Pitts F. R:. A graph theoretic approach to historical geography, the professional geographer 17, pages 15 - 20, 1965.
[29] Latora V. and Marchiori M:. A measure of centrality based on network efficiency, arxiv.org preprint cond-mat/0402050, 2004.
[30] Freeman Linton C:. Centrality in social networks: Conceptual clarification, social networks 1, page 215 - 239, 1979.
[31] Anthonisse J. M:. The rush in a graph, university of amsterdam mathematical centre, amsterdam, 1971.
[32] Nieminen J:. On centrality in a graph. scandinavian journal of psychology 15, pages 322 - 336, 1974.
[33] Sabidussi G:. The centrality index of a graph. psy-chometrika 31, pages 581 - 603, 1966.