Intelligent Information Management, 2011, 3, 105-111
doi:10.4236/iim.2011.34012 Published Online July 2011 (http://www.SciRP.org/journal/iim)
Evaluation of Intersection Performance under Atc System
in Wuhan
Huan Ge 1, Zhiyun Zou2, Zhihao Zhou1 1
Jiaxing Planning & Design Research Institute, Jiaxing, China
2
Huazhong University of Science and Technology, Wuhan, China E-mail:[email protected], [email protected]
Received May 3, 2010; revised June 24, 2011; accepted July 1, 2011
Abstract
In order to accurately evaluate the implementation of Area Traffic Control (ATC) system, two situations were compared in this paper, i.e., comparison of intersection performance under two different operation con-ditions before and after the application of ATC system. Based on floating car theorem, this paper investi-gated the average intersection delay and the average vehicle stop times. During the traffic investigation, Ar-cGIS, GPS, VC++ and other technologies have been applied. In addition, the evaluation indices of intersec-tion performance average intersecintersec-tion delay and average vehicle stop times (Guiyan Jiang et al. 2006) were selected and compared. The results showed that both average intersection delay and average vehicle stop times have been reduced after the implementation of ATC system. Improvement of traffic condition is more obvious under cooperative control status. This paper provided a reference for testing the performance of in-tersections under ATC system.
Keywords:ATC System, Intersection Performance, Performance Evaluation, Intersection Delay, Vehicle Stop Times
1. Introduction
Wuhan Municipality has initiated the implementation of the Area Traffic Control (ATC) system since the end of March, 2009, which includes 426 intersections in Han-yang district, Wuchang district, Hongshan district, Ting-shan district and East Lake High-tech district. The sys-tem is designed to improve traffic conditions, such as reduce intersection delay, increase travel speed and alle-viate traffic congestion. The ATC system adopted Split Cycle Offset Optimization Technique (SCOOT) system in the area of network with heavy traffic flow while adopted Vehicle Active (VA) control in the intersections which has lighter traffic flow compared with adjacent intersections. SCOOT optimizes traffic flows by mini-mizing a Performance Index (PI) and the measure of amount of average queue lengths and vehicle stop times at all approaches in the network. Under VA control, fic signals switch of VA control is controlled by the traf-fic condition at this intersection. In order to test and evaluate the implementation effect of ATC system and intersection performance, we investigated different traf-fic conditions under two operation conditions of this
sys-tem (Cooperative control status & Single point control status).
1.1. The Investigation Traffic Network in Wuhan
Urban ATC system in Wuhan studied here was in the year of 2009. Hankou district which has been monitored by the ATC system and the other five districts were new- ly constructed. Because of the wide spatial coverage of the system, a fraction of the coverage including a total of 22 arterials and 179 intersections arterials was investi-gated and tested.
1.2. Evaluation of Intersection Performance
ed as evaluation indices. The delay is frequently utilized as the evaluation index abroad. For example, perform-ance modeling and evaluation method of traffic control network were proposed by Jiacun Wang et al. [5] based
on Stochastic Timed Petri Nets (STPN). Analysis model was established in his paper for individual intersection and section separately, and queue length and delay were adopted as the evaluation indices of intersection. Brian Wolshon and William C. Taylor [6] pointed out that the use of travel time and vehicle stop times is valuable in assessing certain aspects of system performance in inter-section delay study. Guoqiang Zhang et al. [7] analyzed
the performance of a yield controlled highway intersec-tion with average delay. Evaluaintersec-tion indices in this paper are also selected from the delay and vehicle stop times.
The intersection delay occurs because the vehicle de-celerates, to stop, waits in queue, starts up when green light and leaves the intersection [8]. Total delay is de-fined as the difference between the travel time of a vehi-cle unaffected by a controlled intersection and a vehivehi-cle affected by a controlled intersection. This delay, which is called total delay, includes lost time due to deceleration and acceleration, as well as stopped delay.
Stop before entering intersection is a common phe-nomenon; we define “stop” while the vehicle speed closes to zero [9]. In addition, vehicle stop times is an important and fundamental parameter to analyze and evaluate the traffic operation status. It is inevitable to decelerate before stop and accelerate after stop, while the vehicle stop times might affect the vehicle delay directly.
As a conclusion, average intersection delay and aver-age vehicle stop times as the evaluation indices are used to evaluate the performance of Wuhan ATC system.
2. Objectives
ATC system has a relatively wide range of applications in many cities [10]. Prior studies have demonstrated that adaptive systems like SCATS and SCOOT can reduce route travel time and intersection delay compared to conventional fixed timing control systems. Luk et al. [11]
and Moore et al. [12] reported that the use of SCATS can
reduce travel time and the amount of vehicle stop for red lights. However, these research literatures did not de-scribe the specific ways to attain the effect of flow im-provements and did not put forward specific methods or evaluation index set either for evaluating the traffic con-trol performance, or actual operation.
Most of these systematic application evaluation stud-ies are conducted on the basis of the investigation using the floating car technique. But these studies did not in-clude direct measurements of intersection delay as sepa-rate statistics. Measurements of intersection delay can
reveal details of signal operation. Therefore, intersection delay analytical method is also suitable for determining and analyzing the traffic operation effect under ATC sys-tem with cooperative control status.
This paper introduced an investigation of vehicle op-eration and evaluation based on the evaluation indices. The objective of Wuhan ATC system evaluation project is to analyze the intersection performance with two evaluation indices (intersection delay and vehicle stop times). It reflects whether the traffic conditions under cooperative control status improved or not. At the same time, it can verify the rationality of this investigation program.
3. Evaluation Indices
3.1. Average Intersection Delay
Intersection delay is defined as the time lost due to traffic management and signal control at an intersection, de-noted by ds. Usually it includes three parts: control de-lay, entrance delay and stop delay. It reflects not only the operating conditions but also the level of service of the intersection. Intersection delay is one of the main pa-rameters that measure the blocked degree of the vehicle passing through the signal control intersection.
Average intersection delay is defined as: The average of the delay caused by all the vehicles passing through the intersection.
1
N si i s
d d
N
(1)where, N is denoted as the number of vehicles through
the intersection.
3.2. Average Vehicle Stop Times
The vehicle stop times is defined as the number of vehi-cle stops due to signal control when passing through the intersection, denoted by n. As we all know, when vehicle
started/stoped, its fuel consumptions and exhaust emis-sions are apparently higher than normal driving status. So, decrease of the number of intersection stops may benefit energy efficiency, such as lowing fuel consump-tion, reducing exhaust polluconsump-tion, and improving riding comfort etc. Average vehicle stop times is also one of the main parameters that measures the blocked degree of the vehicle passing through the signal control intersection.
The average vehicle stop times is defined as: the av-erage of the stop number that caused by all the vehicles passing through the intersection.
1
N i i
n n
N
H. GE ET AL. 107
where, ni is denoted as the number of stops that vehicle i
passing through the intersection, ni ≥ 0.
3.3. Average Intersection Delay Per Stop
Suppose that average intersection delay ds and average
vehicle stop times n, average vehicle stop times quo-tients in average intersection delay is defined as average intersection delay per stop d : The average intersection delay a vehicle happens per stop during the process of passing through the intersection. Units: s/stops. Then,
1 1
1 1
/
N N
si si
i i
s N N
i i
i i
d d
N d d n
N
n n
(3)4. Methodology
There are many analysis methods to calculate intersec-tion delay [13] and acquire average vehicle stop times. Intersection delay investigation includes individual sam-ple survey method and samsam-ple tracing method; while we can acquire vehicle stop times through manual counting, camera [14] and so on. Vehicle stop times acquired in this paper is based on the judgment of GPS record data.
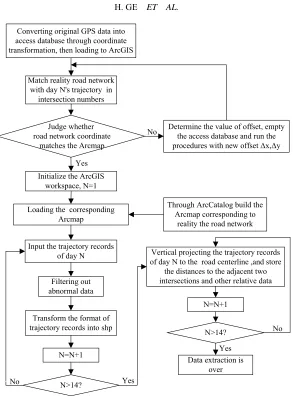
The acquiring of intersection delay in this paper is based on GPS vehicle location information [15]. The original delay data is composed of a series of records recorded by GPS device. The GPS device records one instantaneous speed and space-time position of the vehi-cle every 3 s. When we want to get the value of intersec-tion delay, we must: First, pre-treat the record data of every investigated section according to the flowchart shown in Figure 1 From this way, we get the expected basic data, such as the distance of two adjacent intersec-tions, the numbers of the two intersecintersec-tions, etc. Then judge the direction of one travel by the arisen sequence of the space-time positions, thus record the numbers of the section and the passed through intersection of the record point. At last, match the value of delay recorded by GPS device to corresponding intersections.
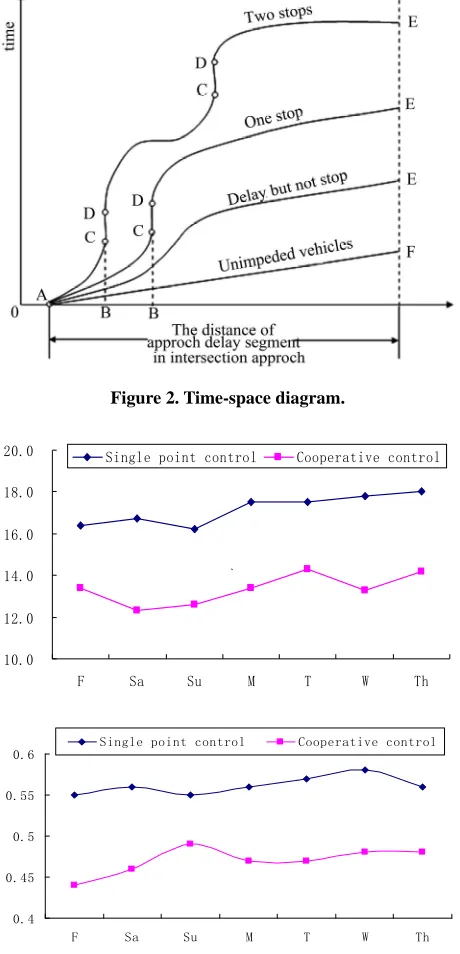
The principle of judging the vehicle stop times is based on the time-space diagram. In Figure 2 points A is start point, point E and F are end points, and the abscissa represents intersections. AE is curve that vehicles travel with delay, while AF is curve without delay. The dis-tance of the intersection does not change along with the time within the straight-line CD. The speed is zero at that moment, that is, in a parking state. Once the straight- line CD appears one time in the travel curve, one stop hap-pens, and so on.
The method adopted here that acquires the data of in-
tersection delay and vehicle stop times are both based on the advanced electronic devices and technologies. GPS devices can accurately record and store great amount of data with high efficiency, while traditional method totally depends on manual recording. With GPS devices we can get the data much easier and can save time that used for statistics and arrangement. In addition, traditional method may be reflected by lots of factors, such as: weather, co-operator tacit agreements, investigation period selection etc. Compared with traditional method, this improvement is a rare step with much less manual workload and money consumption.
5. Intersection Evaluation Under ATC System
in Wuhan
Floating vehicle survey was employed to evaluate the intersection performance under ATC system in Wuhan. Vehicle operation data (mainly include vehicle travel time, intersection delay, vehicle stop times and others) with 22 sections during two weeks daily from 7 am to 7 pm were collected. Among them, first week from April 17th to 23th was working under cooperative control status,
while second week from April 24th to 30th was working
under single point status.
After preliminary analysis of the survey data, we found that data from two sections (Mingzhu Road and East-Lake Road) were abnormal with inconsistent fluc-tuations in a long time. For purpose of fairly evaluation and test, we removed the data from other sections. Fi-nally we evaluated 20 arterials which acrossed 179 in-tersections.
5.1. Results
This investigation divides the time into 5 intervals: 7:00- 9:00 is the morning peak period; 9:00-11:30 is the morn-ing non-congested period; 11:30-15:00 is the midday low-peak period; 15:00-16:30 is the afternoon nonconge- sted period; 16:30-18:30 is the evening peak period.
After processing and analyzing the data, we acquired the comparative values before and after the implementa-tion of ATC system, the week’s trend charts of average intersection delay and vehicle stop times under different controls are shown in table 1 and Figure 3 separately. The values of average delay per stop under different con-trols which according to formulate (3) are shown in Ta-ble.2.
Comparison of evaluation indices before and after im-plementation.
Trend charts of average delay and stops
Yes
Yes Yes
Match reality road network with day N's trajectory in
intersection numbers
Judge whether road network coordinate
matches the Arcmap
Initialize the ArcGIS workspace, N=1
No
Input the trajectory records of day N
Filtering out abnormal data
Transform the format of trajectory records into shp
N=N+1
N>14?
Through ArcCatalog build the Arcmap corresponding to
reality the road network
Determine the value of offset, empty the access database and run the procedures with new offset Δx,Δy Converting original GPS data into
access database through coordinate transformation, then loading to ArcGIS
Loading the corresponding Arcmap
No
Vertical projecting the trajectory records of day N to the road centerline ,and store
the distances to the adjacent two intersections and other relative data
N=N+1
N>14?
Data extraction is over
[image:4.595.151.444.55.451.2]No
[image:4.595.97.502.500.552.2]Figure 1. The flow of effective data extraction.
Table 1. Two comparative indices before and after.
Investigation phase Average vehicle stop times (stop) Average intersection delay(s)
before 0.56 17.2
after 0.47 13.4
Improvement ratio(%) 19.23 28.35
Table 2. Average delay per stop under different ACT systems.
Date Fri Sat Sun Mon Tue Wen Thr
Cooperative control 30.455 26.739 25.714 28.511 30.426 27.708 29.583
Average delay per stop
(s/stops) Single point control 29.818 29.821 29.455 31.250 30.702 30.690 32.143
5.2. Comparison of Average Intersection Delay
According to the analysis results of survey data, we can see:
1) After the implementation of ATC system, the aver-age delay of the 179 intersections is reduced to 13.4s. Compared with the value 17.2 s before the
implementa-tion, the reduction is 28.35%. It is remarkably effective. 2) The intersection average delay of the 20 investi-gated sections except of Yingwu Road is reduced by 10%. or more. Among them, the south part of Guanggu Road has the largest percentage of reduction: 60.68%.
[image:4.595.93.503.582.623.2]H. GE ET AL. 109
Figure 2. Time-space diagram.
10.0 12.0 14.0 16.0 18.0 20.0
F Sa Su M T W Th
Single point control Cooperative control
`
0.4 0.45 0.5 0.55 0.6
F Sa Su M T W Th
Single point control Cooperative control
Figure 3. Average intersection delay and vehicle stops dur-ing the two weeks.
can find that the values of intersection average delay of days all reduced by 20% or more, where the delay in Wednesday reduces to 33.8%.
4) According to the analysis results compared by pe-riods before and after the implementation of ATC system, we can know that: During peak periods, the intersection average delay greatly reduces, where evening peak pe-riod’s is 37.14%. The reduction of intersection average delay in peak period can be effective in reducing the queue, waiting time at the intersections, increasing
inter-section capacity, and reducing the traffic congestion in peak period.
5.3. Comparison of Intersection Average Vehicle Stop Times
According to the analysis results of survey data, we can see:
1) The intersection average vehicle stop times of 20 sections is reduced from 0.56 stops to 0.47 stops with a reduction of 19.23%. It shows that, with the implementa-tion of ATC system the vehicle stop times at intersecimplementa-tions obviously reduces.
2) According to the analysis results compared by days before and after the implementation of ATC system, we find that the sharpest decline happened on Friday that reaches to 25%, while the reduction on Sunday is not obviously with a reduction of 12.24%. This may due to the low traffic flow.
3) According to the analysis results compared by pe-riods before and after the implementation of ATC system, we can know that: The average vehicle stop times in all periods has an obvious reduction, while the evening peak period reduces to 23.91% and midday low-peak period reduces to 12.5%.
5.4. Discussion
Each curve in Figure 3 represents a continuous variation trend of one investigated week. The horizontal axis represents time, starting in Friday this week and ending in Thursday next week. This started and ended with the assumption week in investigation periods, which has no influence to the result of the observation evaluation. The vertical axis unit of Figure average delay is “s”, while of average vehicle stop times is stop.
[image:5.595.58.288.85.562.2]regulates according to the real time traffic conditions, the traffic signal cooperative control can be achieved. This feature is consistent with Wardrop’s second principle (the minimization of a collective criterion) [16].
Figure 3 and Table 2 show: not only intersection av-erage delay, but also avav-erage vehicle stop times has re-duced when under cooperative control status comparing with single point control status. Average delay per stop at intersections in Wuhan is in the range of 25.714s ~ 32.143s .According to the data displayed from the two working status, the improvements of total delay and total stops of the network under cooperative control are 28.35% and 19.23% separately. Average delay per stop at intersections of the whole system under cooperative con-trol has more obvious improvements in weekdays with relatively less traffic which reduces about 3s/stop com-pared with the single point control working status while the improvements in non-working days with heavy traf-fic is less obvious. This improvement is quite signitraf-ficant to the whole system. After the implementation of Area Traffic Control system in Wuhan, the economic benefits due to reduction in travel time and flue consumption is proximately up to 2.08 billion yuan per year. At the same time, we can reduce about 67454.2 kg per year vehicle exhaust emissions which including NOx, CO and CH.
The facts show that cooperative control system can re-duce delay and vehicle stop times at intersections, also bring the traffic system enormous traffic benefits.
6. Conclusions
We have made a traffic survey of a part of Wuhan’s road network, which is using the methods of floating vehicles survey and vehicle GPS collecting the travel data. So the road network testing was made.
Using the GIS workstations of ArcGIS to edit the geo-graphic data sets, and with the benefit of excel macro editing function, we achieved the properties of the origi-nal record-points conversion to the set attribute.
Through the effective extraction of the original data and the analysis the trend graph of the average delay and the vehicle stop times at intersections, we found that un-der the cooperative control of the ATC system, the traffic conditions have been improved and the vehicle delay reduced in Wuhan.
Average intersection delay ds and average vehicle
stop times n were important indices to measure the
blocking degree while vehicles passing through the in-tersections. According to the research needs, we gave the definition and formulation of the average intersection delay per stop d.
This paper gave an intersection traffic performance test and evaluation of the whole ATC control regions,
and confirmed the authenticity of the improvement of the intersection operation conditions under the cooperative control and the validity of the cooperative control sys-tem.
7. Acknowledgements
The evaluation team would like to thank crew from Wor- ld Bank who provides a study chance for us. Huazhong University of Science and Technology (HUST) & Wuhan University of Technology deserve particular mention for their helps throughout the entire evaluation phase.
We also would like to thank all investigators and taxi drivers in this survey, who provided the GPS equipments for the study.
8. References
[1] J. H. Zhang and H. F. Lin, “The Research of Twice Park-ing Rate at Planed Signal Intersection,” Transportation Science & Technology, 2004, pp. 96-98.
[2] H. B. Du, “The Urban Road Network Optimization Bas-ing on Unblocked Reliability,” BeijBas-ing Technology Uni-versity, Beijing, 2002.
[3] T. Lu and F. Chen, “Intersection Optimal Design Based on Reliability Analysis of the Urban Road Network,” Journal of Highway and Transportation Research and Development, Vol. 11, 2006, pp. 150-152.
[4] B. L. Qian, “Study on the Comprehensive Performance Evaluation of the Mixed Traffic Flows,” Zhejiang Uni-versity, Hangzhou, 2006.
[5] J. C. Wang, J. Chun and D. Yi, “Performance Analysis of Traffic Networks Based on Stochastic Timed Petri Net Models,” Fifth IEEE International Conference (ICECC- S 99), Las Vagas, 1999, pp. 77-85.
[6] W. Brian and C. T. William, “Analysis of Intersection Delay under Real-time Adaptive Signal Contro,” Trans-portation Research Part C, Vol. 7, No. 1, 1999, pp. 53-72.
HHHUU
G. Q. Zhang, J. Lu, W. Wang and Q. J. Xiang, “Analysis of a Yield Controlled Highway Intersection Using Mi-croscopic Traffic Simulation,” Asia Simulation Confer-ence, Beijing, 2008, pp. 1487-1492.
[8] K. Li and W. G. Zhu, “Research on Method of Calculat-ing Bus’s Delay Time in Signal-Control CrossCalculat-ing,” Shanxi Architecture, Vol. 33, No. 1, 2007, pp. 34-36. [9] R. P. Zhai, F. C. Han and Y. L. Zheng, “Simulation Study
of Vehicle Stop Times and Parking Rate Basing on CA Traffic Flow Model,” Science and Technology, Vol. 3, 2007, pp. 68-71.
[10] Y. M. Zhao, “Prospect the Effect during the Development of Area Traffic Control in Urumqi,” Journal of the Party School of CPS Urumqi Municipal Committee, Vol. 3, 2003, pp. 60-62.
Compari-H. GE ET AL. 111
son with a TRANSYT Optimized Fixed Time System,” International Conference on Road Traffic Signaling, London, 1982.
[12] Moore, Sims, et al. “Three Traffic Signal Control Phi-losophies Applied to an Arterial Traffic System,”
Austra-lian Road Research Board Proceedings, New South
Wales, 1976.
[13] W. R. McShane and R. P. Roess, “Traffic Engineering Prentice-Hall,” Englewood Cliffs, New Jersey, 1990.
[14] W. Wang and X. C. Guo, et al. “Traffic Engineering,” Southeast University, Nanjing, 2000.
[15] B. Zhuang, L. Ma and R. L. Cai, “Vehicle Delay Models by Using Real-Time GPS Data,” Urban Transport of Chi- na, Vol. 7, No. 1, 2009, pp. 66-81.