arXiv:1701.02802v2 [astro-ph.GA] 18 Jan 2017
Simultaneous low- and high-mass star formation in a
massive protocluster: ALMA observations of G11.92-0.61
⋆
C. J. Cyganowski
1†
, C. L. Brogan
2, T. R. Hunter
2, R. Smith
3, J. M. D. Kruijssen
4,5,
I. A. Bonnell
1, Q. Zhang
61Scottish Universities Physics Alliance (SUPA), School of Physics and Astronomy, University of St. Andrews, North Haugh, St Andrews, Fife KY16 9SS, UK
2NRAO, 520 Edgemont Rd, Charlottesville, VA 22903, USA
3Jodrell Bank Centre for Astrophysics, School of Physics and Astronomy, University of Manchester, Oxford Road, Manchester M13 9PL, UK 4Astronomisches Rechen-Institut, Zentrum f¨ur Astronomie der Universit¨at Heidelberg, M¨onchhofstraße 12-14, D-69120 Heidelberg, Germany 5Max-Planck Institut f¨ur Astronomie, K¨onigstuhl 17, 69117 Heidelberg, Germany
6Harvard-Smithsonian Center for Astrophysics, 60 Garden Street, Cambridge, MA 02138, USA
Accepted 2017 Jan 06. Received 2016 Dec 23; in original form 2016 Oct 12
ABSTRACT
We present 1.05 mm ALMA observations of the deeply embedded high-mass protoclus-ter G11.92−0.61, designed to search for low-mass cores within the accretion reservoir of the massive protostars. Our ALMA mosaic, which covers an extent of ∼0.7 pc at sub-arcsecond (∼1400 au) resolution, reveals a rich population of 16 new millimetre continuum sources surrounding the three previously-known millimetre cores. Most of the new sources are located in the outer reaches of the accretion reservoir: the median projected separation from the central, massive (proto)star MM1 is∼0.17 pc. The de-rived physical properties of the new millimetre continuum sources are consistent with those of low-mass prestellar and protostellar cores in nearby star-forming regions: the median mass, radius, and density of the new sources are 1.3 M⊙, 1600 au, and
nH2∼10 7
cm−3
. At least three of the low-mass cores in G11.92−0.61 drive molecular outflows, traced by high-velocity12
CO(3-2) (observed with the SMA) and/or by H2CO and CH3OH emission (observed with ALMA). This finding, combined with the known outflow/accretion activity of MM1, indicates that high- and low-mass stars are forming (accreting) simultaneously within this protocluster. Our ALMA results are consistent with the predictions of competitive-accretion-type models in which high-mass stars form along with their surrounding clusters.
Key words: ISM: individual objects (G11.92-0.61) — ISM: molecules — stars: for-mation — stars: protostars — submillimetre: ISM
1 INTRODUCTION
Most stars form in clusters and associations (e.g.
Lada & Lada 2003;Kruijssen 2012), yet even basic aspects of how this occurs remain unknown—including the relative birth order of high and low mass stars. The classic view holds that low-mass stars must form first because high-mass stars (M>8 M⊙), once formed, would dissipate the natal
cloud, preventing further star formation (e.g.Herbig 1962). Some recent near-infrared, mid-infrared and X-ray studies support this view, suggesting that distributed populations of low-mass stars may form before high-mass stars in
fila-⋆ This paper is dedicated to the memory of Dr. Carol Klimick Cyganowski, scholar of English, American Studies, and Theatre. † E-mail: cc243@st-andrews.ac.uk
mentary clouds (e.g.Kumar et al. 2006;Povich & Whitney 2010; Foster et al. 2014; Rivilla et al. 2014). From optical, infrared, and X-ray observations of the DR21 massive star-forming region, Rivilla et al. (2014) also suggest that the gravitational potential of the low-mass (proto)stellar popu-lation may channel mass through filaments, facilitating the formation of massive stars within the deepest local potential wells.
It is, however, difficult to distinguish low-mass stars forming first from coeval low- and high-mass star for-mation based on observations that detect distributed populations of already-formed low-mass proto- or pre-main-sequence (PMS) stars in massive star-forming regions (see e.g. Foster et al. 2014). Studying the earliest, most embedded stages of cluster formation requires interfer-ometric observations at (sub)millimetre wavelengths.
In the pre-ALMA era, such observations often revealed ”proto-Trapezia” of closely spaced (.15,000 au) massive gas and dust cores,1 in the absence of low-mass cores or
infrared clusters (e.g. S255N, G11.92−0.61, G35.03+0.35, G11.11−0.12; Cyganowski et al. 2007; Zinchenko et al. 2012; Cyganowski et al. 2011a; Brogan et al. 2011;
Cyganowski et al. 2011b; Wang et al. 2014). The abil-ity of such studies to detect low-mass cores was, however, limited by sensitivity and dynamic range, with typical 5σ mass sensitivities to cold (10-20 K) cores of a few solar masses. The two (sub)millimetre studies to date that have attained markedly better mass sensitivities (5σ <<1 M⊙ for T=15 K) report strikingly different results. In
NGC6334I(N)–a massive (sub)millimetre (proto)cluster surrounded by infrared young stellar objects and X-ray sources–Hunter et al. (2014) detect numerous low-mass sources in 1.3 mm continuum emission, most with prop-erties (mass and size) more suggestive of discs around low-to-intermediate mass stars than of pre- or proto-stellar cores. In contrast, Zhang et al. (2015) do not detect a distributed population of low-mass sources in ALMA Cycle 0 observations of the infrared dark cloud (IRDC) clump and (sub)millimetre (proto)cluster G28.34+0.06 P1, and conclude that the low-mass stars will form later (after high-mass cluster members). Unlike in NGC6334I(N), however, the ”central” sources in P1 are not (yet) massive themselves; G28.34+0.06 P1 is in an early evolutionary phase, with low- to intermediate-mass embedded (proto)stars (see also discussion inZhang et al. 2015).
Establishing whether low and high mass stars form
simultaneously requires studying deeply embedded young proto-clusters, in which accretion is ongoing onto high-mass (proto)stars. Observations of this stage of protoclus-ter evolution are crucial for constraining models of high-mass star formation. Theoretical models of high-high-mass star formation fall into two main classes: “core accretion” and “competitive accretion”-type models (e.g. as reviewed by
Tan et al. 2014). Core accretion models describe the col-lapse of self-gravitating, centrally concentrated cores with radii of ∼0.1 pc to form a star or small-N multiple sys-tem (e.g. Tan et al. 2014, and references therein). The cores are treated as initial conditions (e.g. Tan et al. 2014;
Myers et al. 2013; McKee & Tan 2003, 2002); as a result, this class of models makes no prediction for the formation order of high and low-mass stars within a cluster. In con-trast, competitive accretion-type modelsrequire that high-mass stars form in a cluster environment (e.g.Bonnell et al. 2004; Bonnell & Smith 2011). In cluster-scale models, in-cluding those that incorporate (proto)stellar feedback (e.g.
Smith et al. 2009; Peters et al. 2010a,b; Wang et al. 2010;
Peters et al. 2011), high-mass stars and their surrounding clusters of low and intermediate mass stars form simulta-neously.Smith et al.(2009) show that the central, massive (proto)star accretes gas over a radius of∼0.2 pc in 0.25 of the clump’s dynamical time (0.25tdyn ∼1.2×10⁵ years): within
this volume there are also numerous bound, low-mass cores (e.g. Figure 8 ofSmith et al. 2009). Thus a key, testable
pre-1 ”Core” refers to .0.1 pc structures likely to form single stars
or small multiple systems, in contrast to ”clump,” which refers to parsec-scale structures of mass sufficient to form clusters.
diction of these models is that centrally condensed, low-mass cores should exist within the same accretion reservoir as a forming high-mass star.
As a step towards identifying a population of low-mass cores in the vicinity of a massive millimetre (proto)cluster, we proposed an ALMA Cycle 2 observation designed to de-tect and characterise these objects in G11.92−0.61. We chose this target because it is young, deeply embedded, and known to contain at least one accreting high-mass (proto)star. Identified as a GLIMPSE Extended Green Object (EGO) by Cyganowski et al. (2008), the extended 4.5 µm emis-sion associated with G11.92−0.61 indicates the presence of shocked H2in anactiveoutflow, and hence ongoing accretion
(Cyganowski et al. 2008, see alsoLee et al. 2012,2013). Lo-cated in an IRDC (Cyganowski et al. 2008), the EGO is co-incident with clump-scale (sub)millimetre emission in single-dish maps (e.g. byWalsh et al. 2003; Fa´undez et al. 2004;
Thompson et al. 2006, targeting IRAS 18110-1854 ∼1′ to
the NE, and in the ATLASGAL survey,Schuller et al. 2009). Our initial Submillimeter Array (SMA) and Combined Ar-ray for Research in Millimeter-wave Astronomy (CARMA) observations (Cyganowski et al. 2011a, resolution∼2′′.4 and
1′′.1 at 1.3 mm and 1.4 mm, respectively) revealed three
com-pact millimetre continuum cores, detected in thermal dust emission.
The brightest of these millimetre cores, MM1, is associated with a 6.7 GHz Class II CH3OH
maser (Cyganowski et al. 2009), strong H2O masers
(Hofner & Churchwell 1996; Breen & Ellingsen 2011;
Sato et al. 2014; Moscadelli et al. 2016), and hot-core line emission (Cyganowski et al. 2011a, 2014), and drives a massive, high-velocity, well-collimated bipolar molecular outflow (traced by 12CO(2-1), HCO+(1-0), and 12
CO(3-2); Cyganowski et al. 2011a, 2014). Numerous 44 GHz Class I CH3OH masers also trace shocked outflow gas
(Cyganowski et al. 2009). In 0′′.5-resolution SMA 1.3 mm
observations, a variety of hot-core molecules display con-sistent velocity gradients that are well-fit by a model of a Keplerian disc, including infall, that surrounds an enclosed mass of ∼30-60 M⊙ (of which 2-3 M⊙ is attributed to
the disc; Ilee et al. 2016). In sum, all the known observed properties of MM1–including its weak (.1 mJy) centimetre-wavelength continuum emission (Cyganowski et al. 2011b,
2014;Moscadelli et al. 2016;Ilee et al. 2016)–are consistent with this source being a massive proto-O star that is still in the process of formation, i.e. undergoing ongoing accretion (see alsoIlee et al. 2016).
In addition to MM1, the massive members of the G11.92−0.61 (proto)cluster include MM2, a strong (sub)millimetre continuum source that lacks any other star-formation indicators and is a strong candidate for a mas-sive starless core (Mgas &30 M⊙; Cyganowski et al. 2014).
The nature of MM3, the third known millimetre contin-uum core, is less clear from the SMA and CARMA ob-servations. MM3 is associated with a 6.7 GHz Class II CH3OH maser and with Spitzer MIPS 24 µm emission,
both indicative of the presence of a massive (proto)star (Cyganowski et al. 2009,2011a). However, the core gas mass derived from our SMA and CARMA observations is mod-est (∼2-9 M⊙, depending on the assumed dust
tempera-ture), and C18O(2-1) was the only molecule detected with
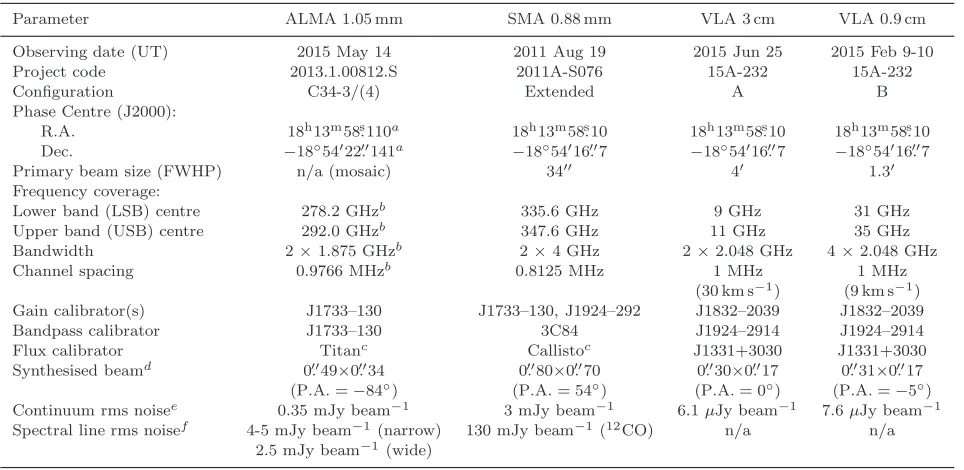
Table 1.Observational Parameters.
Parameter ALMA 1.05 mm SMA 0.88 mm VLA 3 cm VLA 0.9 cm
Observing date (UT) 2015 May 14 2011 Aug 19 2015 Jun 25 2015 Feb 9-10
Project code 2013.1.00812.S 2011A-S076 15A-232 15A-232
Configuration C34-3/(4) Extended A B
Phase Centre (J2000):
R.A. 18h13m58s.110a 18h13m58s.10 18h13m58.s10 18h13m58s.10
Dec. −18◦54′22′′.141a −18◦54′16′′.7 −18◦54′16.′′7 −18◦54′16′′.7
Primary beam size (FWHP) n/a (mosaic) 34′′ 4′ 1.3′
Frequency coverage:
Lower band (LSB) centre 278.2 GHzb 335.6 GHz 9 GHz 31 GHz
Upper band (USB) centre 292.0 GHzb 347.6 GHz 11 GHz 35 GHz
Bandwidth 2×1.875 GHzb 2×4 GHz 2×2.048 GHz 4×2.048 GHz
Channel spacing 0.9766 MHzb 0.8125 MHz 1 MHz 1 MHz
(30 km s−1) (9 km s−1)
Gain calibrator(s) J1733–130 J1733–130, J1924–292 J1832–2039 J1832–2039
Bandpass calibrator J1733–130 3C84 J1924–2914 J1924–2914
Flux calibrator Titanc Callistoc J1331+3030 J1331+3030
Synthesised beamd 0.′′49×0′′.34 0′′.80×0.′′70 0′′.30×0′′.17 0′′.31×0.′′17 (P.A.=−84◦) (P.A.= 54◦) (P.A.= 0◦) (P.A.=−5◦) Continuum rms noisee 0.35 mJy beam−1 3 mJy beam−1 6.1µJy beam−1 7.6µJy beam−1
Spectral line rms noisef 4-5 mJy beam−1(narrow) 130 mJy beam−1(12CO) n/a n/a
2.5 mJy beam−1 (wide)
a: For central mosaic pointing; see Section2.1.
b: For the two wideband spws; see Section2.1for details of the five narrow spws targeting specific spectral lines. For the wideband spws, the Hanning-smoothed spectral resolution is 1.156×the channel spacing due to online channel averaging in the ALMA correlator.
c: Using Butler-JPL-Horizons 2012 models.
d: For continuum image.
e: ALMA: the rms noise varies as a function of position in the image due to dynamic range limitations (Section2.1): the quoted value is representative.
f: ALMA: the rms noise varies as a function of position in the image and spectral channel due to dynamic range limitations (Section2.1): quoted values are for channelswithoutbright/complex emission, for narrow spws (imaged with ∆v=0.5 km s−1) and wide spws (imaged with ∆v=1.1 km s−1) respectively. SMA:12CO (3-2) data were smoothed to 1.5
km s−1, see Section2.2.
are only resolved at (sub)millimetre and longer wavelengths; the total luminosity of the G11.92−0.61 region is∼104 L
⊙
(Cyganowski et al. 2011a;Moscadelli et al. 2016).
In this paper, we present the discovery of a population of low-mass cores in the massive (proto)cluster G11.92−0.61 as revealed by our sub-arcsecond-resolution ALMA Cycle 2 1.05 mm observations. We complement our new ALMA data with deep NRAO Karl G. Jansky Very Large Array (VLA) images of G11.92−0.61 at 3 cm and 0.9 cm (used by
Ilee et al. 2016 and Hunter et al. 2016 to study MM1 and MM2, respectively), and with SMA12CO(3-2) observations
that trace high-velocity outflows. We describe our observa-tions in Section 2, and our results in Section 3. Section 4
presents our analysis of the physical properties of the newly-detected sources and their molecular outflows, and discusses our results; our main conclusions are summarised in Sec-tion 5. Throughout, we adopt the maser parallax distance to G11.92–0.61 of 3.37+0.39
−0.32kpc (Sato et al. 2014).
2 OBSERVATIONS
2.1 ALMA
We observed G11.92−0.61 at 1.05 mm with ALMA in Cycle 2, with 37 antennas available for the observations.
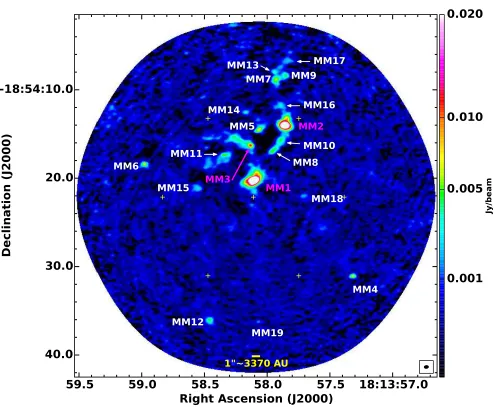
We used a seven-pointing mosaic to cover the extent of the (sub)millimetre continuum emission seen with single-dish telescopes (e.g. the ATLASGAL survey;Schuller et al. 2009). The field of view of our ALMA mosaic is∼40′′
wide (within the 30% power point; see Figure 1), equivalent to
∼0.65 pc at the distance of G11.92−0.61 (3.37 kpc; Sec-tion1). The total time on-source was 44 minutes, and the projected baselines ranged from∼21-542 kλ. The largest an-gular scale on which the observations are sensitive to smooth structures is∼8′′, equivalent to∼0.13 pc (scale at which 10%
of peak brightness would be recovered for a Gaussian source; multiply by 0.55 for 50% recovery;Wilner & Welch 1994). Additional observational parameters are given in Table1.
The ALMA correlator was configured to cover seven spectral windows (spws): two with wide bandwidths and rel-atively coarse spectral resolution for continuum sensitivity (details in Table1), and five narrow spws tuned to particular spectral lines. One spw covered the N2H+ (3-2) line, with a
bandwidth of 468.8 MHz and a spectral resolution (Hanning-smoothed) of 0.244 MHz (∼503 km s−1 and ∼0.3 km s−1,
respectively). The other four narrow spws each had 117.2 MHz (∼121 km s−1) bandwidth and 0.244 MHz spectral
resolution (also Hanning-smoothed), and covered DCN (4-3) at 289.64492 GHz,34SO 6
7−56at 290.56224 GHz, H2CO
40,4−30,3 at 290.62341 GHz, and C33S (6-5) at 291.48593
18:13:57.0
57.5
58.0
58.5
59.0
59.5
Right Ascension (J2000)
40.0
30.0
20.0
-18:54:10.0
D
e
c
li
n
a
ti
o
n
(
J2
0
0
0
)
MM1 MM2
MM4 MM5
MM6
MM7 MM9
MM12
MM14
MM15
MM18
MM19
MM3
MM8 MM10 MM11
MM13
MM16 MM17
1"~3370 AU
0.001
0.005
0.010
0.020
[image:4.595.47.541.96.503.2]Jy/beam
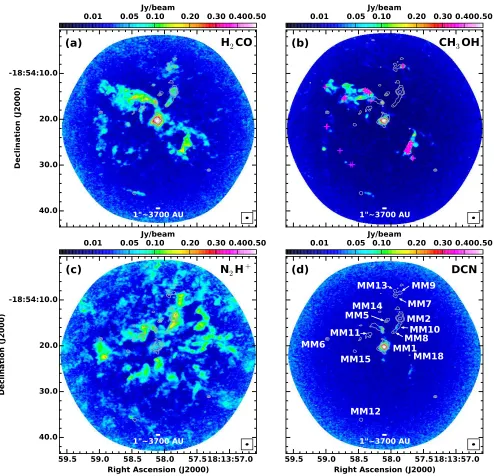
Figure 1.ALMA 1.05 mm continuum image of G11.92−0.61, shown in colourscale. The ALMA synthesised beam is shown at lower right. The edge of the colourscale image corresponds to the 30% power point of the ALMA mosaic (width∼0.65 pc, Section2.1); yellow crosses mark the centres of the seven mosaic pointings. The three previously known millimetre sources (e.g.Cyganowski et al. 2011a) are labelled in magenta, while newly detected sources are labelled in white.
The ALMA data were calibrated using the CASA 4.2.2 version of the ALMA calibration pipeline. Titan was used to set the absolute flux scale, and we estimate the absolute flux uncertainty to be∼10%. After the calibration was applied, the science target data were split off, and line-free chan-nels were used to construct a pseudo-continuum dataset. Identifying line-free channels is complicated by the line-rich spectrum of the hot core MM1. To select line-free channels for continuum imaging and continuum subtraction, we first made dirty line+continuum cubes of the seven ALMA spws. Using these cubes, we tested different threshold levels for line-free channel identification (this approach is similar to that used byBrogan et al. 2016in their study of NGC6334I, with two line-rich hot cores). Selecting line-free channels in the C33S spectral window (spw 3) proved problematic due to wide lines and possible absorption features, and we omitted this narrow spw from our final continuum dataset. Based on our threshold tests and comparison of the flux densities in the resulting continuum images, we estimate a residual line
contamination for the hot core source MM1 at the level of 10-15% for the adopted threshold level. The adopted threshold represents a compromise between reducing line contamina-tion of MM1 and attaining good sensitivity to weak contin-uum sources with little or no line emission, since the image rms noise depends on the aggregate continuum bandwidth. The total ”line-free” bandwidth used for our final continuum image is∼2.4 GHz.
The continuum data were iteratively self-calibrated, and the solutions applied to the line data. The final ALMA con-tinuum image was made using multi-frequency synthesis and a robust weighting parameter of 0. This yields a synthe-sised beam of 0′′.49×0′′.34, equivalent to a linear resolution
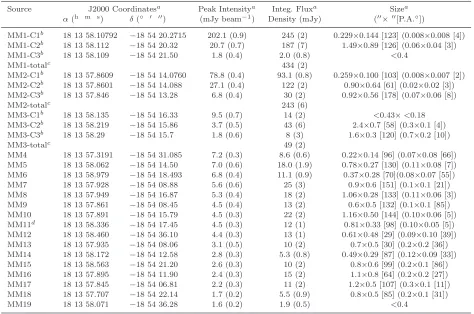
Table 2.Observed Properties of Continuum Sources.
Source J2000 Coordinatesa Peak Intensitya Integ. Fluxa Sizea
α(h m s) δ(◦ ′ ′′) (mJy beam−1) Density (mJy) (′′×′′[P.A.◦])
MM1-C1b 18 13 58.10792 −18 54 20.2715 202.1 (0.9) 245 (2) 0.229×0.144 [123] (0.008×0.008 [4]) MM1-C2b 18 13 58.112 −18 54 20.32 20.7 (0.7) 187 (7) 1.49×0.89 [126] (0.06×0.04 [3])
MM1-C3b 18 13 58.109 −18 54 21.50 1.8 (0.4) 2.0 (0.8) <0.4
MM1-totalc 434 (2)
MM2-C1b 18 13 57.8609 −18 54 14.0760 78.8 (0.4) 93.1 (0.8) 0.259×0.100 [103] (0.008×0.007 [2]) MM2-C2b 18 13 57.8601 −18 54 14.088 27.1 (0.4) 122 (2) 0.90×0.64 [61] (0.02×0.02 [3]) MM2-C3b 18 13 57.846 −18 54 13.28 6.8 (0.4) 30 (2) 0.92×0.56 [178] (0.07×0.06 [8])
MM2-totalc 243 (6)
MM3-C1b 18 13 58.135 −18 54 16.33 9.5 (0.7) 14 (2) <0.43×<0.18 MM3-C2b 18 13 58.219 −18 54 15.86 3.7 (0.5) 43 (6) 2.4×0.7 [58] (0.3×0.1 [4]) MM3-C3b 18 13 58.29 −18 54 15.7 1.8 (0.6) 8 (3) 1.6×0.3 [120] (0.7×0.2 [10])
MM3-totalc 49 (2)
MM4 18 13 57.3191 −18 54 31.085 7.2 (0.3) 8.6 (0.6) 0.22×0.14 [96] (0.07×0.08 [66]) MM5 18 13 58.062 −18 54 14.50 7.0 (0.6) 18.0 (1.9) 0.78×0.27 [130] (0.11×0.08 [7]) MM6 18 13 58.979 −18 54 18.493 6.8 (0.4) 11.1 (0.9) 0.37×0.28 [70](0.08×0.07 [55]) MM7 18 13 57.928 −18 54 08.88 5.6 (0.6) 25 (3) 0.9×0.6 [151] (0.1×0.1 [21]) MM8 18 13 57.949 −18 54 16.87 5.3 (0.4) 18 (2) 1.06×0.28 [133] (0.11×0.06 [3]) MM9 18 13 57.861 −18 54 08.45 4.5 (0.4) 13 (2) 0.6×0.5 [132] (0.1×0.1 [85]) MM10 18 13 57.891 −18 54 15.79 4.5 (0.3) 22 (2) 1.16×0.50 [144] (0.10×0.06 [5]) MM11d 18 13 58.336 −18 54 17.45 4.5 (0.3) 12 (1) 0.81×0.33 [98] (0.10×0.05 [5]) MM12 18 13 58.460 −18 54 36.10 4.4 (0.3) 13 (1) 0.61×0.48 [29] (0.09×0.10 [39]) MM13 18 13 57.935 −18 54 08.06 3.1 (0.5) 10 (2) 0.7×0.5 [30] (0.2×0.2 [36]) MM14 18 13 58.172 −18 54 12.58 2.8 (0.3) 5.3 (0.8) 0.49×0.29 [87] (0.12×0.09 [33]) MM15 18 13 58.563 −18 54 21.20 2.6 (0.3) 10 (2) 0.8×0.6 [99] (0.2×0.1 [86]) MM16 18 13 57.895 −18 54 11.90 2.4 (0.3) 15 (2) 1.1×0.8 [64] (0.2×0.2 [27]) MM17 18 13 57.845 −18 54 06.81 2.2 (0.3) 11 (2) 1.2×0.5 [107] (0.3×0.1 [11]) MM18 18 13 57.707 −18 54 22.14 1.7 (0.2) 5.5 (0.9) 0.8×0.5 [85] (0.2×0.1 [31])
MM19 18 13 58.071 −18 54 36.28 1.6 (0.2) 1.9 (0.5) <0.4
a: From two-dimensional Gaussian fitting; “size” is deconvolved source size (FWHM). Statistical uncertainties are indicated by the number of significant figures or given in parentheses. For sources too small/weak to have reliable fitted sizes, ”size” is quoted as<the geometric mean of the synthesised beam.
b: Source fit with multiple Gaussian components, designated -C#. To obtain a reasonably good fit, MM1-C3 was fit separately (while MM1-C1 and MM1-C2 were fit simultaneously, with a two-component Gaussian fit) and a zero-level offset of 0.77 mJy beam−1 was required. MM3-C1 is fit as a point source: the size quoted is the upper limit from the
CASA IMFIT task. MM3-C2 and MM3-C3 together describe the extended emission NE of the MM3-C1 point source.
c: Flux density measured within the local 3σcontour level; quoted uncertainties are estimated as the local rms multiplied by the number of independent beams within the source area. For MM2, the 3σcontour level connects MM2 to MM8, MM10, and MM16. Instead of reporting a total flux that would encompass all of these sources, we additionally apply RA and Dec limits (RA: 18h13m57.75s to 18h13m57.94s, Dec:−18◦54′12.5′′to−18◦54′15.3′′) to isolate MM2, and increase the quoted uncertainty to account for the uncertainty introduced by the choice of limits.
d: Fit with a zero-level offset of 0.37 mJy beam−1 to obtain a reasonable fit to the dominant compact source; it is unclear
if the weaker emission to the south is associated with MM11, or arises from additional sources not resolved in our data.
the image, from ∼0.25 mJy beam−1 to &0.5 mJy beam−1
(in the immediate vicinity of MM1 and MM3). For transi-tions with bright emission associated with MM1 or its out-flow, the line data are also affected by dynamic range limita-tions and increased noise associated with poorly-recovered extended structure(s). For H2CO 4(0,4)-3(0,3) and N2H+
(3-2), the rms in channels with bright, complex emission is 2-5×higher than the∼4 mJy beam−1measured in channels
without bright emission. The line image cubes were made with a robust weighting parameter of 0.5, to achieve the best compromise between sensitivity and confusion from missing short spacing information. The synthesised beamsize varies slightly for the various line image cubes, as a function of frequency: for example, the synthesised beam is 0.′′54×0.′′40
(P.A.=−82◦
) for the N2H+ (3-2) cube (νrest =279.51175
GHz), and 0′′.53×0′′.38 (P.A.=−83◦) for the H
2CO 40,4−30,3
cube. For better sensitivity to faint emission, the narrow spws were imaged with 0.5 km s−1 channels. All
measure-ments were made from images corrected for the primary beam response.
2.2 SMA and VLA
To complement our new ALMA observations, we make use of previously-published SMA 0.88 mm and VLA 3 cm and 0.9 cm observations of G11.92−0.61. The SMA 0.88 mm dataset was used byCyganowski et al.(2014) to study the candidate massive prestellar core G11.92−0.61 MM2, and is described in that publication. Observational details are included in Table 1 for completeness; here, we consider only the12CO(3-2) data. To better identify and characterise
reimaged the 12CO(3-2) data to generate an image cube
smoothed to 1.5 km s−1 resolution (as compared to 3 km
s−1inCyganowski et al. 2014). The spectral line rms quoted
in Table 1is for the new 1.5 km s−1 cube. The12CO(3-2)
synthesised beam is 0′′.
80×0′′.
72 (P.A.=45◦
),∼2700×2400 au at 3.37 kpc. The VLA 3 cm and 0.9 cm data were used by
Ilee et al. (2016) to study G11.92−0.61 MM1, a candidate Keplerian disc around a proto-O star, and are described in that publication. Details of these VLA observations are also presented in Table1.
3 RESULTS
3.1 Continuum Emission
Figure1presents our ALMA 1.05 mm continuum image of G11.92−0.61. As shown in Fig.1, the sensitivity and imag-ing fidelity of ALMA reveal numerous additional sources sur-rounding the three massive (proto)cluster members. Within our ALMA mosaic (30% power point) we detect 16 new sources at >5σ, which we name MM4...MM19 in order of descending peak intensity. As noted in Section2.1, the rms noise varies significantly across the image; we measured the rms locally to evaluate whether potential sources met the
>5σ threshold. We carefully examined our deep VLA 3 cm and 0.9 cm images (Table 1, Section 2.2) to check for centimetre-wavelength counterparts to the newly discovered ALMA sources. None of MM4...MM19 are detected in the VLA images, with 4σlimits of 24.4µJy beam−1at 3 cm and
30.4µJy beam−1 at 0.9 cm.
The observed properties of the millimetre continuum sources, as determined from two-dimensional Gaussian fits, are presented in Table 2. The newly detected sources are sufficiently compact that a single two-dimensional Gaussian provides a reasonable fit to the observed emission. In con-trast, the previously known millimetre sources MM1, MM2, and MM3 require multiple Gaussian components to obtain reasonably noise-like residuals (Table2). With our current angular resolution, it is unclear whether any of MM1..MM3 harbor multiple cores or protostars, or if these millimetre sources simply have non-axisymmetric extended dust emis-sion. For this reason, we do not consider components des-ignated -C* as part of our newly discovered source popula-tion. We also note that for MM1, even a multiple-component fit leaves significant residuals (the strongest with a peak of
∼7 mJy beam−1), which may indicate the presence of
addi-tional compact structure(s) unresolved by our observations. Recent ALMA observations of NGC6334I with 220 au res-olution (∼6× finer than the G11.92−0.61 data presented here) reveal that the dominant hot core NGC6334I-MM1 is comprised of seven components clustered within a radius of 1000 au (Brogan et al. 2016). Higher angular resolution observations will be required to probe the substructure of the bright sources MM1..MM3 in G11.92−0.61. For these three sources, Table 2 presents a ”total” flux density mea-sured within the local 3σcontour level, for comparison with the Gaussian fitting results.
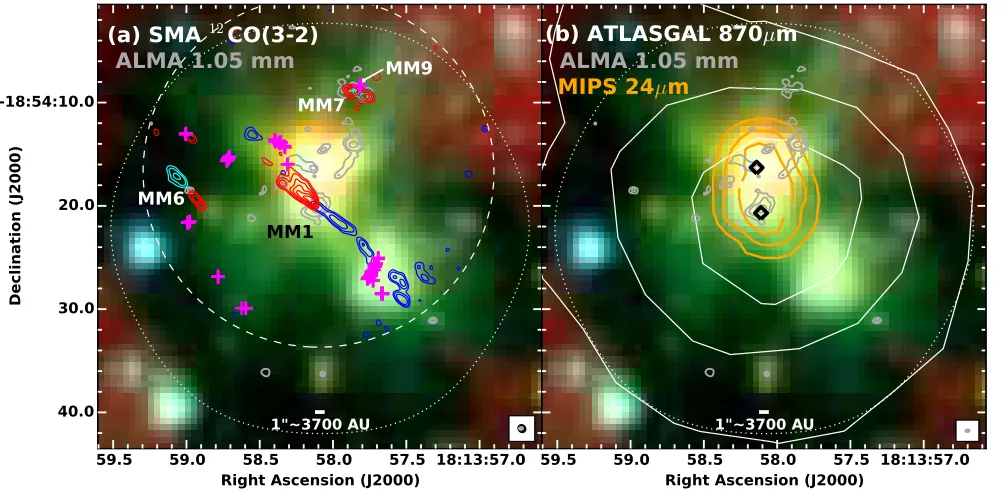
Figure2shows our ALMA continuum results in the con-text of previous observations of G11.92−0.61 at mid-infrared (MIR)-centimetre wavelengths. As seen in Figure2, the Ex-tended Green Object G11.92−0.61 has a bipolar MIR mor-phology (see also e.g.Cyganowski et al. 2008,2009,2011a):
the northeast lobe is bright in multipleSpitzer IRAC bands and at 24 µm (in addition to its 4.5 µm emission), while the southwest 4.5µm lobe is associated with strong 44 GHz Class I CH3OH masers, which trace shocked gas at
outflow-cloud interfaces (e.g.Plambeck & Menten 1990;Kurtz et al. 2004; Cyganowski et al. 2009). MM1 and MM3 are coin-cident with the MIR-bright northeast lobe, as are a few of the newly-detected millimetre continuum sources (MM5, MM11, and MM14). The ridge or filament made up of MM8 and MM10 lies near the western edge of the northeast lobe, and is also coincident with multiband MIR emission. These two sources are unusual among the new ALMA detections in forming part of a larger, elongated millimetre contin-uum structure, and also in their associated line emission (Section 3.2). In massive star-forming regions, H2 (from
shocked gas in outflows) and PAHs (easily excited by mas-sive (proto)stars) contribute significantly to the IRAC bands (see e.g. discussion inCyganowski et al. 2008). We note that in this context, and given the comparatively coarse resolu-tion of IRAC (∼1.5-2′′) relative to our ALMA observations,
the fact that MM5, MM8, MM10, MM11, and MM14 are co-incident with the northeast lobe does not necessarily mean that these sources are themselves sufficiently warm or en-ergetic to excite MIR emission. The (saturated) MIPS 24
µm emission is likely a blend of emission from MM1 and MM3 (see also discussion inCyganowski et al. 2009,2011a), each of which is associated with a 6.7 GHz Class II CH3OH
maser, indicative of the presence of a massive (proto)star (e.g. Minier et al. 2003). The nature of MM3 is discussed further in Section4.3.
The majority of the newly-detected millimetre contin-uum sources are located on the fringes of the GLIMPSE Extended Green Object, coincident either with extended 4.5 µm emission (which appears as green in Figure 2) or with no MIR emission at all. Three sources (MM4, MM15, and MM18) are coincident with 4.5µm emission, while two (MM6 and MM12) are MIR-dark. The northern group of sources comprised of MM7, MM9, MM13, and MM17 lies between two fingers of extended 4.5µm emission, as does MM16. Interestingly, three of the new millimetre continuum sources detected with ALMA–MM4, MM6, and MM12–are notably isolated, and are either point sources (MM4 and MM6) or approximately round (MM12). Of these three, MM6 and MM12 are located in infrared-dark regions of the Spitzer GLIMPSE image, e.g. in the IRDC. Notably, while many of the newly-detected millimetre sources are lo-cated far from the cluster centre (e.g. from MM1; see also Section4.1) and from bright MIR emission, all are within the half-power level of the ATLASGAL 870µm clump (Fig-ure2b).
We note that MM19 is an outlier among the ALMA-detected sources, in both its MIR and millimetre properties. The weakest of the ALMA detections (Sint=1.9±0.5 mJy),
counter-18:13:57.0 57.5
58.0 58.5
59.0 59.5
Right Ascension (J2000) 40.0
30.0 20.0 -18:54:10.0
Declination (J2000)
MM1 MM6
MM7
MM9
1"~3700 AU
(a) SMA
12CO(3-2)
ALMA 1.05 mm
18:13:57.0 57.5
58.0 58.5
59.0 59.5
Right Ascension (J2000)
1"~3700 AU
(b) ATLASGAL 870
µ
m
[image:7.595.47.550.103.350.2]ALMA 1.05 mm
MIPS 24
µ
m
Figure 2.SpitzerGLIMPSE three-colour image (RGB: 8.0, 4.5, 3.6µm) overlaid with ALMA 1.05 mm continuum contours (dark grey) and contours of (a) composite maps of blueshifted/redshifted SMA12CO(3-2) emission (corrected for the response of the primary beam,
and masked outside its FWHP level); (b) ATLASGAL 870µm (white) andSpitzerMIPS 24µm (orange) emission. In both panels, the 30% power point of the ALMA mosaic (width∼0.65 pc, Section2.1) is shown as a dotted white contour; in (a), the FWHP SMA primary beam is also shown, as a dashed white circle. Class I CH3OH masers (magenta +) are marked in (a), Class II CH3OH masers (black♦)
in (b) (both fromCyganowski et al. 2009). Contour levels: ALMA 1.05 mm: [5,15,100]×0.35 mJy beam−1–note that with these levels
MM19 is not contoured (Section 2.1, Tables1 and2), a grey◦ marks its position from Table2; SMA12CO: 1.0 Jy beam−1 km s−1
×[4,6,9] (blue, cyan), ×[4,6,9,12,15,18] (red). Velocity ranges are optimised for each source (see Section3.2). ATLASGAL: [0.4, 0.6, 0.8]×peak=5.25 Jy beam−1; MIPS: 900, 1350, 1800 MJy sr−1. The ATLASGAL and MIPS resolutions are∼19′′and∼6′′, respectively; each panel shows the ALMA (grey) and/or SMA (black) synthesised beam(s) at the lower right.
part to MM19 is associated with this dominant outflow. This combination of properties raises the possibility that MM19 may differ in character from the other newly detected mil-limetre continuum sources; the nature of the newly-detected sources is discussed further in Section4.1.
3.2 Line Emission
In this paper, we focus on molecular line emission as it relates to the newly-discovered population of millime-tre continuum sources; the copious, compact hot-core line emission associated with MM1 will be the subject of a future publication, and is not considered here. Our ini-tial millimetre-wavelength interferometric observations of G11.92−0.61 showed a single dominant bipolar molecu-lar outflow, driven by MM1 and traced by high-velocity, well-collimated12CO(2-1) and HCO+(1-0) emission (in 2′′.
4-resolution 1.3 mm SMA and 5′′.9-resolution 3 mm CARMA
observations, respectively; Cyganowski et al. 2011a). Fig-ure2a presents this outflow–centred on MM1, with the red-shifted lobe to the NE and the bluered-shifted lobe to the SW–as seen at 0′′.76 (∼2550 au) resolution with the SMA in12
CO(3-2) (Section 2.2, Table 1; see also Cyganowski et al. 2014;
Ilee et al. 2016). Remarkably, combining the subarcsecond-resolution SMA 12CO(3-2) data with our new ALMA 1.05
mm continuum image reveals that at least two of the new
ALMA sources–MM6, and MM7 and/or MM9–are also driv-ing molecular outflows.
As shown in Figure2a, the outflow driven by MM6 is extremely well-collimated; the blue- and red-shifted lobes are well separated, and centred on the millimetre continuum source. Blue- and red-shifted12CO(3-2) emission is also
de-tected in the vicinity of MM7 and MM9, coincident with 44 GHz Class I CH3OH masers. In this case, there is substantial
overlap between the blue- and red-shifted lobes; it is unclear whether MM7 or MM9 is the more likely driving source, and indeed whether the CO emission is attributable to one or to multiple outflows. The red, blue, and cyan contours in Fig-ure2a represent a composite map of the blue- and redshifted
12CO(3-2) emission: integrated velocity ranges are optimised
for each outflow, assuming vLSR=35 km s−1 (in the absence
of compact emission from, and so measured velocities for, the newly-detected millimetre continuum sources, as discussed below). The integrated velocity ranges for the MM6 outflow are 6.5–27.5 km s−1 (blue) and 48.5–84.5 km s−1 (red), for
the MM7/MM9 outflow are 23.0–30.5 km s−1 (blue) and
42.5–56.0 km s−1 (red), and for the remainder of the map
(including the main MM1 outflow) are−17.5–20.0 km s−1
(blue) and 50.0–74.0 km s−1 (red).
Figure 3 presents peak maps of the ALMA H2CO
40,4−30,3 (νrest=290.62341 GHz, Eupper=35 K), CH3OH
9−1−80 (νrest=278.30451 GHz, Eupper=110 K), N2H+
40.0 30.0 20.0 -18:54:10.0
Declination (J2000)
(a)
H
2CO
1"~3700 AU
(b)
CH
3OH
1"~3700 AU
18:13:57.0 57.5
58.0 58.5 59.0 59.5
Right Ascension (J2000) 40.0
30.0 20.0 -18:54:10.0
Declination (J2000)
(c)
N
2H
+
1"~3700 AU
18:13:57.0 57.5
58.0 58.5 59.0 59.5
Right Ascension (J2000)
(d)
DCN
MM1 MM2 MM5
MM6
MM7
MM8 MM9
MM10 MM11
MM12 MM13
MM14
MM15 MM18
1"~3700 AU
0.01 0.05 0.10 0.20 0.30 0.400.50 Jy/beam
0.01 0.05 0.10 0.20 0.30 0.400.50 Jy/beam
0.01 0.05 0.10 0.20 0.30 0.400.50 Jy/beam
[image:8.595.48.542.101.577.2]0.01 0.05 0.10 0.20 0.30 0.400.50 Jy/beam
Figure 3.ALMA peak maps of (a) H2CO 40,4−30,3, (b) CH3OH 9−1−80(Class I maser line;Voronkov et al. 2012;Yanagida et al. 2014),
(c) N2H+(3-2), and (d) DCN (4-3) in colourscale, overlaid with contours of ALMA 1.05 mm continuum emission (levels: [5,15,100]×0.35
mJy beam−1; note that with these levels MM19 is not contoured, see Section 2.1 and Tables 1 and 2). In each panel, the ALMA
synthesised beam is shown at lower right, and the edge of the colourscale image corresponds to the 30% power point of the ALMA mosaic. In (b), positions of 44 GHz Class I CH3OH masers fromCyganowski et al.(2009) are marked with magenta +.
(νrest=289.64492 GHz, Eupper=35 K) emission. These four
transitions are representative of the range of morphologies seen in our ALMA data for lines that exhibit extended emission, including lines detected within the two wideband spectral windows (spws; Table 1). As illustrated by Fig-ure3, no line detected within our ALMA spectral coverage– including N2H+(3-2)–exhibits an emission morphology
con-sistently similar to that of the millimetre continuum. Of the newly-detected millimetre continuum sources, only MM8 and MM10 are associated with molecular line emission– N2H+, H2CO, and DCN–that is morphologically similar to
the dust continuum, and so likely to arise from the same physical volume. These two exceptions also differ from the other newly-detected sources in forming an extended ridge or filament of millimetre continuum emission south of MM2. The two phenomena may be related: close examination of the line cubes suggests that the molecular emission, partic-ularly for DCN, may trace the filament as a whole rather than two distinct continuum cores. Interestingly, CH3OH
new millimetre continuum sources means that we cannot, in general, measure their individual LSR velocities from our ALMA data.
For most of the lines in our ALMA tuning that ex-hibit extended emission, that emission is dominated by the massive outflow driven by MM1. In addition to the H2CO line shown in Figure 3a, our ALMA spectral
cov-erage includes four other low-excitation lines of H2CO (two
with Eupper=82 K and two with Eupper=141 K) and one
of CH3OH (Eupper=64 K); these relatively low-excitation
lines of outflow-tracing molecules all exhibit similar mor-phologies. The 9−1 −80 CH3OH line shown in Figure 3b
is expected to be a Class I maser (in the 36 GHz series;
Voronkov et al. 2012). With ALMA,Yanagida et al.(2014) observe negative excitation temperatures (implying popu-lation inversion) towards bright CH3OH 9−1−80 emission
peaks in G34.43+0.24 MM3. These 278 GHz CH3OH masers
originate in post-shocked gas associated with outflow-cloud interaction regions (Yanagida et al. 2014), akin to lower-frequency Class I CH3OH masers (e.g.Plambeck & Menten
1990; Cyganowski et al. 2009). As shown in Figure 3, in G11.92−0.61 the morphology of the CH3OH 9−1−80
emis-sion is broadly similar to that of H2CO 40,4−30,3, but the
CH3OH emission is less extended and exhibits brighter, more
compact peaks. Many of these compact peaks are spatially coincident with 44 GHz Class I CH3OH masers (Figure3b)
and are candidate 278 GHz masers, though our ALMA beam is too large to definitively establish masing based on brightness temperature: the maximum brightness tempera-ture measured towards the line of masers associated with the blueshifted MM1 outflow lobe is TB=163 K, while the
278 GHz emission spot immediately west of MM9 has a peak TB=40 K. Interestingly, the line of 44 GHz and candidate
278 GHz CH3OH masers southwest of MM1 (associated with
its blueshifted outflow lobe) is coincident with DCN and H2CO emission in our ALMA observations, suggesting that
these molecules may be tracing shocked gas in an interaction region between the outflow and the surrounding cloud. Also interestingly, while DCN is undetected towards the vast ma-jority of the newly detected millimetre continuum sources, compact DCN emission is detected∼0′′.6 south of MM3 and
∼3′′south of MM1: in both cases, the emission is spatially
coincident with weak millimetre continuum emission that did not meet our threshold of 5×the local rms for a named source, and is strongest in the 34 km s−1 channel.
In general, the ALMA H2CO and CH3OH emission
are more spatially extended and less collimated (less ”jet-like”) than the high-velocity12CO(3-2) seen with the SMA,
consistent with H2CO and CH3OH highlighting shocked
outflow-cloud interaction regions, and potentially outflow cavity walls. In this context, it is worth noting that the ALMA data trace gas much closer to the vLSR than the
SMA12CO observations. The high abundance of12CO and
the limiteduv-coverage attainable with eight antennas with the SMA mean that near the systemic velocity, low-velocity outflow emission is confused with (poorly-imaged) emission from the ambient cloud. For example, the integrated veloc-ity ranges for the main MM1 outflow in Figure2abeginat
|v−vLSR|=15 km s−1, and extend to significantly higher
velocities (|v−vLSR|>50 km s−1), while the maximum
ve-locity of the extended H2CO 40,4−30,3 emission associated
with the MM1 outflow is |v−vLSR|. 15 km s−1 in our
ALMA data. We note that the extensive emission associated with the MM1 outflow makes it difficult to assess whether new millimetre continuum sources located along the out-flow axis are themselves physically associated with H2CO or
CH3OH emission. MM5, MM11, MM14, MM15, and MM18
overlap regions of H2CO and/or CH3OH emission in the
ALMA cubes, but confusion from the MM1 outflow pre-cludes using this emission to, for example, measure their individual LSR velocities. The clumpy H2CO emission, 278
GHz CH3OH spots, and 44 GHz Class I CH3OH masers
de-tected in the southeastern region of our ALMA mosaic (e.g. south of the main MM1 outflow, and north of MM12) in-dicate that shocked gas is also present in this area. In our ALMA data, this emission is predominantly redshifted, as are the 44 GHz CH3OH masers (Cyganowski et al. 2009,
see alsoCyganowski et al. 2011a). It is unclear whether this emission represents a low-velocity, wide-angle component of the MM1 outflow, or whether it has another driving source. The most exciting result from our ALMA line observa-tions, with regard to the newly-detected millimetre contin-uum sources, is the identification of an outflow driven by MM12 in H2CO and CH3OH emission (Figure 3a,b). This
outflow was not detected in our SMA 12CO(3-2) observa-tions, likely due to sensitivity limitations. For single-pointing observations like our SMA data, the sensitivity falls off (e.g. noise increases) with distance from the pointing centre; as shown in Figure2, MM12 lies well outside the FWHP point of the SMA primary beam. As seen with ALMA, MM12’s outflow is characterised by a weaker eastern lobe and a brighter western lobe (with respect to the position of the millimetre continuum source). The dominant western lobe is detected in both H2CO and CH3OH emission, which
ex-tends from slightly blueshifted (assuming vLSR=35 km s−1,
as above) to moderately redshifted velocities, with a total velocity extent of ∼34-42 km s−1 in H
2CO 40,4−30,3 (see
also Section4.2). H2CO and CH3OH emission are also
de-tected in the vicinity of MM7, MM9, and MM13, including emission from the MM7/MM9 outflow observed in 12CO;
as noted above, the 278 GHz CH3OH emission associated
with this outflow may be masing, and is coincident with a 44 GHz Class I maser. The high-velocity MM6 outflow is most clearly seen in 12CO(3-2) emission (compare Fig. 2a
and Fig.3), though weak H2CO and CH3OH emission are
detected near the systemic velocity (|v−vLSR|.1 km s−1)
coincident with the12CO lobes.
4 DISCUSSION
4.1 Low-mass cores in a massive protocluster
We estimate the physical properties of the newly-detected millimetre sources from their ALMA 1.05 mm continuum emission using the equation
Mgas(inM⊙) =
4.79×10⁻¹⁴ R S
ν(Jy)D2(kpc)Cτdust
B(ν, Tdust)κν
,
(1) which assumes isothermal dust emission and includes a cor-rection for dust opacity,Cτdust =τdust/(1−e
−τdust), where
the dust opacity is estimated as τdust = −ln(1− TTb
dust).
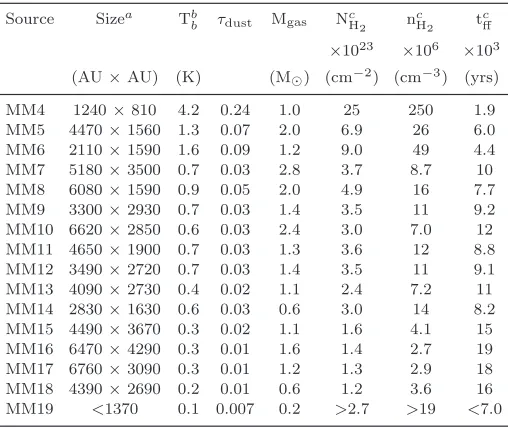
Table 3. Derived Properties of New Millimetre Continuum Sources.
Source Sizea Tb
b τdust Mgas NcH
2 n
c H2 t
c ff
×1023 ×106 ×103
(AU×AU) (K) (M⊙) (cm−2) (cm−3) (yrs)
MM4 1240×810 4.2 0.24 1.0 25 250 1.9
MM5 4470×1560 1.3 0.07 2.0 6.9 26 6.0
MM6 2110×1590 1.6 0.09 1.2 9.0 49 4.4
MM7 5180×3500 0.7 0.03 2.8 3.7 8.7 10
MM8 6080×1590 0.9 0.05 2.0 4.9 16 7.7
MM9 3300×2930 0.7 0.03 1.4 3.5 11 9.2
MM10 6620×2850 0.6 0.03 2.4 3.0 7.0 12
MM11 4650×1900 0.7 0.03 1.3 3.6 12 8.8
MM12 3490×2720 0.7 0.03 1.4 3.5 11 9.1
MM13 4090×2730 0.4 0.02 1.1 2.4 7.2 11
MM14 2830×1630 0.6 0.03 0.6 3.0 14 8.2
MM15 4490×3670 0.3 0.02 1.1 1.6 4.1 15
MM16 6470×4290 0.3 0.01 1.6 1.4 2.7 19
MM17 6760×3090 0.3 0.01 1.2 1.3 2.9 18
MM18 4390×2690 0.2 0.01 0.6 1.2 3.6 16
MM19 <1370 0.1 0.007 0.2 >2.7 >19 <7.0
a: 1/e2 diameter of fitted Gaussian (Table2) at D=3.37 kpc
(i.e. full width at the 1/e2 intensity level∼1.7×FWHM). The
radius used in calculating NH2 and nH2is half the geometric
mean of the listed major and minor axes. For MM19, which does not have a reliable fitted size, the quoted size limit is the geometric mean of the synthesised beam; the radius used in calculating NH2 and nH2 is half this value.
b: Rayleigh-Jeans brightness temperature calculated using the fitted integrated flux density and FWHM deconvolved source size from Table2. For MM19, which does not have a reliable fitted size, Tbis instead calculated from the peak intensity and synthesised beamsize.
c: Assuming spherical symmetry. The free-fall time tff is
calculated from the core density.
to be 100), Sν is the integrated flux density from Table2,
D is the distance to the source (3.37 kpc, Section 1), and
B(ν, Tdust) is the Planck function. For the newly detected
sources MM4...MM19, we adopt κ1.05mm =1.45 cm2 g−1,
for grains with thick ice mantles in regions of high gas density (interpolated from the values in column 9 of Ta-ble 1 ofOssenkopf & Henning 1994), and Tdust=20 K
(in-formed by NH3temperature measurements for an IRDC
sur-rounding the GLIMPSE EGO G35.03+0.35; Brogan et al. 2011). Derived source properties are presented in Table3, including Tb,Mgas,τdust, and H2 column and number
den-sities. The latter two quantities are estimated from Mgas
and the source size assuming spherical geometry and using a mean molecular weight per hydrogen molecule µH2=2.8
(Kauffmann et al. 2008). We note that the physical sizes pre-sented in Table3, and used in calculating NH2 and nH2, are
the 1/e2diameters of the fitted Gaussians (i.e., the full width
at the 1/e2intensity level). We use this heuristic in order to
obtain densities that represent the values in the bulk of the core volume rather than in the central region.
The VLA nondetections of MM4...MM19 at 3 and 0.9 cm (Section3.1) support the assumption that the 1.05 mm emission from these sources arises from thermal dust emis-sion. If the millimetre-wavelength emission was attributable to either optically thin free-free emission (α = −0.1) or
free-free emission from an ionised wind or jet (α ∼ 0.6), these sources would be readily detected in our VLA images (S/N>30 at 3 cm forα= 0.6). Even in the extreme case of an ionised source that remained optically thick from 0.9 cm up to 1.05 mm (e.g.α=2), the 4σVLA 0.9 cm limit would cor-respond to S1.05mm∼2.3 mJy; of the newly detected sources,
only MM19 has an integrated flux density below this level. In contrast, spectral indices α ∼3-4, as expected for dust emission, are consistent with the VLA nondetections.
The derived physical properties of the newly-detected millimetre sources in G11.92−0.61 are broadly similar to those of low-mass cores in nearby star-forming regions. The gas masses of the newly-detected cores (for our assumed dust temperature and opacity) range from 0.2-2.8 M⊙, with a
me-dian mass of 1.3 M⊙ and a median radius of∼1600 au. In
Serpens, Perseus, and Ophiuchus, low-mass prestellar and protostellar cores typically have masses of∼0.1-10 M⊙and
sizes of several thousand AU (e.g.Hogerheijde et al. 1999;
Kirk et al. 2006; Enoch et al. 2008; Simpson et al. 2008). In contrast, discs around low-mass (proto)stars generally have size scales < 500 AU and masses < a few tenths M⊙, though younger objects may have more massive discs
(e.g.Andrews et al. 2010; Enoch et al. 2011). The inferred masses and sizes of MM4..MM18, as compared to the prop-erties of low-mass core populations in well-studied nearby re-gions, lead us to conclude that the newly-discovered ALMA sources in G11.92−0.61 are most likely to be low-mass prestellar and/or protostellar cores. As discussed above and in Section3.1, it is possible that MM19–which has a point-source MIR counterpart, and for which we cannot rule out optically thick free-free as an explanation for its mil-limetre emission–may differ in nature from the other new ALMA sources, but additional deep multi-wavelength obser-vations would be required to investigate this possibility. We note that the newly detected cores in G11.92−0.61 do have somewhat higher source-averaged densities (Table 3; me-dian nH2 ∼1×10
7 cm−3) than the prestellar and
protostel-lar cores of Serpens, Perseus, and Ophiuchus:Enoch et al.
(2008) found average mean densities of a few×105 cm−3,
with the tail of the distribution extending out to ∼5×10⁶
cm−3. However, the densities fromEnoch et al. (2008) are
also averaged over a larger sizescale, of 10,000 au.
The lack of single-dish bolometer observations at our ALMA observing frequency precludes a straightforward cal-culation of the percentage of the total flux density recovered with ALMA. The alternative, calculating the percentage of the clumpmass attributable to compact cores, entails con-siderable uncertainties due to the need to assume opacities and dust temperatures at both the core and the clump scale. In addition, both the ATLASGAL and JCMT SCUBA 850
µm bandpasses include the 12CO(3-2) line, which can
con-tribute significantly to the total flux density measured with (sub)millimetre bolometers in regions with outflows (e.g.
∼20-30% for SCUBA 850µm; Hatchell & Dunham 2009). We measure an integrated flux density of 11.0±0.3 Jy from the ATLASGAL 870µm map2 (Schuller et al. 2009) within
the 30% power level of our ALMA mosaic. (This value is
in-2 Obtained from the ATLASGAL database server at
0.00 0.05 0.10 0.15 0.20 0.25 0.30 Projected distance from MM1 (pc)
0.0 0.5 1.0 1.5 2.0 2.5 3.0
Core mass (M
⊙
[image:11.595.51.264.119.333.2])
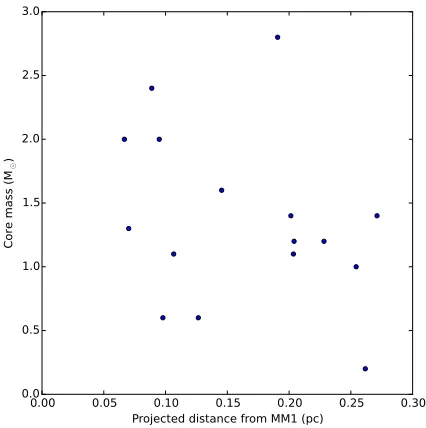
Figure 4.Core mass (from Table3) vs. projected distance from MM1 for the newly-detected millimetre sources MM4..MM19; the median offset from MM1 is∼0.17 pc (Section4.1).
termediate between those in the two ATLASGAL catalogs: 9.84 Jy in theCsengeri et al. 2014Gaussclumps catalog, op-timised for small-scale embedded structures, and 38.83 Jy in the Contreras et al. 2013 SExtractor catalog optimised for larger-scale clump and cloud structures.) Forκ870µm= 1.85
cm2 g−1 (as in Schuller et al. 2009) and T
dust =20 K, and
neglecting line contamination, the measured ATLASGAL flux density equates to a mass reservoir of∼700 M⊙within
the∼0.7 pc diameter of our ALMA mosaic. The total mass of the newly-detected ALMA sources MM4..MM19 is ∼22 M⊙, or ∼3% of the ATLASGAL clump mass (these values
increase to∼33 M⊙and∼5% if we instead assume Tdust=15
K, closer to the NH3 temperatures measured in quiescent
regions of the IRDC G11.11-0.12 P6 byWang et al. 2014). Estimates of the total mass in compact cores—e.g. includ-ing the previously-known sources MM1, MM2, and MM3– depend on the mass estimates for these sources, which are quite sensitive to the opacity correction term in equation1
(in particular for MM2, see also Table 2 ofCyganowski et al. 2014). While a detailed analysis of the massive sources is beyond the scope of this paper (see also Ilee et al. 2016;
Cyganowski et al. 2014), we conservatively estimate that MM1, MM2, and MM3 together account for ∼5-10% of the ATLASGAL clump mass. It is interesting that, at sub-arcsecond resolution, the fraction of the clump mass resolved into high-mass cores is of the same order of magnitude as that resolved into low-mass cores (indeed, within a factor of
∼2-3), and that all compact cores detected to date account for.15% of the total clump-scale mass reservoir. There may, of course, be additional low-mass cores below the sensitivity limit of our ALMA observations; the rms noise level varies significantly across the map (Section2.1), corresponding to a 5σmass sensitivity for Tdust=20 K that ranges from∼0.1
M⊙(in the vicinity of MM19) to∼0.3 M⊙near the edge of
the mosaic, and in the most dynamic-range-limited regions
0.0 0.1 0.2 0.3 0.4 0.5 Projected separation (pc)
0 5 10 15 20
Number of sour
ce pairs
Figure 5.Distribution of projected separations for all unique millimetre source pairs in G11.92−0.61, including the massive protocluster members MM1..MM3.
near the high-mass cores (the corresponding 5σmass sensi-tivities are∼0.2-0.4 M⊙ for Tdust=15 K, and∼0.4-0.8 M⊙
for Tdust=10 K).
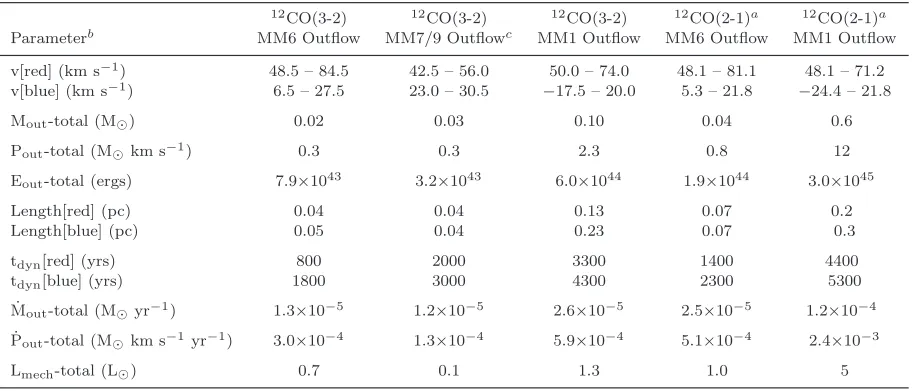
[image:11.595.314.522.121.331.2]Table 4.Outflow Properties:12CO.
12CO(3-2) 12CO(3-2) 12CO(3-2) 12CO(2-1)a 12CO(2-1)a Parameterb MM6 Outflow MM7/9 Outflowc MM1 Outflow MM6 Outflow MM1 Outflow v[red] (km s−1) 48.5 – 84.5 42.5 – 56.0 50.0 – 74.0 48.1 – 81.1 48.1 – 71.2
v[blue] (km s−1) 6.5 – 27.5 23.0 – 30.5 −17.5 – 20.0 5.3 – 21.8 −24.4 – 21.8
Mout-total (M⊙) 0.02 0.03 0.10 0.04 0.6
Pout-total (M⊙km s−1) 0.3 0.3 2.3 0.8 12
Eout-total (ergs) 7.9×1043 3.2×1043 6.0×1044 1.9×1044 3.0×1045
Length[red] (pc) 0.04 0.04 0.13 0.07 0.2
Length[blue] (pc) 0.05 0.04 0.23 0.07 0.3
tdyn[red] (yrs) 800 2000 3300 1400 4400
tdyn[blue] (yrs) 1800 3000 4300 2300 5300
˙
Mout-total (M⊙yr−1) 1.3×10⁻⁵ 1.2×10⁻⁵ 2.6×10⁻⁵ 2.5×10⁻⁵ 1.2×10⁻⁴
˙
Pout-total (M⊙km s−1yr−1) 3.0×10⁻⁴ 1.3×10⁻⁴ 5.9×10⁻⁴ 5.1×10⁻⁴ 2.4×10⁻³
Lmech-total (L⊙) 0.7 0.1 1.3 1.0 5
a: MM1 outflow: fromCyganowski et al.(2011a), rescaled for D=3.37 kpc. MM6 outflow: properties estimated from the
12CO(2-1) data presented inCyganowski et al.(2011a). b: ”Total” quantities are the sum of the red and blue lobes.
c: Lengths measured from MM9.
4.2 Outflow properties
Molecular outflows are driven by protostars of all masses during their formation processes, and so are ubiquitous in star-forming regions (e.g. Richer et al. 2000; Zhang et al. 2001; Arce et al. 2007; Frank et al. 2014). The observa-tional evidence for correlations, over many orders of mag-nitude, between outflow properties and those of the driv-ing source–primarily from large-scale surveys of protostellar outflows with single-dish telescopes (e.g. Cabrit & Bertout 1992; Shepherd & Churchwell 1996; Beuther et al. 2002a;
Wu et al. 2004; Maud et al. 2015b)–suggests that measur-ing outflow properties may provide an additional means of investigating the nature of the driving protostar.
To this end, we estimate the properties of the outflows driven by MM6, MM7/9, and MM12 from the SMA12
CO(3-2) and the ALMA H2CO 40,4−30,3 data, using an approach
similar to that of Cyganowski et al.(2011a). For each out-flow lobe, we define a mask based on the 3σcontour in the integrated intensity image (moment 0 map) of that lobe. The emission within this mask is then measured in each ve-locity channel that contributes to the moment 0 map, and the gas mass (assuming optically thin emission) calculated using (following equation B2 ofMangum & Shirley 2015)
Mout=
4.788×3c2×1.36m
H2×Q(Tex)e
Eupper
Tex D2RSνdv
16π3ν3µ2Sχ
(2)
where Mout is the gas mass (in M⊙), Q(Tex) is the
parti-tion funcparti-tion, Tex is the (assumed) excitation temperature
(in K), D is the source distance (in kpc), Sν is the line flux
density measured as described above (in Jy), dv is the ve-locity channel width in km s−1, χis the (assumed)
abun-dance of the observed molecule with respect to H2, and a
mean gas atomic weight of 1.36 is assumed (Qiu et al. 2009;
Cyganowski et al. 2011a). The upper energy level (Eupper,
in K), frequency (ν, in GHz), and line strength (µ2S, in
debye2) are properties of the observed molecular transi-tion. We adopt Tex=30 K,χCO=10−4 (e.g.Dunham et al.
2014, and references therein), andχH2CO=10
−8, noting that
since shocks enhance the H2CO abundance, it varies as a
function of velocity and of position within individual out-flows (e.g.Tafalla et al. 2010, van Dishoeck & Blake 1998;
Bachiller & P´erez Guti´errez 1997, for example, find abun-dances from 4×10⁻⁹
to 6×10⁻⁷
in the L1157 outflow). From the Cologne Database for Molecular Spectroscopy (CDMS) entries in the Splatalogue3 spectral line database (Remijan 2010), µ2S =0.03631 debye2 and µ2S =21.74159 debye2
for 12CO(3-2) and H
2CO 40,4−30,3, respectively;
interpo-lating from the partition function values in the CDMS (M¨uller et al. 2001,2005), we useQ(30K) = 11.19 for12CO
andQ(30K) = 95.1 for H2CO.
Tables4and 5present estimates for the outflow proper-ties derived from the SMA12CO(3-2) and the ALMA H2CO
40,4−30,3 data, respectively. The reported mass is the sum
of the mass in all contributing velocity channels (listed as v[red] and v[blue] for redshifted and blueshifted lobes, re-spectively) and the momentum and energy are calculated (following e.g.Cyganowski et al. 2011a;Qiu et al. 2009) as
Pout=
X
i
Mouti ∆v (3)
and
Eout=
1 2
X
i
Mouti (∆v) 2
(4)
where Mi
out is the mass in a given velocity channel and
∆v=|vchannel−vLSR|. In the absence of compact molecular
line emission associated with MM6, MM7, MM9, and MM12 with which to measure their LSR velocities (Section3.2),
we adoptvlsr=35 km s−1for all of our outflow analysis. For
each outflow lobe, we estimate the dynamical timescale as
tdyn = Loutflow/vmax, where Loutflow is the outflow length
(measured from the driving millimetre continuum source) andvmaxis the maximum velocity of the blue- or red-shifted
outflow gas. Using these dynamical timescales, we then esti-mate the timescale-dependent properties ˙Mout(mass outflow
rate, Mout/tdyn), ˙Pout(momentum outflow rate, Pout/tdyn),
and Lmech (mechanical luminosity, Eout/tdyn). Rather than
potentially overcorrect our estimates of outflow dynami-cal properties (e.g. Downes & Cabrit 2007; Dunham et al. 2014), the values in Tables 4 and 5are not corrected for inclination. For all properties listed in Tables4and 5, the outflow ”total” is the sum of estimates for the red- and blue-shifted outflow lobes.
We emphasise that our estimates of outflow properties– in particular for the larger-scale MM1 outflow–are affected by the spatial filtering of the interferometers, the confusion of outflow with cloud emission near the systemic velocity (which dictates the velocity ranges over which outflow prop-erties can be integrated), and the assumption of optically thin emission. All of these factors act to make our esti-mated outflow masses underestimates (see also discussion inCyganowski et al. 2011a;Dunham et al. 2014). Addition-ally, in a study of outflows driven by isolated low-mass pro-tostars, Dunham et al. (2014) found that for a given out-flow, the mass and dynamical properties calculated from
12CO(3-2) emission were, on average, an order of
magni-tude lower than if the same properties were calculated from
12CO(2-1). To investigate this effect in our data, Table 4
also presents the estimated properties of the MM1 outflow as derived from 12CO(2-1) SMA observations (∼2′′.4
reso-lution; Cyganowski et al. 2011a, rescaled to D=3.37 kpc). In addition, we reanalysed the 12CO(2-1) data to extract
estimated properties for the MM6 outflow, which was de-tected (e.g. Fig. 6a ofCyganowski et al. 2011a) but not re-solved in these observations. Comparison of the estimates presented in Table4shows that the differences in the out-flow properties estimated from the 2′′.4 resolution12CO(2-1)
and the 0.′′76 resolution12CO(3-2) data are greatest for the
MM1 outflow (with the12CO(2-1) estimates being 6×, 4.6×,
and 4×greater for Mout, ˙Mout, and ˙Pout, respectively). This
is as expected: compared to the outflows from MM6 and MM7/MM9, the MM1 outflow is significantly more spatially extended (and so susceptible to spatial filtering), and is con-fused with cloud emission over a wider velocity range around the vLSR(leading to missing more of the mass, momentum,
and energy associated with outflow gas at near-systemic velocities, see e.g. Dunham et al. 2014; Maury et al. 2009;
Offner et al. 2011; van der Marel et al. 2013). In contrast, the12CO(2-1) and12CO(3-2)-derived M
out, ˙Mout, and ˙Pout
for the MM6 outflow differ by a factor of.2.
The fact that the MM7/MM9 outflow is detected in both 12CO(3-2) and H
2CO 40,4−30,3 provides a means of
assessing whether these two tracers give comparable esti-mates of outflow properties for compact low-mass flows in G11.92−0.61. (We do not use H2CO to calculate properties
for the MM1 outflow due to the morphological and kinematic evidence that, for this massive outflow, the H2CO emission
is dominated by shocked interface regions rather than the high-velocity jet seen in12CO; Section3.2.) Comparing the
[image:13.595.306.556.123.311.2]estimates of the MM7/9 outflow properties derived from
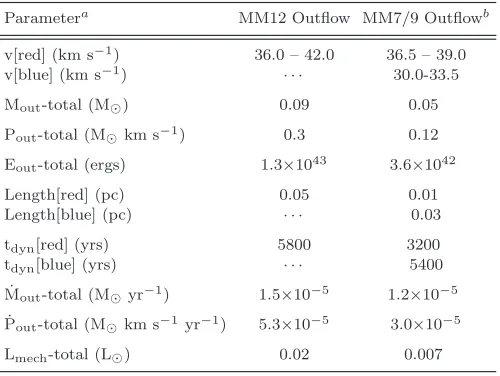
Table 5.Outflow Properties: H2CO.
Parametera MM12 Outflow MM7/9 Outflowb
v[red] (km s−1) 36.0 – 42.0 36.5 – 39.0
v[blue] (km s−1) · · · 30.0-33.5
Mout-total (M⊙) 0.09 0.05
Pout-total (M⊙km s−1) 0.3 0.12
Eout-total (ergs) 1.3×1043 3.6×1042
Length[red] (pc) 0.05 0.01
Length[blue] (pc) · · · 0.03
tdyn[red] (yrs) 5800 3200
tdyn[blue] (yrs) · · · 5400
˙
Mout-total (M⊙yr−1) 1.5×10⁻⁵ 1.2×10⁻⁵
˙
Pout-total (M⊙km s−1 yr−1) 5.3×10⁻⁵ 3.0×10⁻⁵
Lmech-total (L⊙) 0.02 0.007
a: ”Total” quantities are the sum of the red and blue lobes.
b: Lengths measured from MM9.
12CO(3-2) (Table4) and H
2CO 40,4−30,3 (Table5), we find
remarkably good agreement (within a factor of 2) for the total outflow mass and mass outflow rate, considering the uncertainty in the H2CO abundance and the different
veloc-ity ranges probed by the two species. For ˙Pout and Lmech,
the H2CO-based estimates are considerably lower, consistent
with the stronger dependence of these properties on the ve-locity of the outflowing gas (∆v, as defined above) and with H2CO tracing much more moderate velocities (e.g. closer to
thevLSR) than12CO.
Considering the (large) uncertainties associated with different resolutions, spatial filtering, and molecular trac-ers, the properties we estimate for the MM6, MM7/9, and MM12 outflows are reasonably consistent with the ranges found in surveys of outflows from low-mass (proto)stars (e.g.
Bontemps et al. 1996;Arce & Sargent 2006;Dunham et al. 2014). More tellingly, the estimated properties of the MM6, MM7/9, and MM12 outflows are fairly similar to each other, but distinct from those of the massive MM1 outflow. The MM6, MM7/9, and MM12 outflows have outflow masses of a few hundredths M⊙, momenta of a few tenths M⊙ km
s−1, lengthscales of.0.05 pc (for each lobe), mass outflow
rates of∼10−5 M
⊙ yr−1, and momentum outflow rates of
a few ×10−5 to a few ×10−4 M
⊙ km s−1 yr−1.
Compar-ing the properties of the MM6 and MM1 outflows derived from12CO(2-1)–of the available datasets, the one in which
the properties of the MM1 outflow will be least severely underestimated–the size (length), mass, momentum, and en-ergy of the MM1 outflow are larger by more than an order of magnitude, and ˙Mout, ˙Pout, and Lmech are larger by
fac-tors of∼5. As discussed above, the MM1 outflow is expected to be most affected by all of the factors that contribute to underestimating outflow properties, so the true differential between the MM1 outflow and those from MM6, MM7/9, and MM12 is likely even greater.