OLED Microdisplays Control Cell Behavior through Optogenetics
Malte C. Gather
SUPA, School of Physics and Astronomy, University of St Andrews, North Haugh, St Andrews, KY16 9SS, United Kingdom
Abstract
OLED microdisplays are introduced as a microscopic illumination platform for cell biology. The µm-scale dimensions of each pixel and the µm-thin encapsulation enable controlled light exposure of individual live cells. This breakthrough is facilitated by recent progress in ultrathin metal electrodes and by quality control via high resolution hyperspectral imaging.
Introduction
For general lighting and for parts of the display industry, there is a drive towards larger and larger organic light emitting diodes (OLEDs). By contrast, displays for mobile applications and for wearable devices require OLED pixels with ever smaller dimensions. OLED microdisplays represent the culmination of this process. By integration with complementary metal-oxide semiconductor (CMOS) backplane driver electronics, it has become possible to produce arrays of >105 individually addressable OLEDs with each OLED pixel measuring well under
10 × 10 µm2. The primary use of these devices so far has been in ‘near eye’ applications, i.e. digital viewfinders,
virtual and augmented reality, security and defense, etc. There has also been work towards using microdisplays in ultra-compact video projectors.
Interestingly, the pixel size in OLED microdisplays has now reached dimensions that are similar to the size of the cells in our body and in many other organisms. Therefore, there is an opportunity to use OLED microdisplay-technology for controlled illumination and light delivery in the life sciences, e.g. to control and manipulate the behavior of cells, to perform lens-free imaging, or potentially also for local therapy and treatment. An area of biology where this is of particular interest is the quickly growing field of optogenetics.
The neurons in our brain transmit and process electrochemical signals in a highly sophisticated manner. They form synapses— connection points at which signals are transmitted from one neuron to another. The study of neurons allows insight into the function of the human brain, informs our understanding of neurological diseases, and inspires the development of artificial intelligence. Controlling the function of neurons at high speed and with high spatial resolution is a long standing goal in biology. With the recent development of optogenetics it has become possible to control cell behaviour by light, both in cultured cells and in live animals [1]. Today, scientists can perform optogenetics on freely moving transgenic mice and these experiments help to gain insight into the behavior and function of complex brains.
In order to render neurons sensitive to light, genetic material coding for light-sensitive ion channels that are naturally expressed in certain organisms is inserted into the cells. This allows controlling ion channels and pumps using light as activator, which provides both strongly localized excitation and high temporal resolution and thus facilitates the investigation of selected neurons without altering the behaviour of nearby cells [2].
So far, the light sources used in optogenetics include arc lamps, LEDs and lasers [3]. While a number of light sources offer good time resolution, high spatial resolution for switching between neighboring target cells remains difficult. Some spatial control can be obtained by using fibers mounted onto micromanipulators or by other moving optical elements. In addition, stimulation at multiple sites has also been achieved with bundles of optical fibers and with µLED arrays.[4,5] However, only small numbers of separate excitation spots were demonstrated and the resolution of both approaches may be fundamentally limited [6]. In addition, fabrication of the µLED arrays requires relatively complex semiconductor technology.
movement can be controlled by blue light. C. reinhardtii is also the origin of most of the photoreceptors used in optogenetics today [7]. Our ability to control the behaviour of C. reinhardtii therefore indicates that the OLED platform should also be capable of controlling neuronal cells via optogenetics. Further details of these experiments are also described in [8].
We also report on a new optical inspection system that allows hyperspectral imaging of the local reflectance of OLED microdisplays—and potentially of other electro-optical devices. The system is fully integrated with an optical microscope and can thus provide sub-µm spatial resolution and up to square-centimetre sized fields of view (with larger areas accessible by stitching of images). The system provides calibrated absolute reflectance measurements across the entire visible and parts of the near infrared spectrum. We also show that local angle-resolved measurements of the reflectance or emission spectrum can be obtained using a Fourier-plane imaging modality.
Description of OLED microdisplays
OLED microdisplay were obtained from Fraunhofer COMEDD, Dresden, Germany. The devices contained a CMOS backplane, a blue-emitting pin OLED stack and were encapsulated by thin-film encapsulation using a VITEX system. No further encapsulation was applied. This is important to facilitate direct optical contact—i.e. without need for an imaging system—between the OLEDs and cells applied on top of the display. The high quality of the thin-film encapsulation allows immersion of the entire active area of the micro-display into water or cell-culture nutrient medium for several days without loss of display function [8].
Each display contained 320x720 OLED pixels with a size of 6 µm × 9 µm each. The pixel displayed pattern was input to the display be a custom HDMI interface and was refreshed at a frame rate of 60 or 120 Hz. OLEDs were driven at different brightness levels by changing the grey scale value of the input video signal.
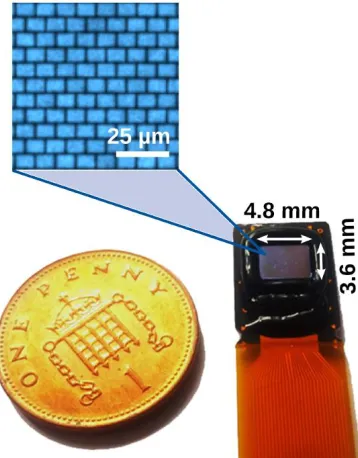
Figure 1 shows a photograph of the complete OLED microdisplay with flex-cable connector and an epoxy rim applied to the edges of the display for retaining liquid on the active area. The inset shows an image of the display under the microscope with all pixels operated simultaneously.
Hyperspectral reflectance and emission microscopy of microdisplays
To check the homogeneity of the CMOS substrate, the pin OLED stack and the thin-film encapsulation, a number of optical inspections were performed with a newly developed hyperspectral wide-field imaging system. In this approach the sample is illuminated by a tuneable light source that is coupled to an optical microscope. The reflected light is collected through the same microscope objective and imaged by a scientific CMOS camera. In this way a stack of reflectance images in the 400 to 800nm spectral range and with 1 nm spectral resolution can be recorded within less than 20 s. This data contains local reflectance spectra for each of the over 4×106 pixels of the
CMOS detector.
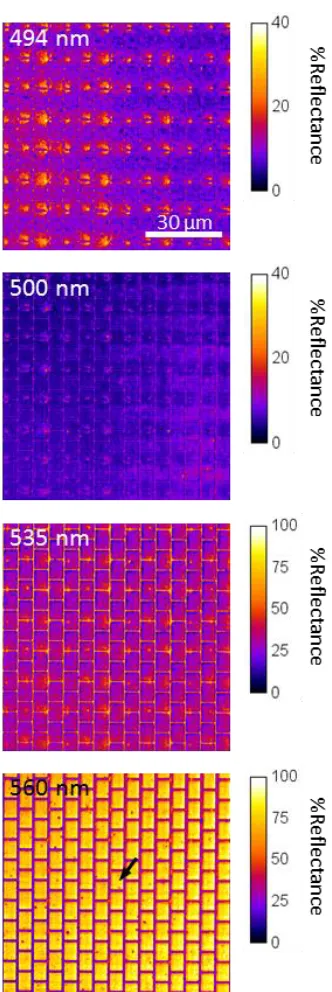
Figure 2 shows a series of representative reflectance images taken for the microdisplays used in this work. Overall, the reflectance of the display is very homogeneous, indicating that the organic layers have homogeneous thickness and no major defects are present. A number of small spots with low reflectance are clearly visible and these may indicate local degradation. (The particular display investigated here was used and stored under ambient conditions for several months. Note that the display is only protected by the VITEX thin film encapsulation.)
For 500 nm wavelength of illumination, the display shows very weak reflectance indicating that the cavity length of this particular display is tuned to this spectral range which allows good coupling of the emission from the blue OLED stack (FWHM of emission, 460-510 nm) to far-field modes. Looking just off-resonance, at 494 nm, one sees that the reflectance varies slightly across the display area; these variations are periodic and could be associated with slight thickness variations in the CMOS backplane, e.g. due to VIAs. At 535 nm illumination wavelength, the edges of each pixel show strong reflectance whereas the pixels themselves appear dark. This indicates that, at this wavelength, the OLED microcavity across the pixel area is still near resonance, whereas rims or mesas defining the edge of anode contact area put the cavity off-resonance at the edges of each the pixel. The contrast inverts at around 560 nm, i.e. pixels are now bright and the areas in between appear in black.
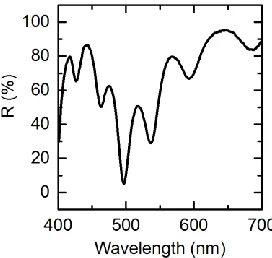
This data illustrates again that the microcavity of the OLEDs in the display is tuned for the spectral range just under 500 nm, thus coinciding with the blue emission from the stack. There are a number of further dips in the reflectance spectrum and these are attributed to interference effects in the various other layers of the display. Generally, reflectance is slightly weaker for shorter wavelengths, presumably due to some absorption induced by the organic material.
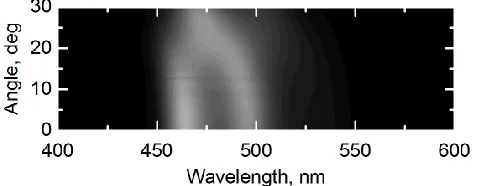
By switching the hyperspectral imaging system to Fourier-plane mode, it is possible to look at the change in reflectance or emission from the display over a range of angles. To illustrate this, Figure 4 shows an angle dependent emission spectrum of the microdisplay. Importantly, this data has been acquired with a single exposure of the CCD camera mounted to the spectrograph. Despite the fact that the top-emitting contact is made of a semitransparent silver layer, the angular shift of emission for this device is relatively small.
Controlling locomotion of algae cells
Next, some results on the light-based control of the locomotion of C. reinhardtii are presented. In this work the algae strains CC125 and CC2894 were investigated. Cells were obtained from the Chlamydomonas Resource Center (University of Minnesota, St. Paul, USA) and cultured in standard Sueoka`s high salt medium [10]. Prior to the experiments, cultures were kept at 26°C, shaken at 215 rpm on a rotary shaker and illuminated by a 60 W daylight bulb.
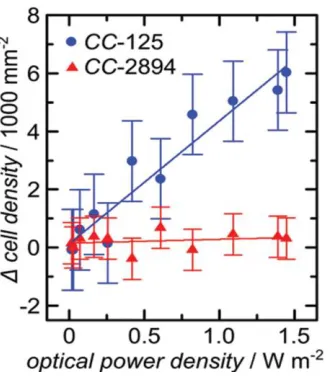
To investigate the influence of blue light generated by the OLED display on C. reinhardtii, the solution containing the cells was pipetted directly onto the display surface, i.e. only the thin film encapsulation separated the OLEDs from the aqueous environment of the cells. Cell movement of CC125 and CC2894 was monitored for different brightness levels and the response to the light was measured as a change in local cell density after 2 min of illumination with the display. Figure 5 shows microscopic images of the blue emission from the display and of the algae cells accumulating on the display directly after a rectangle of pixels has been turned on and following 2 min of continuous illumination.
By analysing the change in cell density (in the area of the display that was turned on) for different brightness levels, we determined distinct differences in the phototactic behaviour of the three strains (Fig. 6). CC125 showed a linear increase in cell density with optical power density and thus exhibits positive phototaxis. As a control, we used the strain CC2894, known to show only weak phototaxis [9]. For this stain, we did not detect a statistically significant change in cell density across the whole range of optical power densities applied.
It was also possible to affect the swimming direction of C. reinhardtii in real time. Moving a square of active pixels around on the display surface led to the algae following the light (Fig. 7). This may enable further investigations of the dynamics of phototaxis.
Conclusion
In conclusion, it was shown that OLED microdisplays provide sufficient brightness and stability to control the behavior of single live cells. Thin film encapsulation is sufficiently robust to facilitate direct contact of the encapsulated display with the aqueous cell culture medium. This avoids any requirement for imaging optics and thus allows extremely compact configurations and promises future biointegration of OLEDs for optical control in vivo.
In addition, a new hyperspectral imaging modality to characterize the local optical properties of OLED microdisplays and other electrooptic devices has been described. The method provides quantitative data on local reflectance using a fast wide-field imaging approach. Local angle resolved emission or reflectance spectra were also obtained. Employing this technique, it was shown that the organic layers and the thin film encapsulation on top of the opaque CMOS backplane have excellent thickness homogeneity.
Acknowledgements
M.C. Gather acknowledges funding from the Marie Curie Career Integration Grant (PCIG12-GA-2012-334407), from the Scottish Funding Council (via SUPA), and from RS Macdonald Charitable Trust.
References
[1] K. Deisseroth, Sci. Am. 48 (2010).
[3] A.M. Packer, B. Roska, and M. Häusser, Nat. Neurosci. 16, 805 (2013).
[4] Y. Hayashi, Y. Tagawa, S. Yawata, S. Nakanishi, and K. Funabiki, Eur. J. Neurosci. 36, 2722 (2012).
[5] N. Grossman, V. Poher, M.S. Grubb, G.T. Kennedy, K. Nikolic, B. McGovern, R. Berlinguer Palmini, Z. Gong, E.M. Drakakis, M. Neil, M.D. Dawson, J. Burrone, and P. Degenaar, J. Neural Eng. 7, 16004 (2010).
[6] N. McAlinden, E. Gu, M.D. Dawson, S. Sakata, and K. Mathieson, Front. Neural Circuits 9, 1 (2015).
[7] P. Kröger and P. Hegemann, “Photophobic responses and phototaxis in Chlamydomonas are triggered by a single rhodopsin photoreceptor,” FEBS Letters 341, 5–9 (1994).
[8] A. Steude, M. Jahnel, M. Thomschke, M. Schober, M.C. Gather, “Controlling the movement of single live cells with high density arrays of microscopic OLEDs,” Advanced Materials 27, 7657-7661 (2015).
[9] N. Okita, “Phototactic activity in Chlamydomonas ’non-phototactic’ mutants deficient in Ca2+-dependent control of flagellar dominance or in inner-arm dynein,” Journal of Cell Science 118, 529–537 (2005).
Figure 3. Local reflectance spectrum for a 0.5 × 0.5 µm2 area of the microdisplay at the position marked in Fig. 2.
[image:7.612.232.368.68.197.2]