DOI: 10.4236/wjet.2019.72B002 May 17, 2019 10 World Journal of Engineering and Technology
Progressive Collapse
Yanglin Gong, Chen Zhang, Jian Deng
Department of Civil Engineering, Lakehead University, Thunder Bay, Canada
Abstract
This paper presented a methodology for the analysis and design of steel con-nections under a double-span connection within the context of preventing progressive collapse. First, various connection models were described and their pros and cons were provided. Then, the load-displacement characteris-tics of a component-based spring model were described. Thirdly, an experi-mental study on the behaviors of shear tab connections under tension was presented. The main sources of the deformation capacity of the shear tab connections were identified. Finally, a design example of a shear tab connec-tion was provided to illustrate the methodology.
Keywords
Steel, Steel Connections, Shear Tab Connection, Progressive Collapse, Connection Robustness
1. Introduction
Progressive collapse is referred to a localized failure, due to an unexpected event such as an accidental blast, causes the failure of adjoining structural elements, which in turn spread further resulting in the collapse of the entire structure or a disproportionally large part of it. Since the collapse of World Trade Centre twin towers in 2001, structural design to resist progressive collapse has garnered tre-mendous attentions from civil engineering community. The DoD guideline [1] was the very first rigorous criteria on the design of buildings to resist progressive collapse. A recent Canadian standard [2] also reflected many new developments in this field. Both direct and indirect approaches to resist progressive collapse have been outlined in these guidelines with various levels of details and effec-tiveness.
The alternate load path method, a direct design approach where in a
build-How to cite this paper: Gong, Y.L., Zhang, C. and Deng, J. (2019) Analysis of Steel Connections to Resist Progressive Collaps. World Journal of Engineering and Tech-nology, 7, 10-20.
https://doi.org/10.4236/wjet.2019.72B002
DOI: 10.4236/wjet.2019.72B002 11 World Journal of Engineering and Technology
ing’s integrity and robustness are assessed under a condition of instantaneous loss of a column or a wall, has become a commonplace in the design of buildings to resist progressive collapse. In this methodology, a building is mainly subjected to service gravitational loads while one of the columns is assumed to be removed (Figure 1). The design objective is to ensure that the building structure is capa-ble of bridging the resulting doucapa-ble-span condition in order to arrest the local failure.
Traditionally, steel connections are designed for a shear force only (for a sim-ple connection) or a shear force plus a bending moment (for a semirigid or rigid connection). The rotational ductility demand for the connections is not greater than 0.03 radians under gravity loads [3] and not greater than 0.05 radians under earthquake events [4]. However, under a double-span condition, the primary strength action on the affected connections is catenary tensile force (as shown in Figure 1) and the moment and shear actions become secondary, while the rota-tional ductility demand on the connections could reach as large as 0.10 radians [5] [6]. In particular, a shear or semi-rigid connection is usually the weakest link in the loading path of bridging the removed column. Thus, the robustness de-sign of the connections plays a critical role to the overall integrity of the struc-ture. Gong [6] was among the first to point out that the supply of connection ductility is at the core of connection robustness design. Gong [6] further sug-gested that the capacity design principle, a method commonly adopted in seis-mic design, should be applied to connection detailing for ductility supply.
This paper is the continued efforts by the authors on the nonlinear modelling of connections in the context of robustness design of steel structures. First, this paper presents a general component-based model for steel connections. Next, an experimental and numerical study on shear tab connections are provided as an example on how to obtain the strength and stiffness of connection components. Finally, an analysis and design example is given on a shear tab connection under the removal of a middle column.
2. Analytical Models of a Steel Connection
A simple or semi-rigid steel connection will be loaded well into its inelastic stage under a double-span condition. On the one hand, as the weakest link in the load path, the steel connection could be loaded to a failure mode of material rupture. On the other hand, in order to facilitate the development of a catenary action among the bridging beams, it is necessary to design the steel connection such that it is capable of undergoing large inelastic deformation before failure. Thus, a connection model must capture the plastic behaviors of the connection.
DOI: 10.4236/wjet.2019.72B002 12 World Journal of Engineering and Technology
Figure 1. A double-span condition.
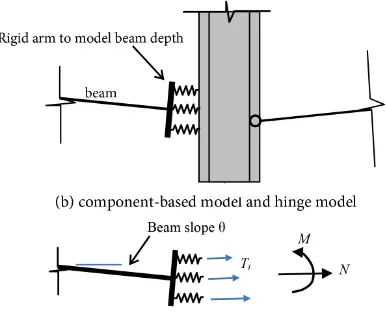
between the rotational and axial deformations. The second one is called compo-nent-based model, as shown by the left SIDE of the middle column in Figure 2(b), in which a connection is represented by a set of related springs. Each spring captures individual behavior of a connection component, such as a bolt, a beam web, an angle, a hole bearing or a combination of them. The third type is a finite element model.
The hinge model is the easiest one to use with the least computational efforts, but it also possesses the least accuracy. A component-based model is more labo-rious than a hinge model, but it is still far simpler to use than a finite element model. The component-based model will be adopted in this study, and the finite element model will be used to aid the development of the component-based model.
2.1. Component-Based Connection Model
DOI: 10.4236/wjet.2019.72B002 13 World Journal of Engineering and Technology
Figure 2. Modelling of steel connections.
experience axial deformation and thus develop axial force, as illustrated by force
Ti in Figure 2(c). The resultants of these individual spring forces are the
con-nection axial force N and moment M (also see Figure 1(b)), i.e., the interaction between N and M are accounted for. Note that the connection shear force V is not shown in Figure 2 as the shear displacement is usually secondary. But the shear displacement can be easily included into the connection model by adding shear spring in vertical direction if necessary. Because the parallel springs are corresponding to the bolts over the length of the tab (or over the depth of the beam), such a component-based model is capable of capturing an arch action, if existing, within the bridging beams. On the contrary, a hinge connection model is unable to capture arch action due to its zero dimension in vertical direction.
2.2. Component Spring Model
In Section 2.1, a connection is modeled by several parallel uniaxial springs. A priori knowledge about the mechanical properties of the spring, i.e., the rela-tionship between its deformation Δ and its force T, is needed for the analysis of the steel connection.
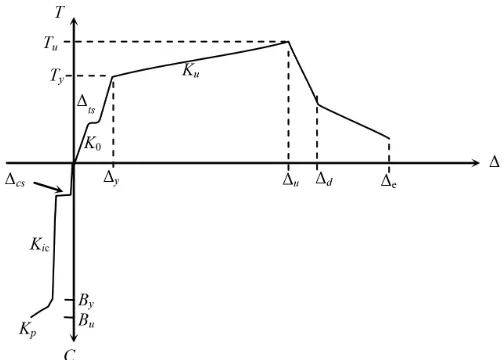
In general, apiece-wise linear curve, as shown in Figure 3, can be adopted for the T-Δ curve, where Tyand Tu are the tensile yielding and the ultimate strength
of the spring, respectively, with Δy and Δubeing their corresponding tensile
DOI: 10.4236/wjet.2019.72B002 14 World Journal of Engineering and Technology
Figure 3. Load versus deformation of a nonlinear spring.
of material rupture, a stage is typically ignored in conventional structural design but could still play an important role in the structural bridging under a double-span condition. The ratio of Δu/Δy indicates the inelastic axial ductility of the spring.
Δtsis the bolt slippage deformation for bolted connections. A negative value of Δ
in Figure 3 represents a compressive deformation of the spring. Δcs denotes bolt
slippage under the compressive load. A compressive C-Δ curve (T is replaced by compression C in Figure 3) is necessary if the arch action is of concern. Nota-tions By and Bu are yielding and ultimate compressive strengths, respectively.
Notation K denote tangential stiffness at various force level.
The evaluation of T-Δ curve can be tedious due to its nonlinear nature. Stan-dards such as [1] [2] provide empirical curves for some types of steel connec-tions. For this paper, we use shear tab connection as the example to demonstrate how to obtain such a curve.
2.3. Shear Tab Connections
DOI: 10.4236/wjet.2019.72B002 15 World Journal of Engineering and Technology
Table 1. Shear tab connection speciemns.
Specimen ID Deformations Table Column Head Δy, Δu, Δd (mm)
Tensile strengths
Ty, Tu, Td (kN) Failure mode
T95-45-1a, 1b 2.0, 11.5, 18.3 350, 430, 200 Shear of hole edge T95-57-1a, 1b 2.5, 14.2, 17.0 375, 488, 250 Tension rupture at net section T95-45-2a, 2b 1.7, 5.8, 8.8 425, 480, 150 Tension rupture at inner net section T127-45-1a, 1b 1.9, 9.8, 17.0 440, 535, 107 Shear of hole edge T127-45-2a, 2b 2.3, 5.5, 9.0 570, 638, 200 Tension rupture at inner net section Note: the notations of deformations and strengths are given in Figure 3. Residual strength Td is defined as
[image:6.595.207.543.88.215.2]the strength corresponding to Δd. The bolt slippage Δts were excluded from Δy, Δu and Δd in this table.
Figure 4. Design of shear tab specimens.
materials were CSA/G40.21 300 W steel, and the measured strengths were: yield strength Fy= 376 MPa and ultimate tensile strength Fu= 490 MPa for 9.5 mm
thick tab; Fy= 387 MPa and Fu= 495 MPa for 12.7 mm thick tab. The sizes of the
welds and bolts were chosen based on a capacity design principle such that rup-ture failures of the welds and bolts would not occur during the test.
[image:6.595.242.510.258.537.2]DOI: 10.4236/wjet.2019.72B002 16 World Journal of Engineering and Technology
Figure 5. Failure modes of shear tab specimens under tensile load.
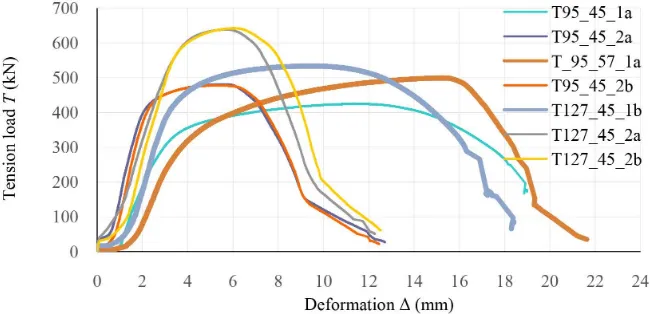
Figure 6. Load versus deformation curves of the specimens.
specimens experienced tension rupture at the net section of boltline. A careful examination of the tested specimens found that the main components of defor-mation Δ are: 1) bolt slippage inside the bolt holes, which could reach as much as 2.5 mm. Since the specimens used snug-tightened bolts, the slippage occurred at the beginning of the loading (Figure 6); 2) bearing of holes, as indicated by the shrinkage of the hole edge and the enlargement of the hole diameter; 3) bending of hole edge for the specimens having Leh = 45 mm; 4) shear yielding
and tearing of holes along the shear plan for the specimens having Leh= 45 mm;
and 5) yielding and necking of net section under tension for the specimens hav-ing Leh= 57 mm or having two columns of bolts. Table 2 provides the measured
residual deformations.
The comparison between T95-45 and T95-57 indicates that increasing the edge distance from 2 db(45 mm) to 2.5 db(57 mm) resulted in a larger tensile
resistance without decreasing the overall deformation capacity. But edge dis-tance appears has no impact on the initial tensile stiffness. Comparing T95-57-1 with T95-45-2, one can see that two-column of bolts did not increase tensile re-sistance (both groups had the same failure mode), but reduced deformation ca-pacity approximately by half (due to the smaller bearing deformation).
[image:7.595.211.536.230.387.2]DOI: 10.4236/wjet.2019.72B002 17 World Journal of Engineering and Technology
Table 2. Components of tensile deformation Δd.
[image:8.595.207.539.88.226.2]Specimen ID
Table Column Head Test residual
deformation (mm)
Hole bearing Δhb (mm)
Hole bending Δhn (mm)
Shear tearing Δst (mm)
Necking Δnk (mm)
T95-45-1 17.0 4.0 9.5 4.0 0
T95-57-1 17.0 7.0 1.0 0 9.0
T95-45-2 8.0 1.0 0 0 7.0
T127-45-1 15.0 2.0 10.0 3.0 0
T127-45-2 8.0 1.0 0 0 7.0
Note: the bolt slippage is excluded from the deformations.
finite element model is developed to mimic the tested specimens. Then, the veri-fied finite element model is used to conduct a parametric study to expand the database of the test results, including taking into account the combined effect of shear load and tensile force.
The finite element software package Abaqus is used for this study, with Ab-aqus/standard used as the analysis engine [7]. The three-dimensional brick ele-ment with eight nodes is used. The material properties included elastic modulus
E = 200 GPa, Poisson’s ratio of 0.3, the calibrated initial fracture strain as a func-tion of triaxiality, and the calibrated damage evolufunc-tion criterion as a funcfunc-tion of the plastic displacement of an element. Figure 7 illustrates that the finite ele-ment model is capable of replicating the two failure modes. In the figure, only one-half of the specimens was required to be reproduced due to the symmetry of the specimens. The finite element models allow the accurate measurement of bearing and necking deformations. More details about the finite element model ling will be reported in another paper.
3. Analysis Example of a Shear Tab Connection
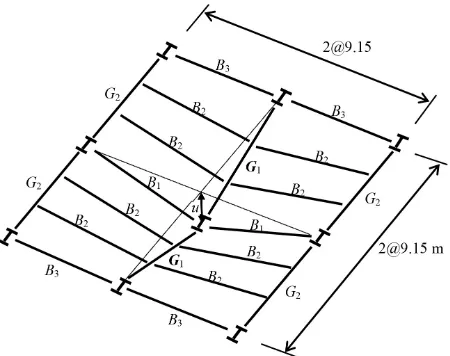
Figure 8 shows a part of a building floor framing plan with a panel dimension 9.15 m by 9.15 m. The shape of Girder G1 is W610 × 125 [8], with beam depth d
= 612 mm, web thickness tw = 11.9 mm, expected yielding strength Fye = 385
MPa and ultimate strength Fue= 495 MPa. The column section is W360 × 347,
with its depth of dc= 407 mm, flange width bcf= 404 mm. The connections of
concern are at the ends of girder G1. For the double-span condition shown, the design floor load for the girder is estimated to be 2.4 kPa considering the com-posite floor slab itself is capable of sustaining part of the floor weight. Using the tributary area of the central column, we can find that the double-span beams must be capable of supporting 133 kN point load at the central column.
DOI: 10.4236/wjet.2019.72B002 18 World Journal of Engineering and Technology
[image:9.595.262.487.229.407.2]Figure 7. Finite element models of one-half of the specimens.
Figure 8. Floor framing plan of a design example.
center of the connection coincides with the centerline of the girder. The connec-tion spring model is based on a tributary width of 76 mm and edge distance of 2.5 db. The parameters of the T-∆ curve (Figure 3) of the springs are provided
as follows: 1) a bolt slippage of Δts = 1.6 mm at the beginning with zero loading;
2) Δy= 4.1 mm, Δu= 19.6 mm and Δd= 22.6 mm, corresponding to strength Ty
= 250 kN, Tu= 325 kN and Td= 166 kN, respectively. The bolt holes at the beam
web connection must be proportioned for a load of 325 kN such that the resis-tance of the shear failure at the hole edge will not govern (which results in an edge distance of 65 mm for the beam web holes). It is assumed that the springs cannot take any compressive force, thus, compressive strength Byand Bu are not
required.
The shear tab is modeled by 5 springs, and the locations of the springs with respect to the centroid of girder G1 are y1 = 152 mm, y2 = 76 mm, y3 = 0, y4 =
−76 mm, and y5 = −152 mm (positive below the beam centroid and negative
above the beam centroid). The axial deformation of the ith spring is calculated as
(
2) (
1 cos)
1 tani Lb θ yi θ
∆ = − + (1)
where: θ is girder slope (Figure 2(c)); Lb = 8716 mm, which is the length of the
DOI: 10.4236/wjet.2019.72B002 19 World Journal of Engineering and Technology
first term of Equation (1) represents the elongation caused by the sagging of the middle column; i.e., the difference of the lengths between the hypotenuse and the horizontal side. The second term is the deformation caused by the rigid arm rotating with the girder. The deformation of the girder under axial load is neg-ligible.
The load-carrying resistance of the double-span beams at its ultimate limit state is Pu = 164 kN, while the beam slope θ = 0.072 rad. The corresponding
de-formation of each spring are: Δ1 = 22.3 mm, Δ2 = 16.8 mm, Δ3 = 11.3 mm, Δ4 =
5.8 mm, and Δ5 = 0.4 mm; the tensile force of each spring are: T1 = 183 kN, T2 =
311 kN, T3 = 285 kN, T4 = 258 kN, and T5 = 0 due to bolt slip. The connection
force resultants are: axial force N = 1037 kN, moment M = 32 kN-m, shear force
V = 82 kN. The sagging of the middle column is Lb tanθ = 628 mm.
Though it is not conducted herein, additional angle connections can be added to the top and bottom flanges of the beam to further increase the strength and ductility of the beam-to-column joint [5].
4. Summary and Conclusions
The beam-to-column shear connections are the weakest link of a floor system to bridge are moved column known as a double-span scenario. To develop a cate-nary action within the double-span beams under the sagging of the floor, the connections must be capable of sustaining large axial deformation in addition to the rotation. A nonlinear connection model is required for evaluating the de-mands on the steel connections. To this end, this study presented a compo-nent-based spring model, which is also able to capture the interaction between the axial and rotational deformations of the connections. An experimental study on shear tab connections were conducted, and finite element models were veri-fied in order to expand the test data. The obtained load versus deformation curves were applied to an analysis example. The presented procedure is applied to the robustness design of steel building frameworks using alternate path me-thod [1].
Acknowledgements
The authors wish to acknowledge the financial supports from Coastal Steel Con-struction Ltd., Thunder Bay, Ontario, Canada.
Conflicts of Interest
The authors declare no conflicts of interest regarding the publication of this pa-per.
References
[1] DoD. UFC 4-023-03 (2016) Design of Buildings to Resist Progressive Collapse, Change 3. Department of Defense, Washington DC.
DOI: 10.4236/wjet.2019.72B002 20 World Journal of Engineering and Technology
[5] Gong, Y. (2017) Test, Modeling and Design of Bolted-Angle Connections Subjected to Column Removal. Journal of Constructional Steel and Research, 139, 315-326.
https://doi.org/10.1016/j.jcsr.2017.10.004
[6] Gong, Y. (2010) Analysis and Design for the Resilience of Shear Connections. Cana-dian Journal of Civil Engineering, 37, 1581-1589.https://doi.org/10.1139/L10-097
[7] Abaqus Analysis User’s Guide. (2019) http://130.149.89.49:2080/v6.14