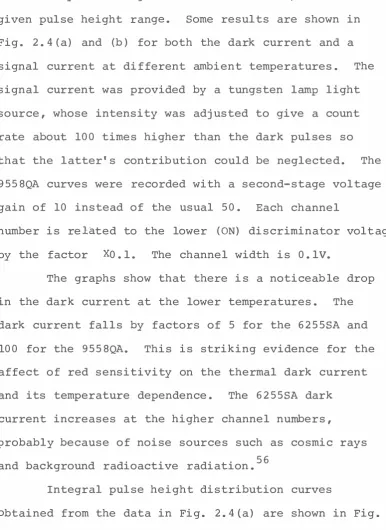
RAMAN SPECTROSCOPY AND THE
LATTICE VIBRATIONS OF CdC12 AND CdBr2
A thesis presented for the
degree of Doctor of Philosophy in Physics in the University of Canterbury,
Christchurch, New Zealand.
by
D.J. Lockwood
. l-�17
To My Parents, God Bless Them.
The fundamental lattice vibrations of the trigonal CdC12 structure (D3d5) have been analyzed group theoret ically, and symmetry coordinates have been constructed. The primitive cell has nine normal modes of vibration. All six optical modes are either infrared or Raman active, so a complete vibrational analysis is possible. esults of far-infrared measurements on a ourier-transform
spectrometer together with Raman spectra recorded by argon laser excitation are presented for both CdC12 and CdBr2• Symmetry assignments of the observed frequencies are made on the basis of the shift in frequency in going from
chloride to bromide and the polarization behaviour. �eaks in the second-order axial infrared absorption spectra are assigned to allowed fundamental combinations. The lattice frequencies of CdC12 are consistent with those of the
isomorphic crystals of CoC12 and MnC12, which have also been investigated by infrared absorption. An unsuccessful attempt was made to measure the electronic Raman spectra of Fe2+ and Co2+ ions in CdC1
2 and Cd.Br2•
The Raman spectra were measured on a Raman system comprising a 5 watt argon laser and a double monochromator, with photoelectric detection. The construction of the Raman spectrometer, and the associated signal processing electronics, is described in detail. pecial emphasis has been placed on the use of on-line computer techniques in processing the Raman signal. signal averaging system has been eveloped that is superior to both hoton
This thesis is the result of an interest in Raman spectroscopy that began during my M.Sc. year, when it became apparent to me that the use of laser light sources was about to revolutionise this
difficult form of spectroscopy. The major part of the thesis is concerned with the development of a Raman spectrometer suitable for solid state studies. The
spectrometer is described in detail, with emphasis on the application of on-line computer techniques. The
remainder of the thesis is devoted to a study of the lattice vibrations of crystals with the cadmium
chloride structure using Raman and infrared spectroscopy. The development of the Raman spectroscopy facility has involved at some time or another all the Depart
mental workshop facilities and technical staff, and most of the academic staff. I am particularly grateful to my supervisor, Professor A.G. McLellan, for his continued help and support in encouraging this project, and to Professor B.G. Wybourne for his interest and financial support through the U.S. Air Force Grant. I wish to acknowledge useful discussions with Dr G.D. Jones and Dr R.G.T. Bennett, and I thank R.W. Tyree for his considerable help in setting up the argon laser and
to R. Ritchie for growing the crystals, to L.E. Hunter for the photographic services, and to J.H. Christie for assistance with the IBM 360/44 computing.
This research was supported by an equipment grant from the N.Z. University Grants Committee under URG Grant No. 66-241 and, in part, by the U.S. Air Force Office of Scientific Research under AFOSR Grant No. 12 75-6 7.
Some results reported herein were first presented at the International Conference on Light Scattering Spectra of Solids, New York University,
New York, 3 - 6 September 1968 and at the Annual Meeting of the Optical Socjecy of America, Pittsburgh, 9 - 11 October J9 6 8.
David J. Lockwood July 21st, 1969.
PREFACE
PART I
RAMAN SPECTROSCOPY
Chapter 1: THE RAM.AN EFFECT 1.1 Introduction
1.2 General Raman Theory 1.3 Selection Rules
1. 4 The Polarizability Theory 1.5 The Raman Effect in Crystals 1.6 Temperature Effects
1.7 Symmetry and Selection Rules 1.8 Recent Theory
Chapter 2: THE RAMAN SPECTROMETER 2.1 The Source
2.2 The Spectrum Analyser 2.3 Spectrometer Dispersion
2.4 The Detector and Electronics 2.5 Spectrometer Performance
V
iii
1 1 3 10 13 16 24 28 30
3.1 Digitise 3.2 Photon-Count 3.3 Signal-Average 3.4 Performance Tests
PART II
THE LATTICE VIBRATIONS OF CdC12 AND CdBr2 Chapter 4: THEORY
4.1 Introduction
4.2 Crystal Structure 4.3 Vibrational Analysis 4.4 Symmetry Coordinates
Chapter 5: EXPERIMENT 5.1 Crystal Growth 5.2 Raman Spectra 5.3 Infrared Spectra
Chapter 6: DIS CUSSION OF RESULTS 6.1 The Raman Spectra
6.2 The Infrared Spectra 6.3 The Impurity Spectra
vi
76 78 81 90
95 95 97 97 103
109 109 110 115
7 .1 Introduct4m 7.2 Experiment
REFERENCES
Appendix: PDP-8 COMPUTER PROGRAMS A.l Digitise
A. 2 Photon-Count A.3 Signal-Average
vii
141 143
146
C H A P T E R 1
THE RAMAN EFFECT
1. 1 Introduction
The measurement of the Raman spectrum of a crystal is one of the main methods for obtaining information about its lattice frequencies. Raman spectra, in conjunction with the complementary infra red spectra, usually give sufficient information for the phonon dispersion curves to be plotted. Neutron scattering is now taking over this role for crystals of simple structure.
Besides this, however, Raman scattering is used for testing theories of lattice dynamics. Some of the more subtle effects in Raman scattering have only been explained in more recent years due to the increase in knowledge of the properties of lattice vibrations. Theory at present is limited to the sim pler crystal structures, where interpretation of
In the lattice Raman effect, monochromatic light incident on a crystal interacts with the crystal to create or destroy lattice vibration quanta (phonons). The energy gained or lost is compensated by a change in energy of the emitted light. Thus if w 0 is the
frequency of the incident light, w s the frequency of the scattered light, and hw the energy change involved then w = w ± w.
S 0
The Raman effect in crystals is not limited to lattice interactions. The advent of laser light
sources has. enabled the observation of Raman scattering by crystal excitations such as localised impurity modes, plasmons, magnons, polaritons, polarons, electron spin flip and Landau levels, and by electronic transitions
1
of ions in crystals. Thus Raman scattering experiments are an important tool in the study of the fundamental properties of crystals. The observations serve a two fold purpose. Firstly to obtain information on the energy and spatial properties of crystal excitations which will help in understanding their behaviour; and secondly to improve the basic theory of Raman
In this thesis we are mainly concerned with developing a sophisticated Raman spectrometer which is capable of investigating the crystal properties
mentioned above. Part I reviews the pertinent Raman theory and describes the Raman spectrometer. In part II, the lattice vibrations of CdC12 and CdBr2 are investigated by means of Raman and infrared
spectroscopy.
1.2 General Raman Theory
In 1928 Sir
c.v.
Raman2 announced the discovery of an effect that bears his name, and was to win him the Nobel Prize in Physics. During the course of a systematic investigation of the scattering of light in liquids and solids he had observed frequency shifts in the scattered light which were dependent on the sample3 used. Shortly afterwards, Landsberg and Mandelstam published details of the Raman effect in quartz.
Raman's discovery had been theoretically
that the total intensity* of the frequency-shifted scattered radiation is given by
I mn (1. 1)
where
P mn h =
.!.
I: [Mrn v -v (�Mmr)r rm o ( 1. 2)
P mn is the induced electric moment matrix element or induced transition moment associated with a transition between the initial state m and the final state n of the system; c is the velocity of light; v 0 is the frequency of the incident light with electric vector
!
exp(-2Tiiv0t); and h is Planck's constant. The scattered light has frequency v +v o mn wherev mn = v - v m n' rn v and v rm are the frequencies corres-ponding to the differences between states denoted by the subscripts, and M and M are the corresponding rn mr
transition moments. For Raman scattering, v o mn +v > O,
which means that the energy of the incident light must be greater than the actual transition energy. The transition moments are given by
{1.3a)
where Mis the electric moment operator and
w ,w
n r arethe time-independent wave functions of the states n, r. Equation {1.3a) may be written as
= <nlMlr> {1.3b)
• • I t t" 6 in Dirac s no a ion.
The summation in equation {1.2) is taken over all stationary states r of the system. In general these will be vibronic states, a combination of electronic states and their associated vibrational levels.
In deriving this formula it is assumed that the wavelength of the incident light is large compared with atomic dimensions, which is true for the visible
region of the spectrum, and that v does not coincide 0
with a resonance frequency of the system. Infinities
in equation {1.2) in the neighbourhood of resonance can be avoided by including radiative damping effects.7 The resonance case will not be discussed here.
Placzek.9 Equation (1.1) has not been superseded by modern theory, and forms the basis for all Raman scattering theory.
There is a tensor relation between the complex amplitude E of the incident radiation and the induced moment. If p anda denote the cartesian occrdinates x, y, z then
(P) P mn
=
L (apa)mnEa, (1. 4)where
(apa)mn
=
a
l [(Mo1rn1Ma1mr
- L
+
h r \) -\) rm o
= <n
I
a paI
m> •(Mo)rn(Mo)mr] " +v rn o
(1. 5)
(a ) represents a complex and unsymmetric tensor. pa mn
Using equations (1.1) and (1.4) we have
I nm
=
(1.6)for the total intensity of the scattered light per unit time, where 10
=
2�1Ei
2 is the intensity of the incident light and e0 is a unit vector describing thepolarization of the incident light.
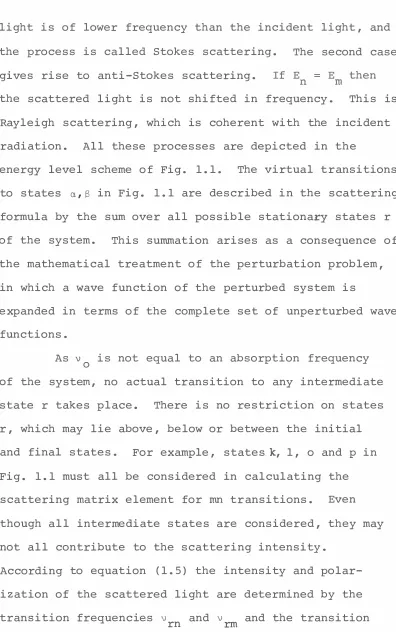
the process is called Stokes scattering. The second case
gives rise to anti-Stokes scattering. If E = E then n m
the scattered light is not shifted in frequency. This is Rayleigh scattering, which is coherent with the incident radiation. All these processes are depicted in the
energy level scheme of Fig. 1.1. The virtual transitions to states a,S in Fig. 1.1 are described in the scattering formula by the sum over all possible stationary states r of the system. This summation arises as a consequence of the mathematical treatment of the perturbation problem, in which a wave function of the perturbed system is
expanded in terms of the complete set of unperturbed wave functions.
As v is not equal to an absorption frequency 0 of the system, no actual transition to any intermediate state r takes place. There is no restriction on states r, which may lie above, below or between the initial and final states. For example, statesk, 1, o and p in Fig. 1.1 must all be considered in calculating the scattering matrix element for mn transitions. Even though all intermediate states are considered, they may not all contribute to the scattering intensity.
[image:16.493.31.427.18.650.2]I
Energy
Raman Spectrum
---t,-1
I
-r-1-1 I
I
I
I I
I
I
I
I
hv 0
t7+:
-I -I -I -I
I
I
i
I
I I
I I
I I
I
I
I I
I I
-
-'1',-
�
I l
hv 0
I I
-
-1-r-
�
I
I
I
I
I
I
--+---+----+--+--____.__,,___-.J __ ____,1---...- r.
---1----
1I I
rr.
--- k
( 1)
\I -v o mn
( 2)
Frequency Stationary energy states
-->-
Real transition - - � Virtual transition>
( 3)v +v o mn
Fig. 1. 1. Quantum mechanical energy level representation of (1) Raman Stokes, (2) Rayleigh and
[image:17.482.74.441.136.612.2]moments M rn and M . Products of transition moments mr are involved, and since these may be positive or negative it is possible for interference of the transition probabilities to take place. Thus terms that belong to different intermediate states can reinforce, weaken or cancel each other. If complete cancellation is obtained then the Raman transition is forbidden. Also, M rn and M mr must both be different from zero for state r to contribute.
The frequency dependence of the scattering
intensity can be considered under three characteristic cases. (1) The incident frequency v is small como pared with the transition frequencies v rn and v rm If the frequency dependence in the denominator of equation
(1. 5) is neglected, the intensity is proportional to (v +v )o mn 4. (2) The incident frequency is close to an absorption band v , so that the effect of a single rm term in equation (1. 5) predominates. Here the
scattering intensity is proportional to
(v +v )4/(v -v )2• Resonance also occurs when v is
o � rm o o
close to an emission frequency v nr of the final state. At the resonance frequency itself, the scattering
neglected in the derivation of equation (1.5} and so this expression no longer holds. It has been
established experimentally that the scattering intensity does reach a maximum in the vicinity of an absorption
10
band. (3) The incident frequency is large compared
with vrm and vrn In this case the intensity of the
Raman scattering approaches zero.9
1.3 Selection Rules
Selection rules in the Raman effect can be derived from symmetry considerations. Thus the trans formation properties of the scattering equation need to be investigated. The scattering tensor (a } P cr mn transforms like the matrix element of a tensor com ponent f�*a � d,.9 Notice that this matrix element n po m does not contain the intermediate states explicitly.
The selection rules are determined by the properties of the initial and final states. This is most useful, as it is not generally possible to determine selection rules by evaluating equation (1.5}.
components a pcr occurs in the reduction of r n x r m
*·
r , r are symmetry representations of the wave vectors n m The transformation properties of a P cr are
listed in Heine 11 for a set of molecular point
which
three
includes the 32 crystal point The scattering tensor can be parts:
( a ) pcr mn -- ( ai + as + aa ) pcr pcr mn
The isotropic part
i 1
(a )mn = -3(axx + a + a ) yy zz mn
" +v
groups.
separated
groups
into
= 1 3h E ( " -v ) ( " + v ) rm rn
r rm o rn o [E(M ) (M ) cr cr rn cr mr ].
The symmetric part
(a8
) - !.:(a + a ) - (ai) pcr mn - 2 pcr crp
mn mn
\) + \)
= 1 2h E rm rn [ ( )
(v -v ) (v +v ) MP) rn (Mcr mr
r rm o rn o
=
2v +v o rnn 2hThe isotropic part is a scalar quantity and thus trans
forms as the identity representation. As the sum of
the diagonal elements of a tensor is called its trace,
(ai) mn gives rise to "trace" scattering. The
selection rules for (apa mn s ) , a symmetric tensor with
zero trace, are identical with those of quadrupole radiation. Hence the (aspa ) mn contribution is referred to as the "quadrupole" scattering. The antisymmetric
part represents an axial vector, and gives rise to
"magnetic dipole11 scattering because of the similarity
with magnetic dipole radiation. Magnetic dipole scattering has a different frequency dependence from
that of trace and quadrupole scattering. For small
frequencies it drops off much faster than the other
two.
The scattering intensity is now proportional to
I < , 1
2=
I <
i,+ < s , + < a , 1
2indicating that the amplitudes and not the intensities of the three components are added .
1. 4 The Polarizability Theory
A direct application of the general scattering equation (1 . 6) is prohibitively difficult for all but the simplest atomic systems. The main difficulty is a lack of information about the intermediate states
involved in the summation. However, Placzek has 9
shown that some simplifications are possible in the case of molecules.
First the adiabatic approximation is used to separate the wave function of the molecular system into two factors: one the wave function for the electrons moving in the field of the nuclei which are held fixed in an arbitrary configuration, and the other the wave
function for the nuclei moving in some effective potential given by the eigenvalues of the electronic motion . In calculating the scattered radiation the molecules are first assumed to possess fixed nuclei; subsequently the scattering is modified by the nuclear motions . It is also assumed that the scattering intensity for any
with the value for stationary nuclei in the same positions .
At ordinary temperatures a molecular system is practically always in a state belonging to the lowest electronic level . Provided this level is non
degenerate, the scattering tensor can be shown to be
(1 . 7)
where Xnv is the nuclear vibrational wave function, n
the electronic quantum nurnber,v the nuclear vibration
number and q refers to the nuclear coordinates. a pa
represents the polarizability of the electronic ground state. In deriving this expression, the following approximations were necessary:
(1) Because of the relatively large nuclear mass, only the electronic polarizability need be
considered .
(2) The Raman frequency shifts must be small compared with both the frequency of the incident
light v0 and the frequency difference ve-v0,
where v e is the lowest electronic absorption
frequency.
vanishes. Near resonance the magnetic dipole term is significant and may allow new lines to appear in the Raman spectrum.
Calculation of the polarizability matrix
element requires a knowledge of the vibrational wave functions and the ground state polarizability. The latter quantity is generally not known. If the wave function is written as a product of harmonic oscillator functions each depending on a suitable normal
coordinate q. describing the nuclear vibrations, then J the polarizability can be expanded in terms of these
normal coordinates.9 The expansion is taken as a Taylor series around the equilibrium configuration of the ground state.
( 1. 8)
The first term in the expansion gives rise to Rayleigh scattering; the second gives rise to Raman shifts
corresponding to fundamental vibrational energies; and the third term produces Raman scattering from
combinations and overtones of two fundamentals. The higher terms will influence these processes, but only to a very small extent .
The result of all these approximations and
simplifications is that the intensity and polarization of the Raman line now depends upon the nuclear
coordinate dependence of the ground-state
polarizability which no longer involves the difficulty of the summation over intermediate states. The
polarizability derivatives can be calculated by methods employing the variational technique.15
Placzek's polarizability theory has formed the basis for most theoretical work in the Raman effect. Particularly in the case of calculating Raman
intensities for molecules. Recently Albrecht, 12 Ting13 and Koningstein14 have outlined other approximations
which do not involve the expansion of normal coordinates.
1.5 The Raman Effect in Crystals*
a po in terms of
The first systematic account of Raman scattering by phonons was presented by Born and Bradburn.16 Their theory is a straight-forward extension of Placzek's polarizability theory for molecules, and utilizes the
Born theory of lattice dynamics. 17 17
Following Born and Huang, the Raman scattering
intensity per unit time per unit solid angle is
I = (w +w 0 vv , )
3 21TC
4
(1.9)
where w is the frequency of the exciting light and 0 wvv' is the frequency of a vibrational transition from state
v
to another statev' .
n and n are two 1 2mutually perpendicular unit vectors which describe the polarization of the scattered radiation. i ay,S:\
denotes the product of matrix elements* of the electronic
-
+
polarizability, and E
Y and EA describe the electric field of the incident light. The electric field is given by
�(t) = ( 1.10)
*The matrix elements in Born and Huang are written in
the reversed notation. If A is some real linear operator, then the matrix element connecting states m and n is
written here as Arnn = <nlAlm>. In Born and Huang this would be written as A = <mlAln>. The relationship
where E
=
(E+)* is an arbitrary constant vector. The factori ay,BA = p � ay vv'J* p BA vv'
where the P's are the matrix elements of the polarizability.
and
=
<V IP* Iv'>,
ay
In general, the matrix element
= <n IP Im > aB
+
V f V 1
(1.11)
( 1.12)
(1.13)
defines the aB component of the polarizability tensor for the transition from state m to state n. Equation (1.13) is a reformulation of equation (1.5). For the vibrational Raman effect, according to Placzek's
the9ry, equation (1.13) becomes
[<ov ' IM In II v
11 > <n II v II
I�
I
ov >=
1E a . B
fi n11, v11 w n11v11, ov - w o
<ov ' IM In II v 11 > <n II v II
IM
I ov > ]+ w B a
p��· is a function of the frequency w0 and the coordinates X of the crystal nuclei. The quantum numbers n and v characterise the vibrational wave function �v(X) described earlier.
The ground-state polarizability is now expanded in terms of the complex normal coordinates of the
crystal.
0 0 N
(k
-k
) (k)· (-k)
op,.,, "'.., 0
=
IN
E P O c . > Q c . >+
½ E i P O -:-- � JQ -:-- Q � + • • • c 1. 1s > j a.., J J k ij a.., 1 J 1 J0
where oP a.., O
=
P a.., o 0(w ,X) - P a.., o 0(w ,X ) is the change in the polariz·ability due to displacements of the nuclei, normalised for N unit cells.o(�)
J is the jth normal coordinate of wave vectorfrequency
w(�J;
J j=
1, 2,k with corresponding
- - - , 3n where n is the
number of atoms in the unit cell. The coefficients
(k -k)
P (�) and P -:-- �) are the derivatives of the al3 J al3 1 J
polarizability with respectto the corresponding normal coordinates. These coefficients can be expressed in terms of the nuclear displacements, masses and
vibrational eigenvectors.
momentum (wave vector) give
0
w 0
=
w s ± w ( • ) J (1.16)and
=
k ± k.,
-s -J (1.17)
where o,s refer to the incident and scattered light respectively. k. is the wave vector of the phonon of -J frequency w ( .) • The light scattering measurements are J carried out at optical frequencies where there is little dispersion of the refractive index so that k = k , 0 S
Equation (1.17) now becomes
k. = 2k sin e, J 0 (1.18)
where 20 is the angle between the directions of the incident and scattered light. For visible light equation (1.18) reduces to k. = O. In the case of J light scattering by the optical modes of vibration k. -J may be taken equal to zero as shown in the phonon
0
frequency w (.) . This approximation can not be made for J acoustic modes (Brillouin scattering) and, strictly speaking, should not be applied to Raman scattering by infrared-active phonons. The latter case leads to R aman sea ering y po ari ons. tt . b 1 't 19
state of the crystal after the scattering process differs from the initial state by two vibrational quanta. The energy and wave vector conservation laws governing this process are
= (1.19)
�d -<> k = k ± k. ± k. ± NK, -s -l -J (1.20)
where K is a reciprocal lattice vector and N = 0 or 1.
The last term in equation (1.20) takes account of any wave vectors which may lie outside the reduced Brillouin
zone. As k = k , equation (1.20) can be written in 0 S
the Bragg condition form:
I± k. ± k. ± NKI = 2k sin e. -l -J - 0 (1.21)
The vibrational modes involved may be either optical or acoustical, or a combination of both. Thus the
distinction between Ram� �d Brillouin scattering can not be made for modes with wave vectors away from the
± k. -1
= �
-J k.=
±k. (1. 22}Thus second-order Raman scattering involves contribut ions from pairs of phonons with equal and opposite wave vector from throughout the reduced zone. Therefore features in two-phonon Raman spectra can be related to structure in the combined density of states of the
pairs of vibration modes. Such structure is associated with critical points in the reduced zone.20
If the wave numbers k are divided into two groups by an arbitrary plane through the origin such that k and -� lie on opposite sides of the plane, then the complex normal coordinates can be expressed in terms of real normal coordinates q1 and q2 as follows:
=
(1.23}
=
=
The second-order term in the expansion (1.15} can now be expressed in terms of these real normal
½ E E
k ij
- itf i� l[P aB
(f
-;i
+
Pa Bn
;iJ
[q
1
(f
)g
l
(})
+
q
2
(f
Jg
2
(})]
- i [pa 8 ( � -} ) - pa 8 (-� } ) J L q 1 ( �) q 2 (}) - q 2 (
f)
q 1 ( �)]} ; ( 1. 2 4)remembering the symmetry relations
(k -k)
Pas
i
j
=
pas(-k k)
j
i=
P* - -)
aS (-k k i j •The Raman scattering due to the six different types of transition are listed below together with the corres ponding terms of equation (1.24).
Number Type
1, 2 overtone 3, 4 summation
5,6 difference
Frequency
w O
+
2w(})WO�[ W (:)
+·�(
;J]
w0�[w(:)-�(})]
w ( �) >w ( �)
Terms Responsible
qi(�) , q;( ;)
k k k k
q1CiJ ql( ;-) ,q2Ci) q2{
jl
k k k) k
ql(
i)
q2(;-l
,q2(1J
ql( ;-)Because of the continuous nature of second-order scattering it is convenient to reformulate equation
(1.11) as a function of frequency:
w <w +w , <w+t.w
i ay,µA 0,(w) = lim O
P:
<vlP�
�'><v'IP
0;:i..lv>6w�o V y µ (1.25)
= E < v
I
p *I
v ' > < v'I
P O ;:i..I
v > 6 ( w-WO-w v v, ) ,
v' ay µ
where the states v' cover a continuous energy spectrum. The intensity expression (1.9) is now
I ( w) d w = (1.26)
The function i ay1µA 0,(w) can be subdivided into six parts corresponding to the different types of scattering.
i ay1µ0A ,(w) =
6
"' "' . (s) ( )
" " 1 s;:i.. w .. ,
i�j s=l ay, l.J
such that i CJ.y1µA 0,{w) = 0 if ii j for s = 1,2
(1.27)
= 0 if � = j for s = 3,4,5,6.
1.6 Temperature Effects
So far the calculations have neglected thermal
observed intensities the theoretical formulae must be corrected for temperature effects. This involves
forming the thermal average of all initial states v
for a fixed transition frequency wvv' via the Boltzmann
distribution function.
The thermal averages of the appropriate
polarizability matrix elements ere given in Born and 17
Huang. For the first-order Raman effect equation ( 1.11) becomes
il).Y,
rn
= NC ('?)
where =
J 1
-0 0 0 0
P (.}P13A(.)C(.)D(.); l).y J J J J
1'1/2 w ( • )
0 exp (-hw ( . ) /kT)
J
and D (j) = 1 for Stokes scattering
(1.28)
(1.29)
-1\w (<?) /kT
e J for anti-Stokes scattering.
=
As P* I).µ
J�
J)
=
P I).µ0
(-�)
J,
it follows that P l).y (<?) J and0
P13A (j) are real. The ratio of Stokes and anti-Stokes intensities is
I (Stokes)
I (anti-Stokes) =
o 4
(w -w (.)) 0
J
( w +w 0 { . ) ) 0
4
J
0
-'hw (.) /kT
e J
scattering, the components of equation (1.2 7) become
i ( 1 ) 0 • ( w ) • • dwJ
ay,µ /l J J
. (2) ( ) d
]. Q"\ w • • w
ay,µ/l J J
i( 3 )(w) . . dw J l. J
. ( 4 ) ( ) d
l. w " w l.J
. ( 5 ) ( )
l. w . . dw l.J
. ( 6 ) ( )
l. w • • dw l. J
x
c(i)c(�)
JX
=
(k -k) (k -k) (k)
VJJ JdkP � � P0., � �
c
2 � - ay J J µ/l J J J
-
ist
)
(k
)
e J o(w-w -2 w � ) 0 J
�
c-k
k) (k -�.)
Vff fdk P l � � P0., �
where
c (�) is defined by equation (1. 29) and
Js (�)
J = 'fiw -:-J/kT. (k)J N/2
The summation E in equation (1. 2 4) has been replaced k
by Vfffd�, where V is the volume of the crystal.
These intensity formulae have been calculated on the assumption that the lattice vibrations are
harmonic. The inclusion of anharmonic forces produces a finite line width, and results in the Raman shifts
and linewidths being temperature dependent. In most
cases there is a broadening of the Raman lines with increase in temperature accompanied by a shift of the Stokes lines to higher frequencies. The effect of anharmonic interactions can be accounted for by including a factor like
; . (k)
( w -w 0 -:-J-ti-w ) 2
) S + r
2
2 1 2 2
in the scattering intensity formulae. ' This
factor represents a Lorentz distribution of half-width
(k)
r
about the frequency w -w t -:-0 J -6. 6 is the temperature dependent part of the frequency shift of the Ramanobtained by considering three- and four-phonon
interactions and the thermal expansion of the lattice .
1.7 Symmetry and Selection Rules
As mentioned earlier, the polarizability tensor
is symmetric in Placzek ' s theory. Further symmetry restrictions are introduced by the requirement that the scattering tensor should be invariant under the operations contained in the crystal space group. Also , the symmetries of the normal coordinates describing the vibrations of atoms in the unit cell are characterized by irreducible representations of the space group of the crystal lattice . Consequently a phonon can
participate in a first-order Raman transition if and only if its irreducible representation is the same as one of the irreducible representations which occur in the reduction of the representation of the
polarizability tensor.
For long wavelength phonons the crystal factor group can be used in classifying the phonon symmetries .
(This k = 0 assumption is not valid for phonons which
are simultaneously infrared and Raman active because of additional effects due to the long-range electric
2 2
and Loudon give the form of the Raman tensor for all
representations of the 32 crystal point groups that
correspond to Raman-active lattice vibrations.
Ovander ' s list is more general in that anti-symmetric
Raman tensors are also considered.
The selection rules for the second-order Raman effect are more complicated. Contributions from k = 0 phonons are easily dealt with. For combination states, the Raman transition is allowed if the Kronecker
product of the irreducible representations of the two phonons contains irreducible representations in common with the polarizability tensor. For overtone states, the symmetrized Kronecker square of the phonon
irreducible representation must contain irreducible representations in common with the polarizability
tensor. For non-zero wave vectors, it is necessary to form Kronecker products and symmetrized Kronecker
1. 8 Recent Theory
The Born-Bradburn theory has been applied
extensively in explaining the Raman effect in crystals with reasonable success . A recent example is the
calculation of the second-order Raman spectrum of NaI 25
and KBr by Cowley . The main features of the theory
are (1) the use of semi-classical radiation theory in discussing the coupling of the light to the crystal via the electron polarizability , and (2) the
expansion of the polarizability in terms of the normal coordinates to obtain the electron-lattice interaction .
The development of a better understanding of the interaction of radiation with a crystal has resulted in
. 26-30
several new theories of Raman scattering . The main features of these theories are (1) the use of second quantization in the treatment of the electron radiation interaction , and (2) a more explicit and
detailed examination of the electron-lattice interaction. Strizhevskii2 6 considers the quantization of the
electromagnetic field in a crystal in conjunction with a phenomenological treatment of the medium using the dielectric constant tensor . The heterogeneities
scattering of the electromagnetic waves. A general formula is obtained for the scattering tensor which can be applied to scattering by impurities and lattice
defects as well as phonons. Because of this generality , it is difficult to gain much insight from this formula.
Ovander2 7 treats the Hamiltonian of the
crystal plus radiation plus interaction in the second quantization representation. The crystal is regarded as a collection of interacting molecules , and the
Stokes scattering mechanism is taken to be the decay of one polariton into two. Incident radiation creates the first polariton , whose energy corresponds to a frequency in the region of crystal transparency. The other two polaritons correspond to a " red" shifted polariton in the region of transparency {the scattered radiation) and an almost purely mechanical oscillation { the phonon).
The results of this theory are similar to that of
2 8
Loudon. Their differences , such as in the extreme case of resonance , are fully discussed in an excellent
. . 1 b 2 2
review artic e y Loudon.
Loudon' s theory2 8 has become widely acc�pted, and
will be briefly reviewed. The calculations are based on semi-conductor properties but can equally well be
Loudon shows that the most important Raman
interaction between the photons and phonons takes place through the intermediary of the electrons , and there fore the electronic band structure of the crystal must be taken into account. The first-order Raman
scattering process is described as three virtual electronic transitions accompanied by the following
photon and phonon transitions ; (1) a photon w is
absorbed, (2) an optic phonon w( . ) is created or J
destroyed , (3) a photon w is emitted. The three tran-s
sitions can occur in any time order. Transitions (1)
and (3) occur through the electron-radiation interaction and (2) occurs through the electron-lattice interaction. Other higher order processes are possible but are
assumed negligible as in most other theories.
(Numerical estimates j ustify this assumption . ) At the start and end of the scattering process the crystal is assumed to be in the electronic ground state with all valence bands full and all the conduction bands empty.
The virtual intermediate states that occur in the
The three step scattering process outlined above is treated by third-order time-dependent perturbation theory to give for the Stokes scattering probability per unit time
w
- � - � 6 k.,k a,b E I E u -J -s<n O -1 , n 5 + 1 ; n j + 1 ; 0
I
HII
a>
< aI
HII
b>
(bI
HII
n0�. n 5 ; n j ; 0>
( w a - w o ) ( wb - w o )
0
x o ( w - w ( . ) - w ) , 0
J S
2
(1 . 3 0)
where the second-quantization formalism has been used for the radiative field. n , n and n. are the numbers 0 S J
of incident photons, scattered photons and optic phonons present in the initial state. For spontaneous Raman scattering ns can be taken to be zero. The final zero in the bra end ket denotes the electronic ground state.
The summation indices a,b run over complete sets of intermediate states for the whole system, and the summation over k is restricted to lie within solid -s angle drl.
part HEL contributes in the third matrix element . HER
and HEL are defined in reference 2 8. The electron
lattice interaction is treated by the deformation
potential approximation. An additional long-range
electrical interaction is included in HEL for Raman
scattering by polar lattice vibrations. If the
expres sions for HER and HEL are substituted into
equation (1. 30 } the scattering probability becomes
w
= 4 3 4 1T e .io.3 4 2 2MNu m n a -J -s k . , k E
n (n .+l} 0 J 0
w w w( . } 0 S J
X
I s�
Ri (-w , w , w(�} }1
2Jkj OS O S J
( 1. 31}
where
l E
v
a,S (w0+w(<?}-w } (w -w }
µ J o a o
+ five similar terms J.
The various symbols are defined as follows: e
=
electron chargem
=
electron mass=
optical dielectric constant a=
lattice constant=
reduced mas s of the lattice atomsbut
N
=
number of unit cells in the crystalV
=
crystal volume� - k =
-J-j
unit vector which depends on the directionnot the magnitude of k . . -J
Ri
=
Raman scattering tensor for non-polarOS
phonons . The subscripts o,s refer to the polarization
directions of the photons w , w •
0 S The repeated index
i is to be summed over x, y and z, and refers to the
direction of polarization of the phonon .
P0 s f3
=
electron momentum matrix element between states l o > and I s>. Superscript s is a polarization index.=!
a=
deformation potential related to thematrix element <S IBEL ia>. The indices a,f3 specify s ingle electron-hole pair states with energies hw , a
The six terms in ROS i arise from the six
different time-ordered scattering proces ses. Signs
attached to the frequencies in R�s ( w) are chosen so
that a negative (positive) frequency corresponds to
destr�ction ( creation) of the appropriate photon or
phonon . In general, R iOS i s not invariant under
interchange of the polarizations of the incident and
i 0
R OS ( - w O S ,w , w ( . } )
J i
O O 0
=
R so (- w + w ( . ) ,w + w ( . ) , -w( . ) )O J S J J
0 0
for w 0
=
w S + w ( . ) . However , when w ( . ) is sufficientlyJ J
small that it can be neglected in comparison with all i
other frequencies occuring in the tensor , R becomes OS symmetric . Thus R has the same symmetry properties OS i as the Born-Bradburn polariz ability tensor.
Loudon ' s theoretical work has given considerable impetus to experimental Raman spectroscopy , particularly in the investigation and understanding of Raman
scattering by polaritons .
2 9
The theory of Birman and Ganguly takes
special account of the role of exciton states in Raman scattering. They as sume that the virtual intermediate states are exciton states because the Coulomb interac tion is always present between the electrons and the holes . Accordingly they consider the basic electron
. h . ' t t ' 31
system in t e Wannier exciton represen a ion ,
Loudon ' s result. But at resonance there is a marked difference between the two theories. Recent
experimental work on the resonance-enhanced Raman
scattering in Insb3 2 and the multiple-phonon resonance
Raman effect in Cds33 13 4 supports the Birman-Ganguly theory. These experiments clearly indicate that the exciton states must be considered. Burstein et. a1.35 give a more detailed treatment of the exciton-photon interaction in explaining exciton enhanced Raman
scattering. Their theory is formulated in terms of the scattering of polaritons by optical phonons via the exciton part of the coupled modes.
3 0
Johnson ' s theory concentrates on developing a
realistic concept of the crystal phonon spectrum and the photon-phonon coupling through a microscopic
approach. He shows that there is a striking parallel between the phonon spectrum and the two-phonon scatter ing tensors , and establishes the relationship between two-phonon scattering and the electronic terms in the phonon spectrum. This theory is too new yet to be fully tested.
of new techniques developed by Porto and co-workers has enabled a rapid advancement in experimental Raman
C H A P T E R 2
THE RAMAN SPECTROMETER
The major components of a Raman spectrometer are the light source, the spectrum analyser, and the
detector. Each of these components will be discussed separately and then together, when evaluating the per
formance of the complete system .
2. 1 The Source
The requirements of a Raman light source are (1) high intensity, because Raman scattering
efficiencies are very low (of the order of 10-7 for phonon scattering2 8) ; (2) true monochromatic light,
because Raman lines can never be narrower than the linewidth of the exciting light; and (3 ) variable frequency, so as to avoid absorption and fluorescence problems associated with coloured samples . It would also help if the light source had a definite
polarization and direction as this enables symmetry assignment of the Raman spectra of crystals.
mentioned above, and are far superior to the convention al Raman sources such as the low-pressure mercury arc lamp. The advantages of lasers and their experimental utilization have been outlined in a review paper by Weber. 36
We have chosen an argon ion laser as the Raman source. The reasons for this choice were (1) the argon laser gives the highest continuous output power in the visible of all the gas lasers commercially available, (2) it will operate on at least seven
wavelengths in the blue-green region of the spectrum, (3) the laser may be operated at yellow and red
wave-lengths by changing the gas to krypton, and (4)
4
because of the v dependence in the scattering intensity formula it is advantageous to work with blue laser
lines whenever possible.
The laser purchased was a Spacerays, Inc. model 5600 argon ion laser. This laser can produce a
maximum of 5 watts output power distributed over the seven wavelengths 4579, 4658, 4 765, 4 8 80, 4965, 5017 and 514SR. Of the total output approximately 80 % of
conventional laser-cavity concave mirrors with a Brewster-angled reflecting prism. 37 The operating
wavelength is selected by rotating the prism . There is an added bonus in that the laser cavity is now hemi spherical , so that full output power may be obtained
in the lowest-order radial mode . The laser lines have
a half-width of about 0 . 15 cm -1
The d. c. gas discharge is contained in a water cooled fine-bore quartz tube surrounded by a plasma pinching solenoidal magnet. The anode and cathode are placed off-axis , and the ends of the discharge tube are sealed with replaceable Brewster ' s-angle windows. The system is particularly attractive to us because the laser is completely demountable for maintainence
purposesr and the continuous gas flow design allows the use of industrial grade argon gas. The disadvantages are the fact that the Brewster windows need replacing every 15 operating hours because of contamination , 38 and that the cathode needs reactivating every 30 hours . However, neither of these operations is difficult or time consuming .
[image:50.490.39.425.75.641.2]laser. These safety glasses are part of a set of
39
safeguards that are used to protect operating
personnel. It cannot be over-emphasized that the argon laser beam is dangerous. A low power He-Ne laser is used for optical and other alignment work associated with the Raman spectrometer. This laser too is
sufficiently powerful to cause eye damage.
2. 2 The Spectrum Analyser
The requirements of the spectrum analyser are (1) a medium resolving power consistent with high optical speed; (2) a low stray light factor, because Raman scattering is so weak compared with Rayleigh scattering ; and (3) the use of gratings as the disper sive elements, because of their near linear wavelength dispersion and general superiority over prisms . A double (or even triple) grating monochromator would be ideal, especially if it had a wavenumber grating drive. A detailed investigation4 0 of light scattering within grating instruments demonstrated that a double mono chromator is essential if weak Raman spectra ere to be observed. The use of interferometrically ruled
gratings is advisable because of their low ghost
. . 4 1
At the time we purchased our first double mono chromator only two manufacturers, Spex and Jarrell-Ash, were producing suitable spectrometers. The instrument decided upon was the Jarrell-Ash 1/3 m - 1 m double
42
monochromator system. The reasons for this decision were (1) private enquiries had shown that the early models of the Spex tandem 3/4 m spectrometer were not altogether satisfactory, (2) the Jarrell-Ash double 1 m system was not yet operational, and was certain to be too expensive, (3) the 1/3 m - 1 m system was as
efficient optically as the Spex 3/4 m and had the advantage of increased resolution, (4) the 1/3 m unit was easily removeable so that the 1 m section could be used with other equipment in separate experiments, and (5) by opening up the slits on the 1/3 m unit the 1 m section could be used as a photographic instrument or for signal averaging (to be described later) without separating the monochromators. The one major
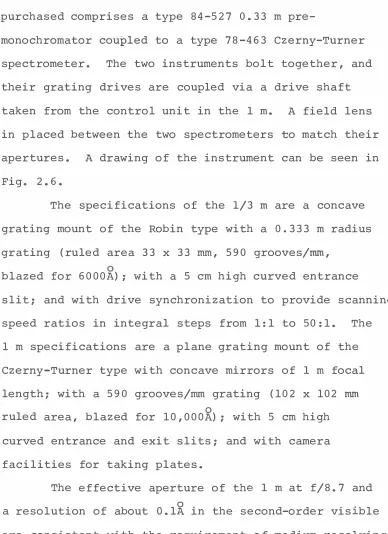
The 1/3 m - 1 m double monochromator system as purchased comprises a type 84-527 0. 33 m pre
monochromator coupled to a type 78 -463 Czerny-Turner spectrometer. The two instruments bolt together, and their grating drives are coupled via a drive shaft taken from the control unit in the 1 m. A field lens in placed between the two spectrometers to match their apertures. A drawing of the instrument can be seen in Fig. 2. 6.
The specifications of the 1/3 m are a concave grating mount of the Robin type with a 0. 333 m radius grating (ruled area 33 x 33 mm, 59 0 grooves/mm,
blazed for 60 00A) ; with a 5 cm high curved entrance
slit ; and with drive synchronization to provide scanning speed ratios in integral steps from 1: 1 to 50 : 1. The 1 m specifications are a plane grating mount of the Czerny-Turner type with concave mirrors of 1 m focal length ; with a 59 0 grooves/mm grating (102 x 102 mm ruled area, blazed for 10, oooR) ; with 5 cm high
curved entrance and exit slits ; and with camera facilities for taking plates.
[image:55.499.46.434.87.621.2]power and high optical speed. The use of curved slits means that the full resolution is obtained at full
slit height . This is an important factor in photo electric work where the use of maximum slit height can increase the signal level. The 1 m grating was
chosen for use over a wide spectral region to cope with other experimental requirements . Consequently
the grating parameters are not optimised for Raman
spectroscopy. The grating will be used in second-order for work in the soooR region. As a result the grating ghosts will be more prominent than those for a
. · 1 f ' d ' 41
s1m1 ar irst-or er grating .
In a double monochromator the dispersions of the individual elements may be crossed or additive. 4 3
If the two monochromators are identical then this is an important effect. Here , however, the 1/3 m
dispersion is much less than that of the 1 m , and only the 1 m dispersion need be considered.
2. 3 Spectrometer Dispersion
width, which is related to the mechanical slit width by
spectral slit (cm-1) =
(
av)
X mechanical slit (mm) •ax
av
The reciprocal linear dispersion ax is the relating function. This function can be derived from the
1 . t ' 44
genera grating equa ion
( 2 .1)
nA
=
d (sin i + sin 8) , (2.2)where A is the wavelength of the light incident at
angle i and diffracted at angle e by the plane grating, d the grating spacing, and n the diffraction order.
The reciprocal angular dispersion is obtained by differentiating equation (2. 2) with respect to 8 ;
= d cos 8 n ( 2. 3)
Here it has been assumed that i is constant, which implies that the grating is stationary. This formula is the one most often quoted in the literature. It is seldom noted that e can be eliminated from the equation if i
=
O. For then equation (2 . 2) becomesnA
=
d sin 8,cos 0 =
[1 -
(n�)2} ½,so that
dA A [ (�) 2
- 1]
½.
( 2. 4)d0 = n A
The reciprocal linear dispersion in the focal plane of
the spectrometer is given by
=
using dx = fd0, where f is the focal length of the
spectrometer ' s exit mirror.
( 2 . 5)
The dispersion formulae (2. 3 ) and (2.5) both
apply to a photographic instrument where the grating
is fixed. A photoelectric instrument with fixed
slits determines a unique light path, so that the
grating must be rotated in order to scan the spectrum.
Equations (2.3) and (2. 5) no longer apply, and a search
of the relevant review literature failed to produce
a substitute . This made it necessary to derive a
suitable formula from first principles . *
*Subsequent to this work a similar derivation was
45
published by Hard and Lord. They omit the minus
If a is the angle between the incident light
and the spectrometer axis (see Fig . 2. 2 ( a) ) then
i = 9 - 2a (2.6)
and equation (2. 2) becomes
nA
=
2d sin ( 8- q) cos a. ( 2 . 7)This is an exact equation with variables A and 8.
Differentiating equation (2 .7) with respect to 8 gives
= 2d n cos ( 8- a) cos a.
Using equation (2. 7) to eliminate the cos ( 8-a) term we find
dA A [(2d cos a)2 _
1]
½
.
d8
=
nA ( 2 . 8)Or, in terms of wavenumber \)
,
dv v[<2vd �os a)2
- 1
] ½
.
ae
=
( 2 . 9)The angle of rotation of the grating is 8-a = i + a.
Rotating the grating by angle 0 8 means that the
diffracted angle changes by 26 8, as the incident light has a fixed direction . Therefore dx = f.2d8 , and the
entrance slit
100
80
dv 60 dx
{cm-1 /mm) 40
20
0
4
Fig. 2 . 2. ( a)
{ b )
grating normal
{ a )
spectrometer axis
10
8
6 d A dx
0 �A,. .r..r:-., 4
2
0
5 6 7 8
0
10- 3 )
Wavelength {A X
{ b )
Optical path and grating angles
in a Czerny-Turner spectrometer.
[image:60.497.36.451.37.654.2]d>-.d >-.
[(2 d cos a) 2 _ 1
1 ½
,
ax
= 2f n >-.or
dv
d -\) [2vd
dx = - TI
This may be compared with
d>-. s d cos
e
dx = fn
,
or
dv s v2d cos
dx fn
from equation (2 . 3), and
or
dv s
dx
::::
::::
a)2 _ 1
1
½
.
cos
n
e
( 2 .10)
(2.11)
( 2 . 12 )
from equation (2 . 5) . It is proposed that equation (2. 10) be called the dynamic dispersion to distinguish it from equations (2. 11) and (2. 12) which refer to the static case.
Equations (2. 10) and (2. 12) are plotted as a
function of wavelength in Fig. 2 .2(b) . The dispersion
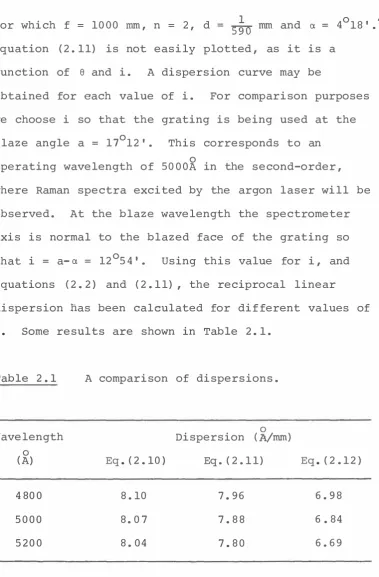
for which f = 10 00 mm, n = 2, d = � mm and a = 4°181 •46
Equation (2.11) is not easily plotted, as it is a function of e and i. A dispersion curve may be
obtained for each value of i. For comparison purposes we choose i so that the grating is being used at the blaze angle a = 11°121
• This corresponds to an
operating wavelength of 50 ooR in the second-order, where Raman spectra excited by the argon laser will be observed. At the blaze wavelength the spectrometer axis is normal to the blazed face of the grating so that i = a- a = 12°54' . Using this value for i, and
equations (2.2 ) and (2.11) , the reciprocal linear
dispersion has been calculated for different values of
e. Some results are shown in Table 2.1.
Table 2.1 A comparison of dispersions.
Wavelength Dispersion ( A/mm) 0
0
(A) Eq. (2 .10 ) Eq. ( 2 .11) Eq. (2.12 )
480 0 8.10 7. 96 6.9 8
5000 8.0 7 7.8 8 6.84
520 0 8.04 7.80 6.69
0
[image:62.495.53.433.52.630.2]